Previous Article in Journal
Unveiling Ancestral Sustainability: A Comprehensive Study of Economic, Environmental, and Social Factors in Potato and Quinoa Cultivation in the Highland Aynokas of Puno, Peru
Previous Article in Special Issue
Implementation of a Long Short-Term Memory Transfer Learning (LSTM-TL)-Based Data-Driven Model for Building Energy Demand Forecasting
 
 
Order Article Reprints
Article

Experimental Investigation on the Performance of Compressors for Small-Scale Compressed Air Energy Storage in Parallel Mode

1
Key Laboratory of Enhanced Heat Transfer and Energy Conservation of MOE, Beijing Key Laboratory of Heat Transfer and Energy Conversion, Faculty of Environment and Life, Beijing University of Technology, Beijing 100124, China
2
Mechanical Engineering, Richard J. Resch School of Engineering, University of Wisconsin-Green Bay, Green Bay, WI 54311, USA
*
Authors to whom correspondence should be addressed.
Sustainability 2023, 15(17), 13164; https://doi.org/10.3390/su151713164 (registering DOI)
Received: 29 June 2023 / Revised: 11 August 2023 / Accepted: 28 August 2023 / Published: 1 September 2023

Abstract

:
The Compressed Air Energy Storage (CAES) system is a promising energy storage technology that has the advantages of low investment cost, high safety, long life, and is clean and non-polluting. The compressor/expander is the core equipment of the CAES system, and its performance has a decisive impact on the overall system efficiency and economic performance. Based on the pneumatic motor, this study proposes and designs a test bench of the CAES system that integrates compression and expansion functions. The off-design operation condition represented by the pressure change in the air tank has an important influence on the efficiency and economy of the CAES system. The effect of key parameters such as air tank pressure, torque, and mass flow rate on the output and efficiency of the compressor is investigated. When the CAES system is operating in energy storage mode, the compressor must continuously deliver gas to the gas storage. The working pressure of the compressor increases with the pressure in the air tank, so the compressor used for energy storage must operate continuously over a wide range of working conditions. The parallel operation mode of the compressor is proposed to improve the working condition range of the compressor torque and current, and improve the isotropic efficiency. When the air receiver pressure is 2.6 bar and the rotational speed is 2850 r/min, the power consumption of the compressor reaches the maximum value of approximately 1233.1 W. This new parallel mode could provide a CAES unit a systematic solution.

1. Introduction

Energy storage technology could promote and develop the use of renewable energy and solve energy and environmental problems [1]. Although human activities have been limited recently, climate issues have become more urgent than ever [2]. Nowadays, the compressed air energy storage unit has many advantages such as low investment cost, high safety, long life, and no pollution [3]. The CAES unit could solve shortcomings of renewable energy fluctuation and intermittency such as photovoltaic, tidal, and wind power. The CAES unit could use off-peak electricity to compress, transport, and store the air in the tank, then release the compressed air during peak electricity demand to drive the generator to produce electricity.
The compressor and expander play an important role in a CAES unit. There is a high correlation between their performance and the overall efficiency of the system. The compressor must continuously draw gas from the tank when the CAES unit is operating in storage mode. The chamber pressure increases with the gas flow injected into it, so the compressor used for energy storage operates under variable conditions as the tank pressure increases. This could lead to a large pressure ratio between the outside and the tank. Christos et al. [4] tried to study the real gases and ideal gases in the reciprocating expanders and compressors. His work related the losses to the properties. Mustapha et al. [5] investigated a process of the compression-cooling-expansion cycle using the volume of fluid model based on 3D CFD and tried to understand the transmission mechanism. He found that liquid pistons could realize the isothermal process of CAES. Chen et al. [6] compared isothermal CAES, closed isothermal type I-CAES, and open type O-CAES, and found that closed isothermal type I-CAES had doubled energy storage density. Compression and expansion could reach the isothermal process when the air temperature is below 5 °C, and the round-trip efficiency is 76%. Li [7] tried to improve the isothermal process in this case and used porous media to increase the energy storage density. Overall, this method could maintain high efficiency and energy storage density. Chen et al. [8] established an off-design model, validated the model via experimental data, and adopted the potential induced degradation strategy to control the air temperature.
Compressors can be divided into volumetric compressors and speed compressors. Volume type is also divided into reciprocating compressors, rotary compressors, and scroll compressors. Speed type compressors are divided into axial compressors and centrifugal compressors. Liu et al. [9] investigated the characteristics and the flow field and analyzed the effect of radial clearance on the performance of the scroll compressor. The results showed that the leakage has an important influence on the distribution of the velocity field and the uneven distribution of the temperature field. Ma et al. [10] developed a hybrid model of a scroll compressor based on fundamental physical principles and thermodynamics, and the proposed model was validated by experimental results. The results showed that the maximum error between experimental data and model results is within 10%. Wu et al. [11] focused on single-screw expander lubrication and tried to compare six different lubricant viscosities. The result showed that higher kinematic viscosity could improve volumetric efficiency and smaller clearance, and the internal volume ratio had higher efficiency and a lower gas consumption rate. In Mahbod et al.’s work [12], a multi-stage quasi-isothermal CAES was promoted. This model had a lower cost compared to batteries for longer-term storage solutions. Chen et al. [13] focused on two strategies of centrifugal compressors to control the pressure ratio range. The result showed that adjustable inlet guide vanes increased the pressure range by 207.3%. In the contract, adjustable inlet guide vanes increased the pressure range by about 72.6% for compressor operation and control in the CAES system. Lin et al. [14] investigated the influence of adjustable vaned diffusers on the impeller backside cavity and the aerodynamic performance of centrifugal compressors, focusing on pressure ratio, efficiency, torque, shaft power, and axial thrust. He found that as the mainstream flow decreases or rotation speed increases, the predicted or measured gradients of radial static pressure and static temperature increases. After one year, he investigated the effect of rotational speed and variable angles on the aerodynamic performance of centrifugal compressors [15]. Then, he investigated the static temperature and static pressure of the impeller backside cavity in a centrifugal compressor [16]. The results indicated that the impeller backside cavity has an important effect on the efficiency, shaft power, and pressure ratio of the centrifugal compressor. Meng et al. [17] established a centrifugal compressor test rig to investigate the off-design performance. Experimental results showed that the maximum value efficiency could be improved by 3.28% with the angle of adjustment of inlet guide vanes varying from −20° to 50°. Xue et al. [18] investigated the effect of the diffuser and impeller on the internal unsteady flow phenomena to illustrate the mechanism of flow instabilities via experimental results. Chen et al. [19] established a thermodynamic model considering energy loss analysis to investigate the compression performance with variable charge pressure of a multi-stage centrifugal compressor. The results indicated that the exergy and compression efficiency could reach up to approximately 82% and 80%, respectively. Based on his previous results, he [13] proposed adjustment strategies with adjustable vaned diffusers and adjustable inlet guide vanes to investigate the off-design performance via experimental results. The results indicated that the maximum efficiency could be improved by 1.2% with the proposed strategies. Cao et al. [20] established a thermodynamic model of an adiabatic CAES system with only one ejector alongside the final stage compression via simulation investigation. The results showed that the exergy and roundtrip efficiency of the proposed system could be improved.
The performance of the compressor, especially the efficiency, has an important impact on the economy of the whole compressed air energy storage system. Patil et al. [21] investigated the heat transfer enhancement in a liquid piston compressor using aqueous foam by achieving isothermal compression to improve efficiency. The results showed that efficiency could be improved by 4–8% using the proposed technology. Zhang et al. [22] proposed a novel system with an inverter-driven air compressor to investigate the economic, exergy, and dynamic characteristics, and to reduce the throttling loss of the adiabatic CAES system. The results showed that the round-trip efficiency of the proposed system could be improved by 1.8–5.7% and thus the cost of electricity is decreased. Khaljani et al. [23] investigated the environmental and economic characteristics of small-scale CAES systems via a combined experimental and modeling study with a liquid piston gas compressor/expander. Results indicated that the maximum round-trip efficiency could reach up to 63%. In the same year, his team [24] developed a liquid piston gas compressor prototype with aluminum parallel plates to increase compression efficiency. Experimental results indicated that when the plate inserts with a height of 0.2 m, 0.35 m, and 0.5 m, the compression efficiency could be increased by approximately 3%, 4%, and 8%, respectively. Rice et al. [25] proposed an optimal trajectory control method to solve the trade-off between power density and efficiency. The results showed that the proposed solutions could improve the power density and keep efficiency unchanged. Yao et al. [26] discovered a novel hybrid CAES system that could reach near-isothermal compression on the same pressure ratio. The proposed system could achieve the highest efficiency of 72.47% when the storage pressure is as high as 11 MPa. Wieberdink et al. [27] proposed the concept of a liquid piston compressor/expander and investigated the influence of porous media inserts on power density and efficiency via experiment and simulation. Li et al. [28] proposed a liquid piston compressor/expander with an optimal intensifier ratio via a hydraulic intensifier to reduce the flow requirement. Hu et al. [29] built a compressor/expander with a tubular heat exchanger to increase the efficiency and power density. The results showed that reducing the tube diameter could improve the efficiency and power density. He et al. [30] established a thermodynamic model of a CAES system with an adjustable pressure ratio to improve efficiency. The results showed that the CAES system with adjustable pressure ratio could reduce power consumption, increase the work output, and improve efficiency via the CAES system with variable pressure ratio. Srivatsa et al. [31] developed a compressor/expander considering water condensation/evaporation to investigate the effect of moisture on compression power and efficiency. The results indicated that the increase in the specific heat capacity of air could improve efficiency. Patil et al. [32] proposed a method of heat transfer enhancement using metal wire mesh to improve compression efficiency via experimental results. The results indicated that using metal wire mesh could obtain an improvement in the efficiency of 6–8%. Xu et al. [33] used compressed air to drive a pneumatic motor to generate electricity. The experimental results show that the increase in the regulator valve and the electronic load lead to the expansion ratio of the pneumatic motor, the temperature difference, and the pressure difference increase. Then, his work [34] used compressed air to drive a pneumatic motor, which is controlled by a magnetic powder brake. The experiment showed that the power output and energy efficiency of pneumatic motors first increase and then decrease with the increase in torque. And the max output of the pneumatic motor could reach 410 W.
From the above literature review, it is well known that the compressor/expander is the core equipment of the CAES system, and its performance has an important impact on the overall system efficiency and energy storage economy. One of the key technologies to develop CAES is to improve the compressor’s ability to change working conditions efficiently and provide a safe and stable operation control scheme for the compressor. Based on the pneumatic motor, this study proposes and designs an experimental bench of the CAES system, which integrates compression and expansion functions. The off-design operation state, which is represented by the pressure change in the air tank, has an important influence on the efficiency and economy of the CAES system. When the CAES system is working in the state of energy storage, the compressor needs to continuously deliver gas to the air tank. The working pressure of the compressor increases with the increase in the pressure in the gas storage tank, so the compressor used for energy storage needs to operate continuously in a wide range of working conditions. The parallel operation mode of the compressor is proposed to improve the working condition range of the compressor. The influence of key parameters such as air tank pressure, torque, and mass flow rate on the output performance and efficiency of the compressor is investigated.

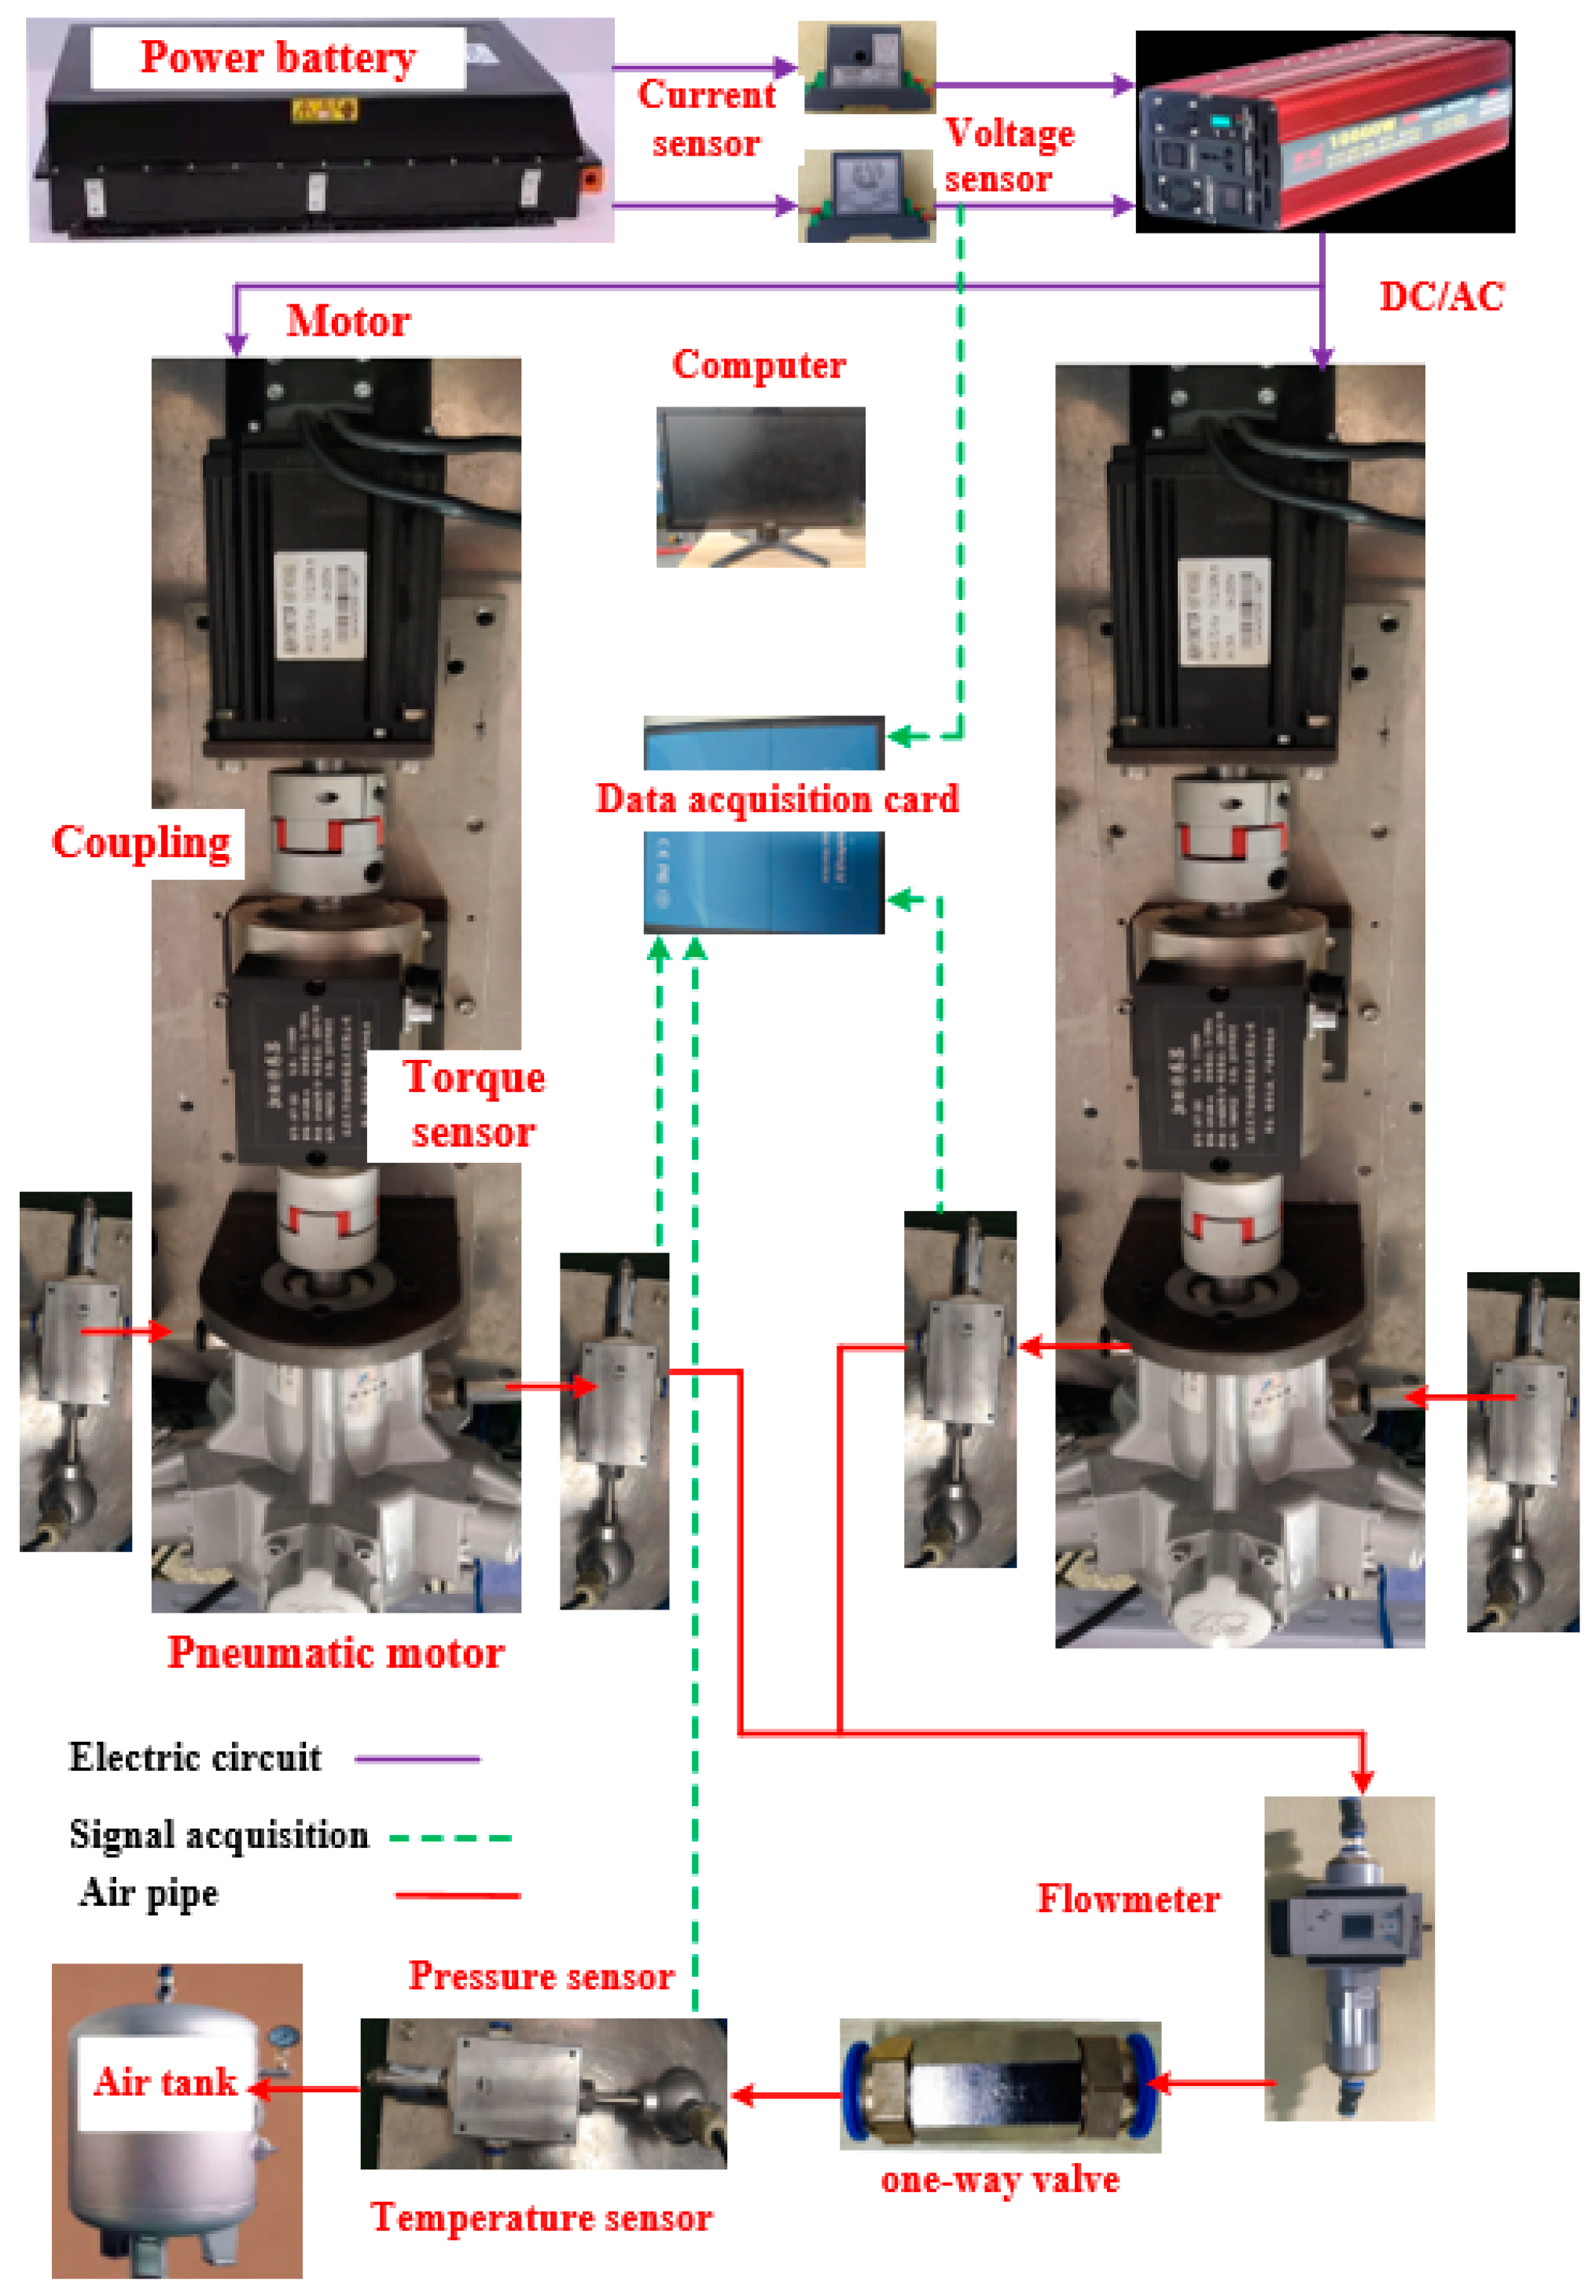
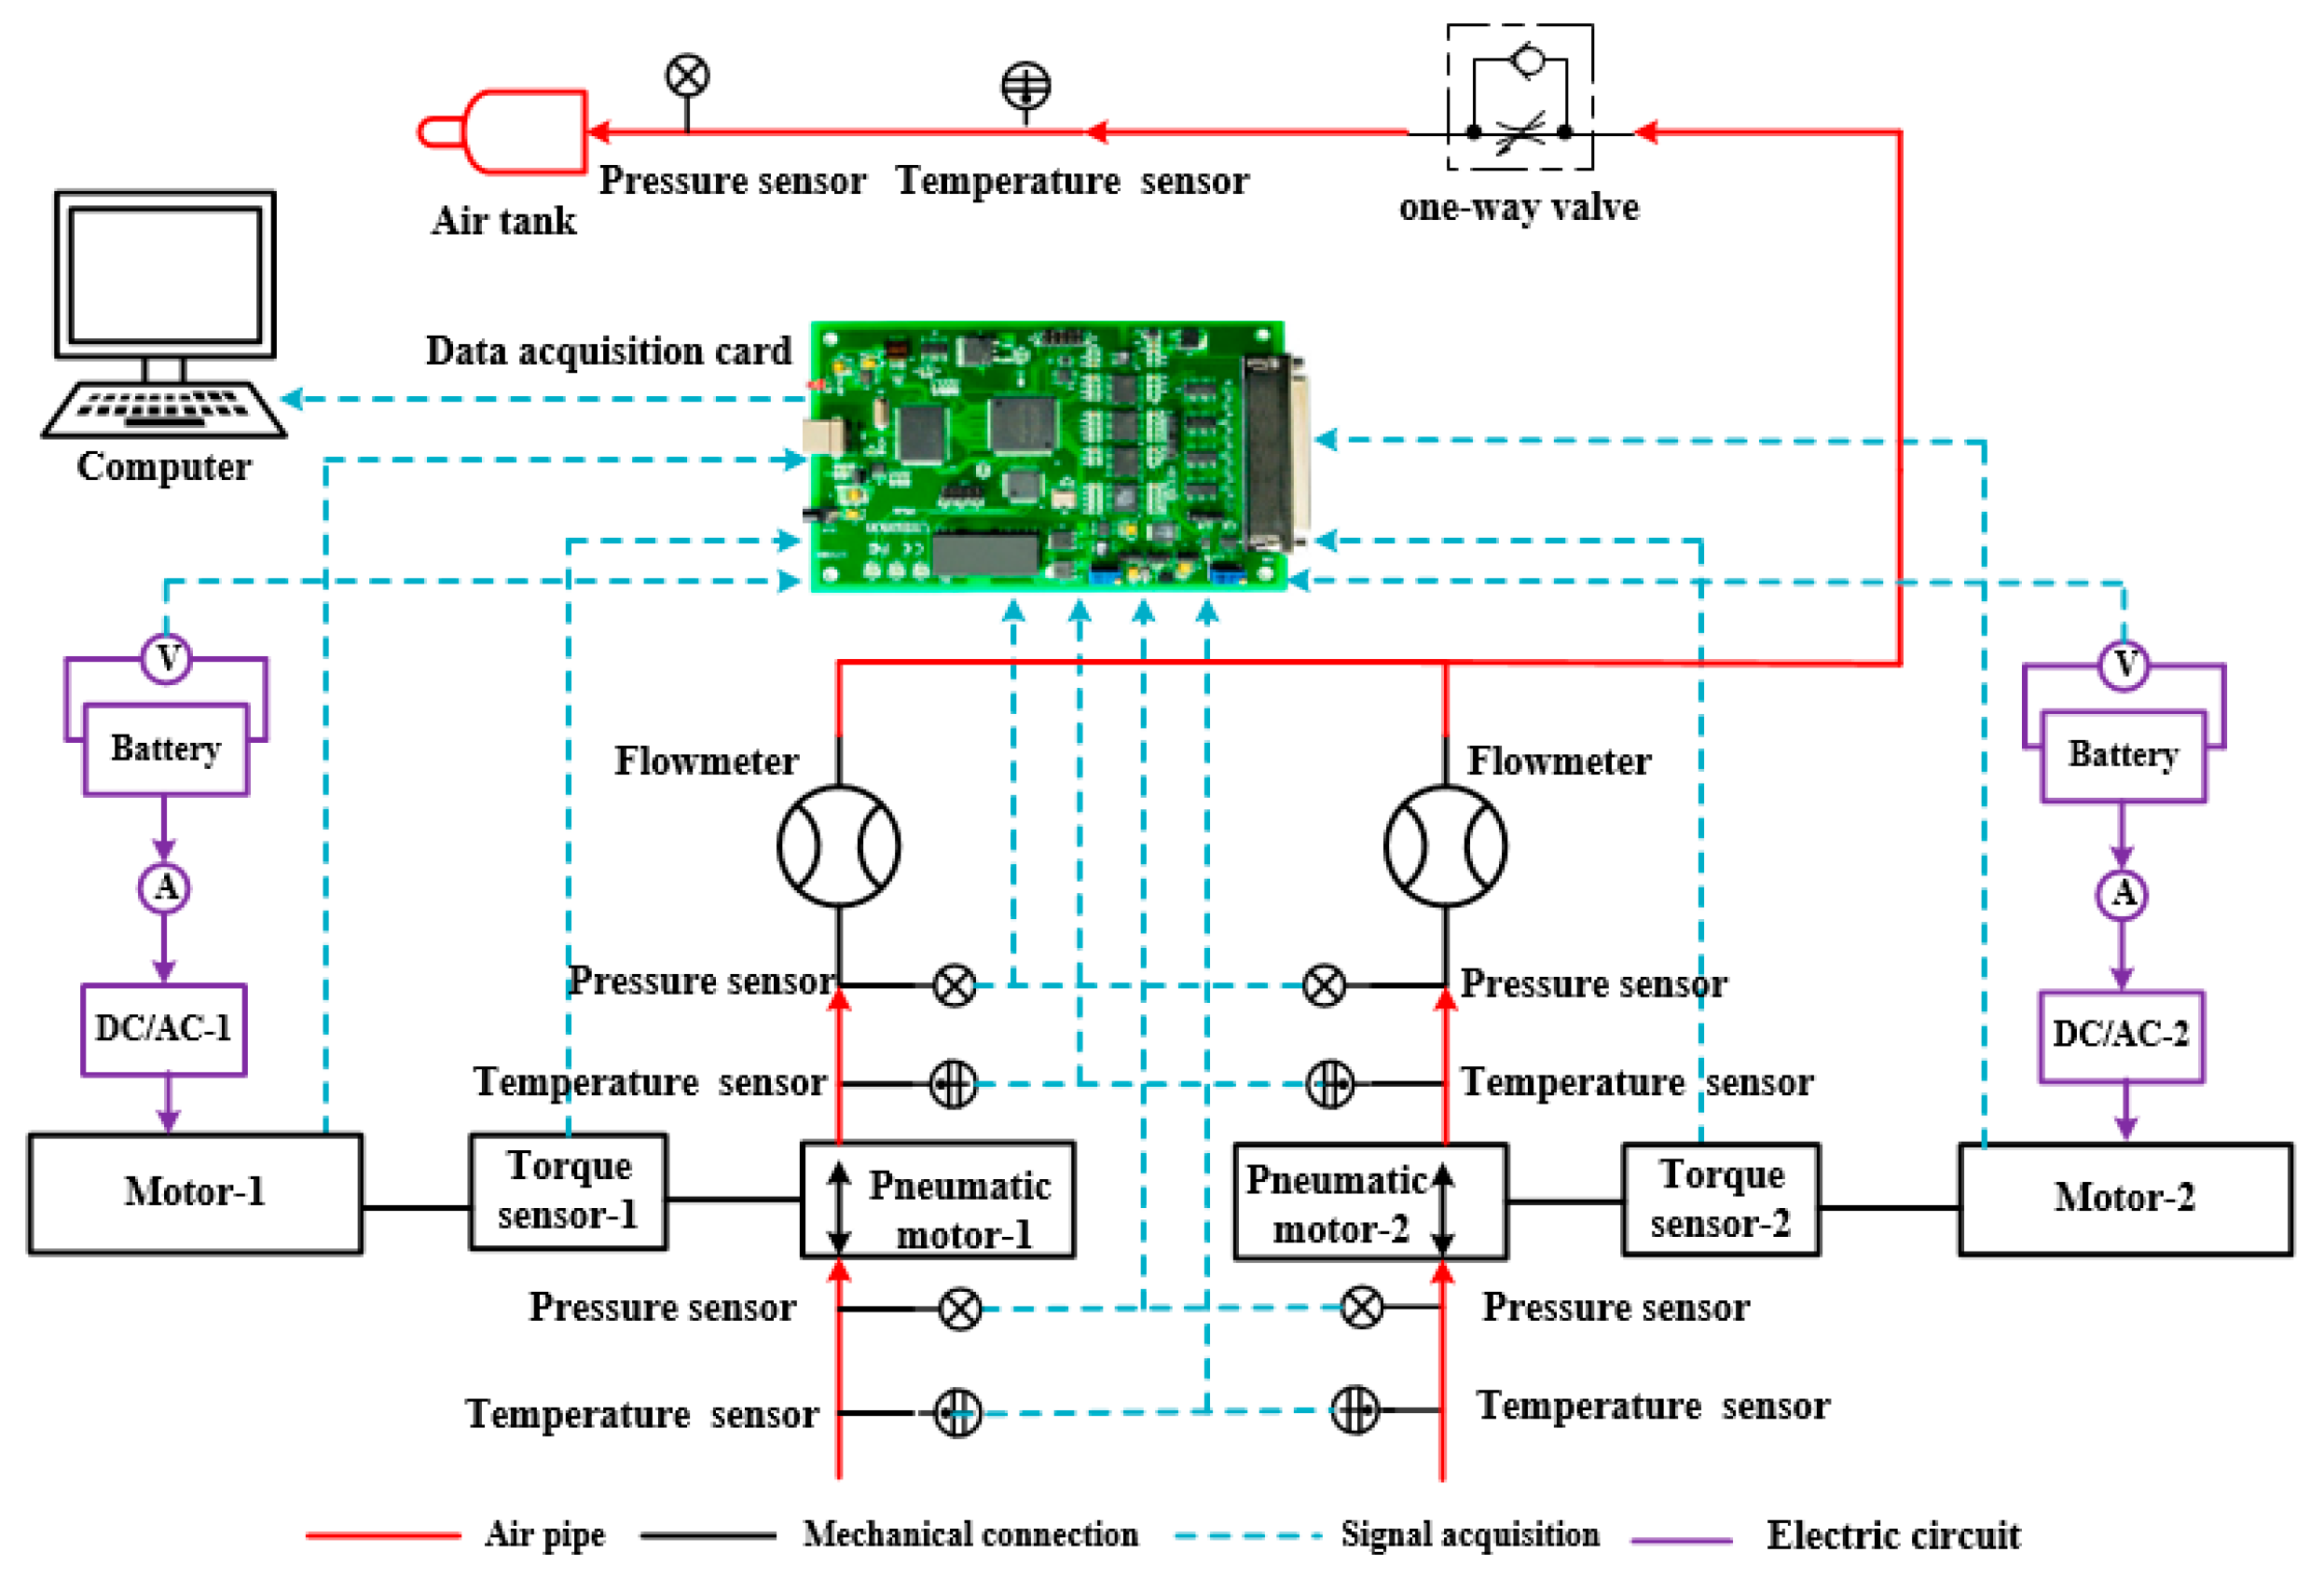
2. Experimental Setup

The test bench of the CAES system is mainly composed of a power battery, DC/AC, pneumatic motor (compressor), generator, coupling, data acquisition card, computer, rectifier, torque sensor, temperature and pressure sensor, flowmeter, check valve, and current and voltage sensor. The working principle is that the power battery is connected to the generator via DC/AC, and the generator drives the pneumatic motor to generate compressed air, which is stored in the air tank through the check valve. The temperature and pressure sensors are installed at the intake and outtake of the compressor. The volume flow rate of the compressed air generated by the compressor is measured by the flowmeter. The torque sensor is used to measure the rotational speed and torque of the compressor and generator. Figure 1 and Figure 2 are the test bench and schematic diagram for the parallel compressor mode of the CAES system, respectively. Table 1 and Table 2 are the test bench parameters.
This test bench adopts a pneumatic motor as a compressor, which has the advantages of small air consumption, good stability, high efficiency, low requirements for air quality, impact resistance, and small inertia. The five cylinders are arranged on the circumference of the pneumatic motor cast, and five crank slide mechanisms consisting of pistons, rods, and crankshafts are arranged in a star shape in the center of the pneumatic motor. The servo motor drives the compressor to compress air and stores it in the air tank.

3. Results and Discussion

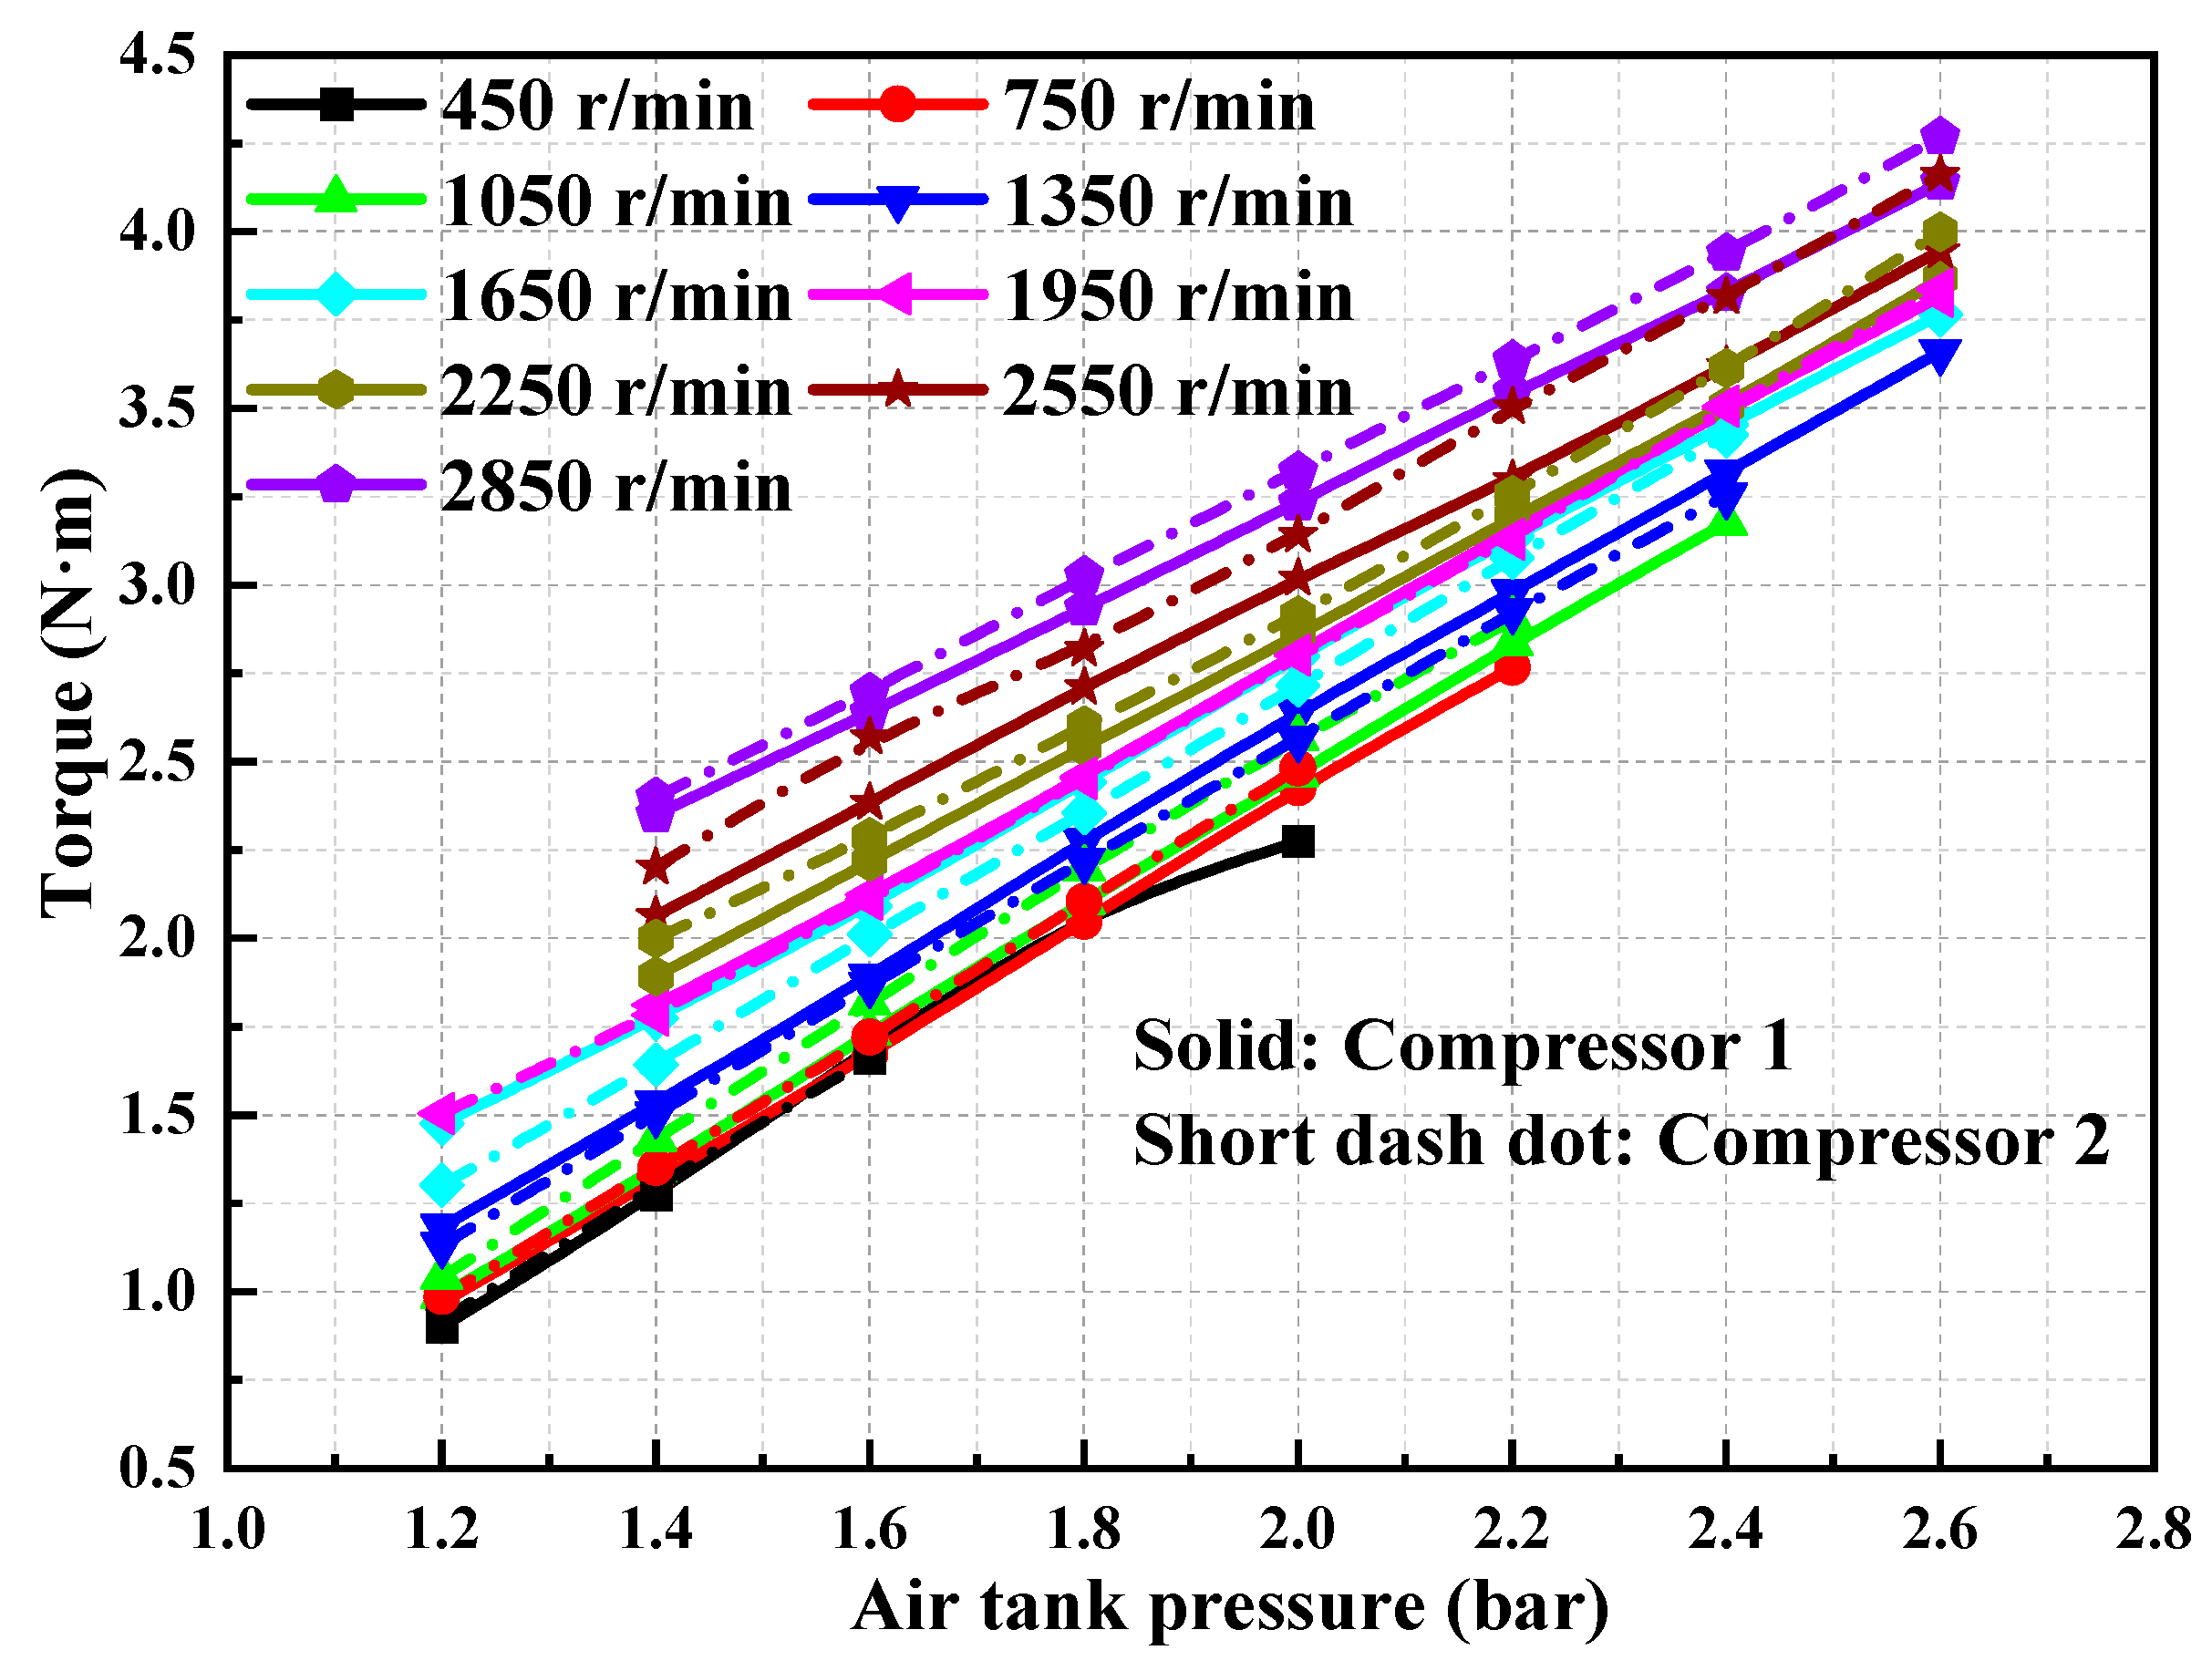
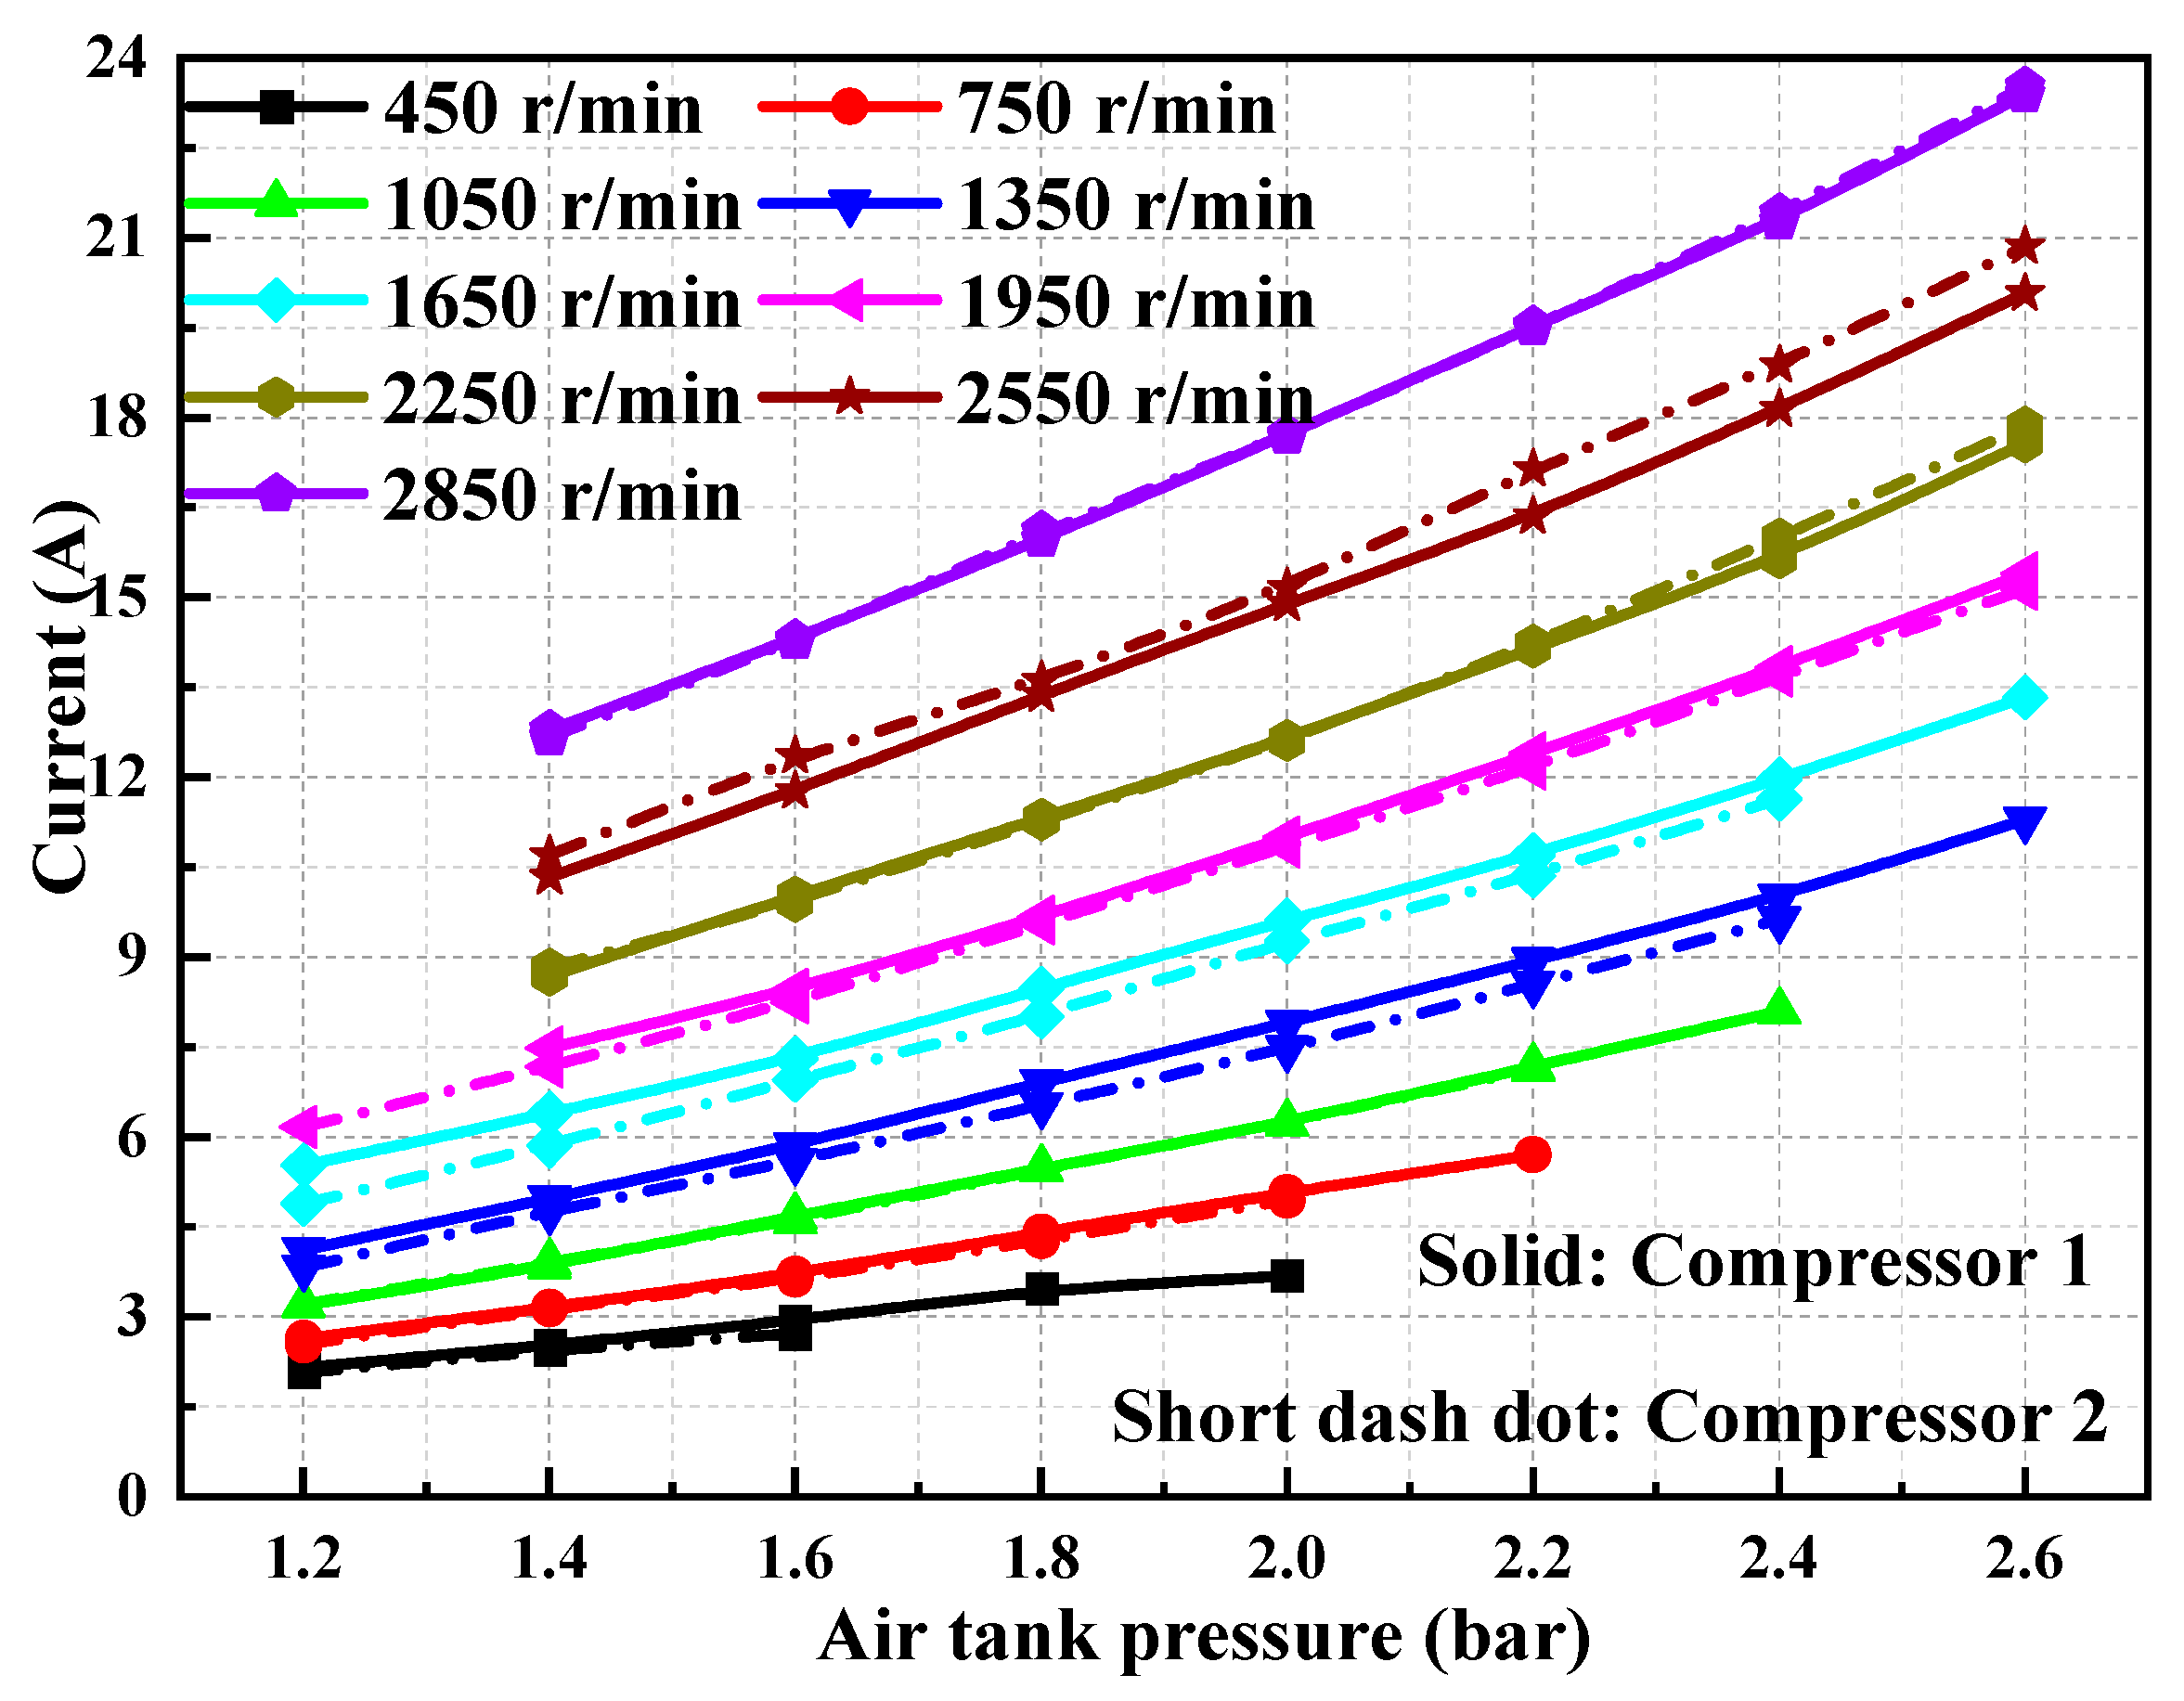
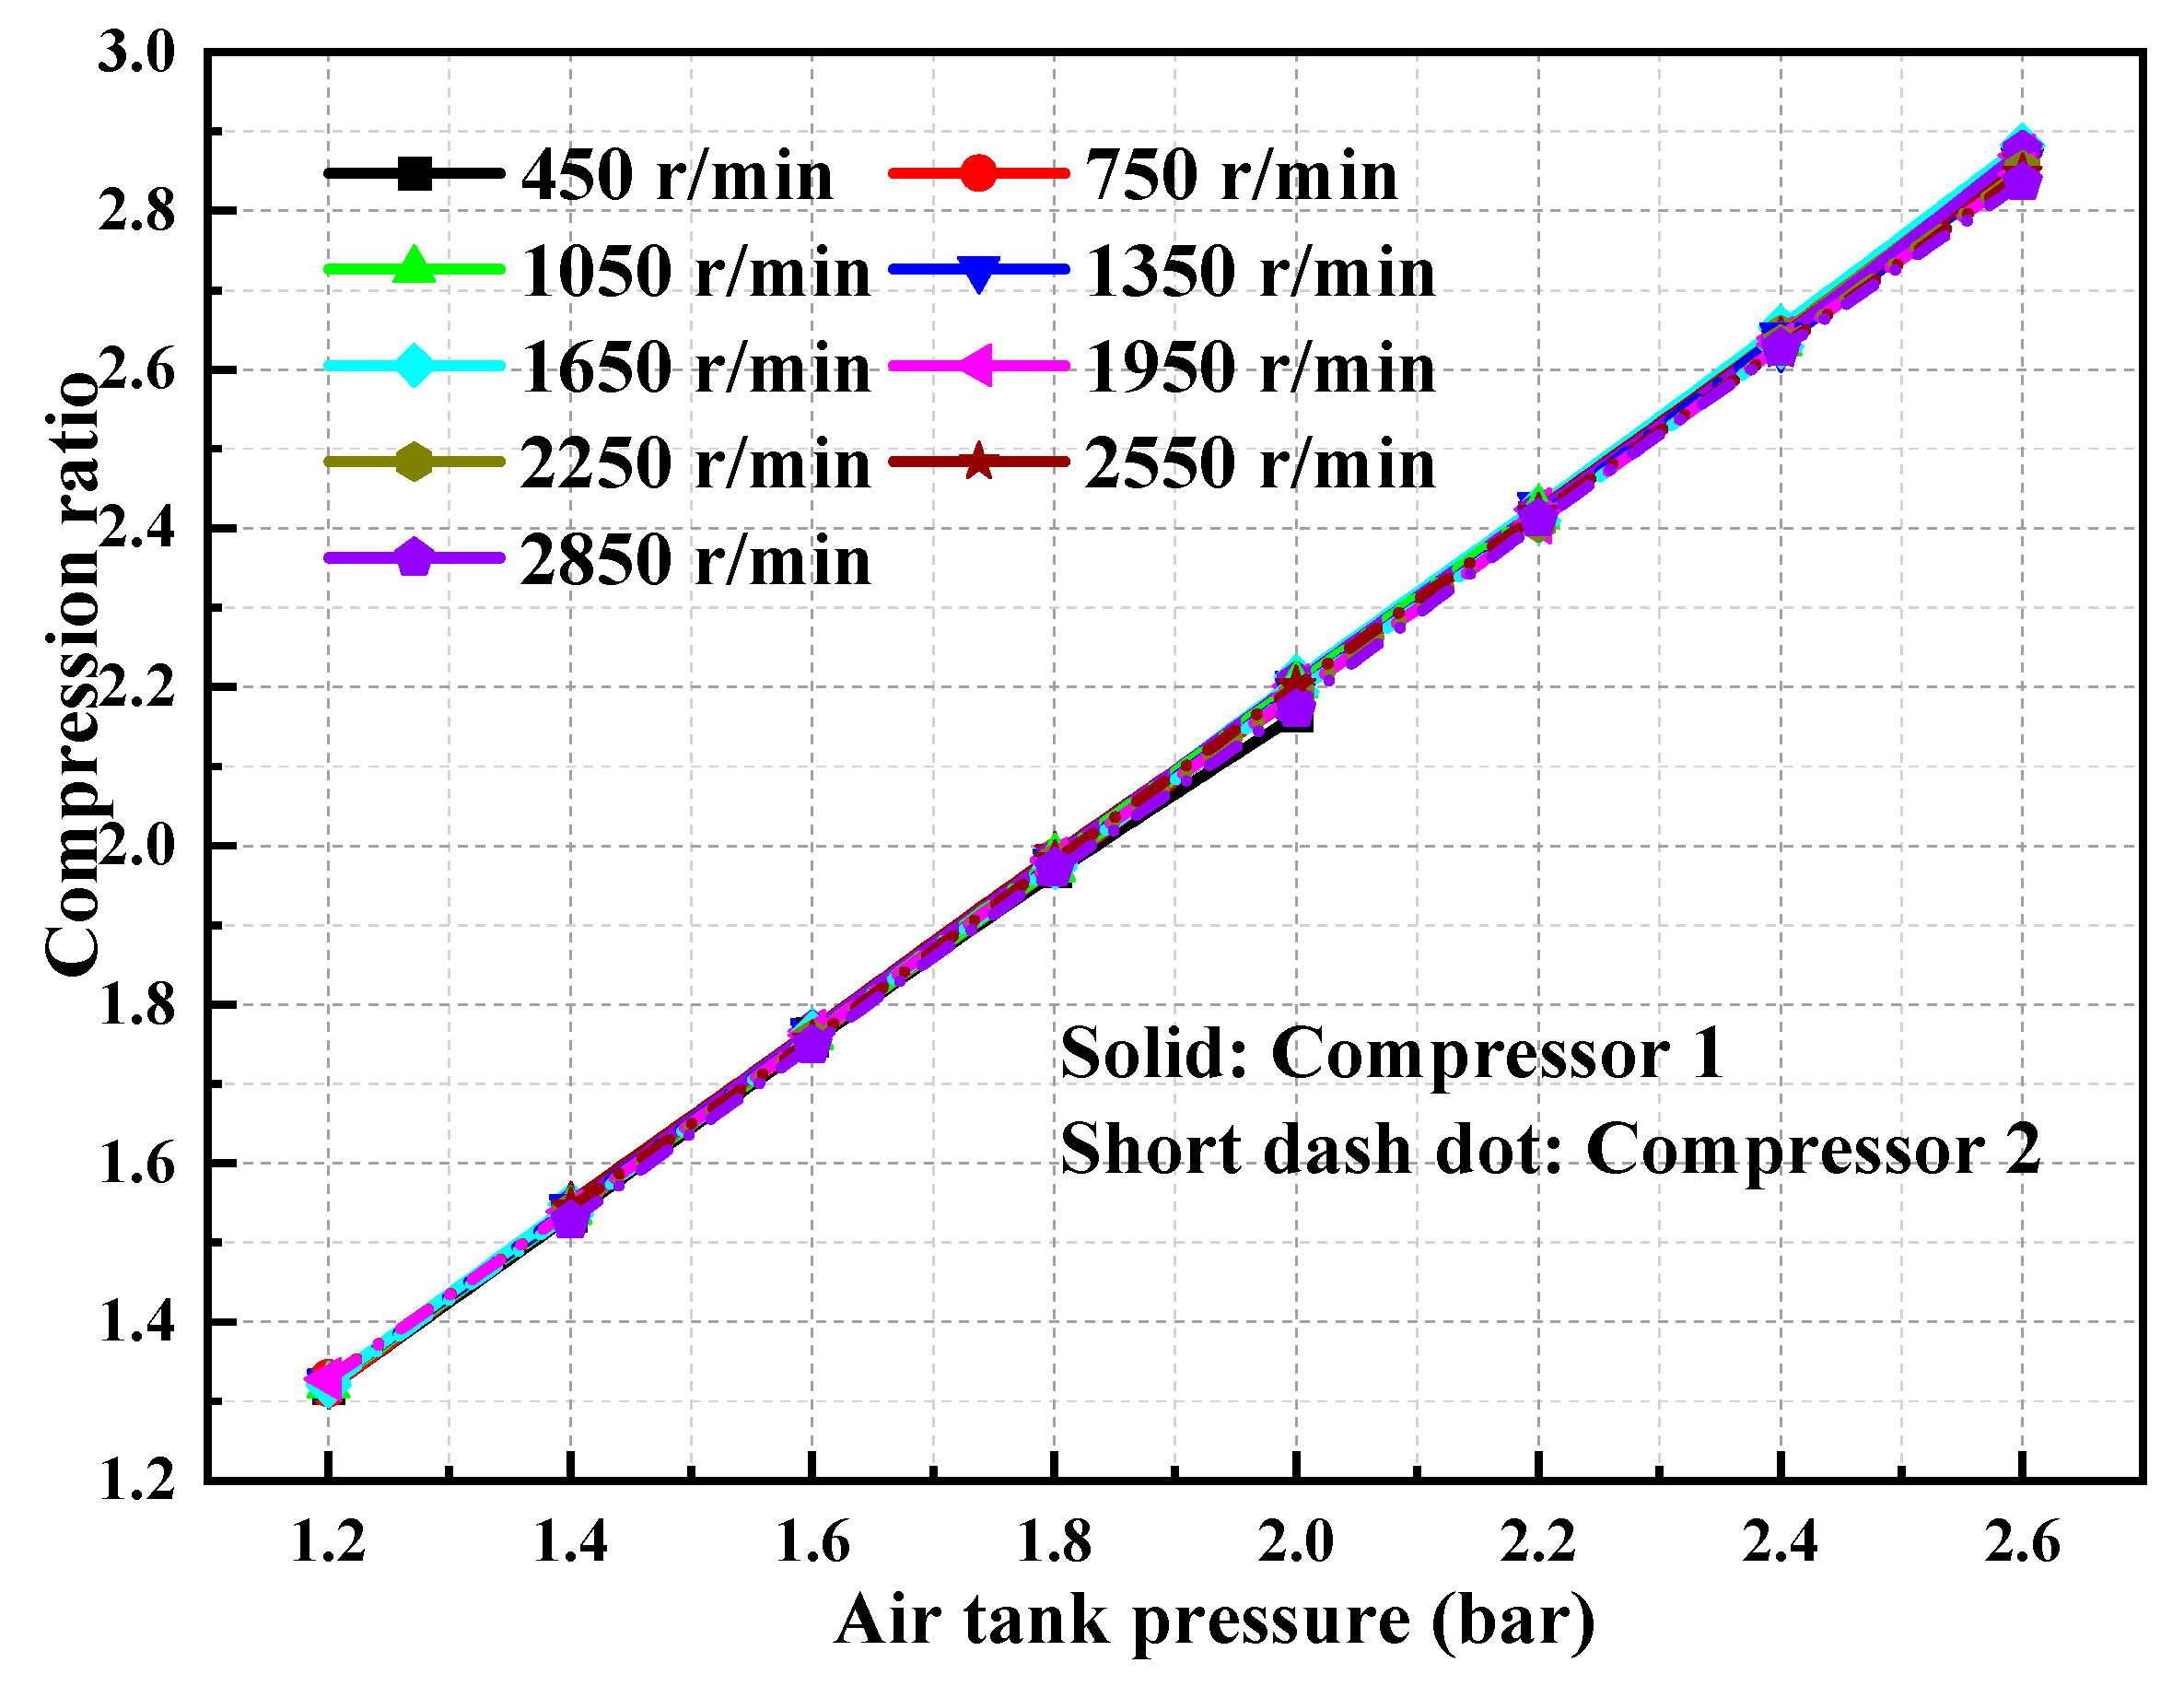
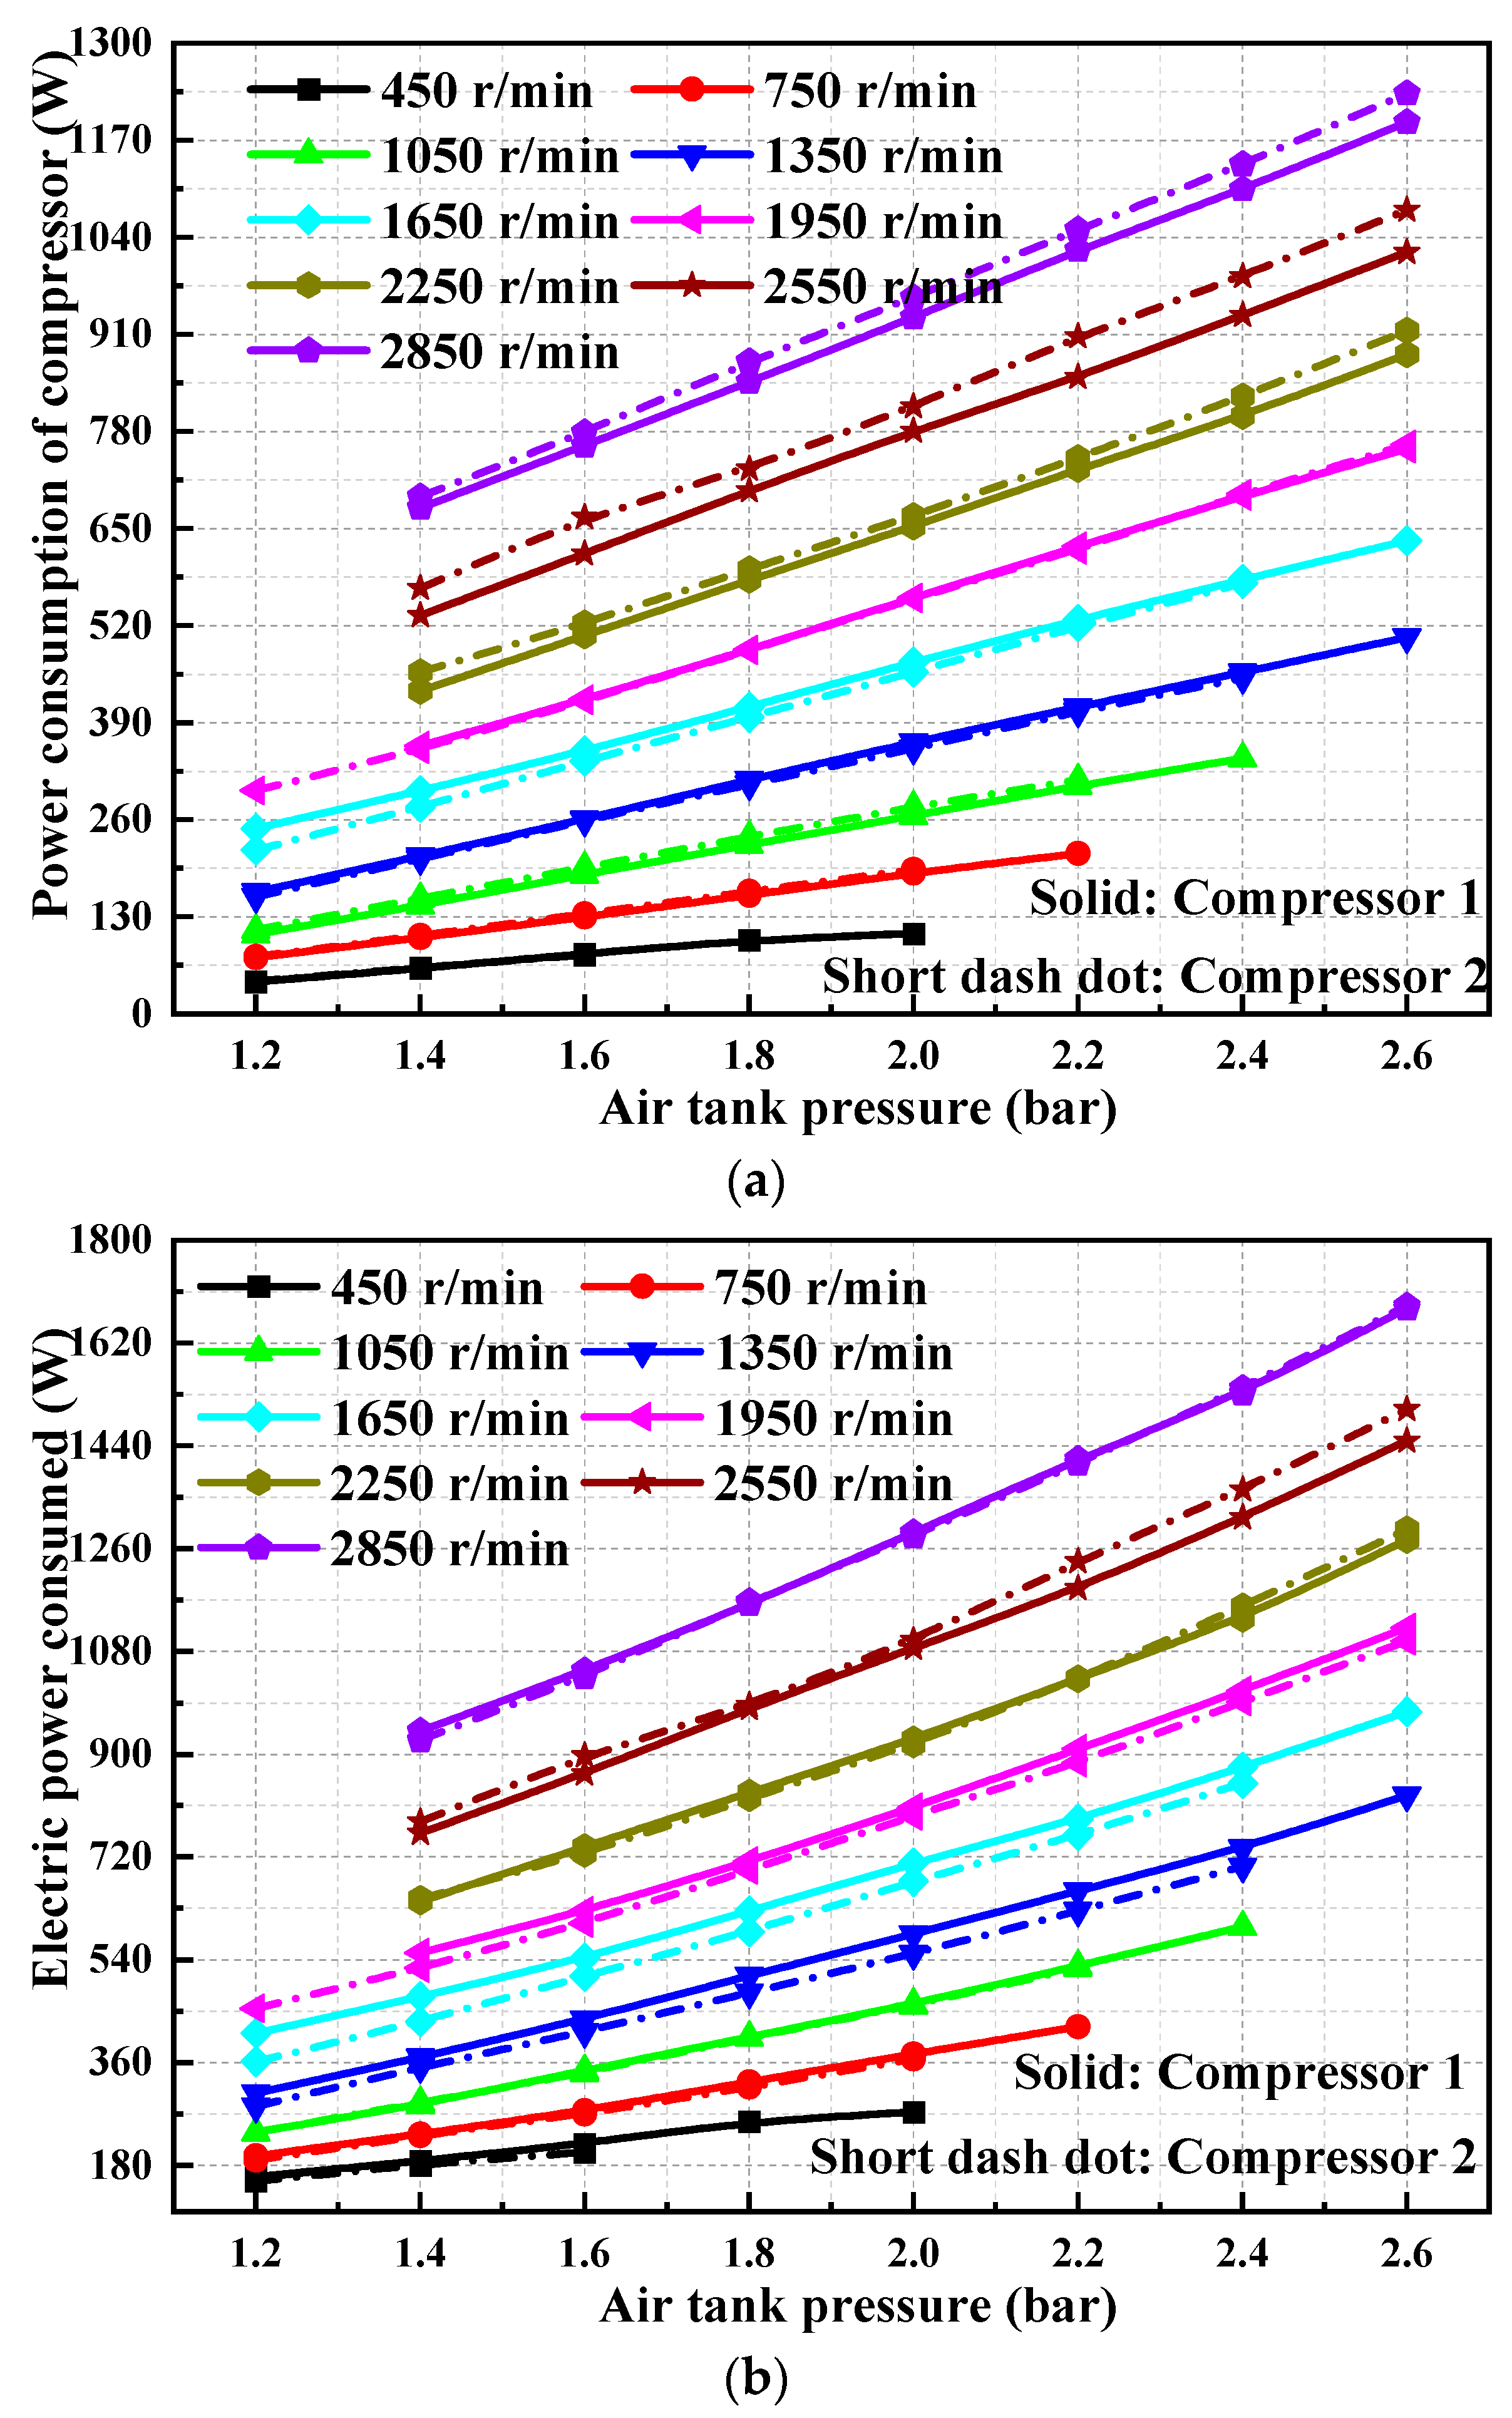
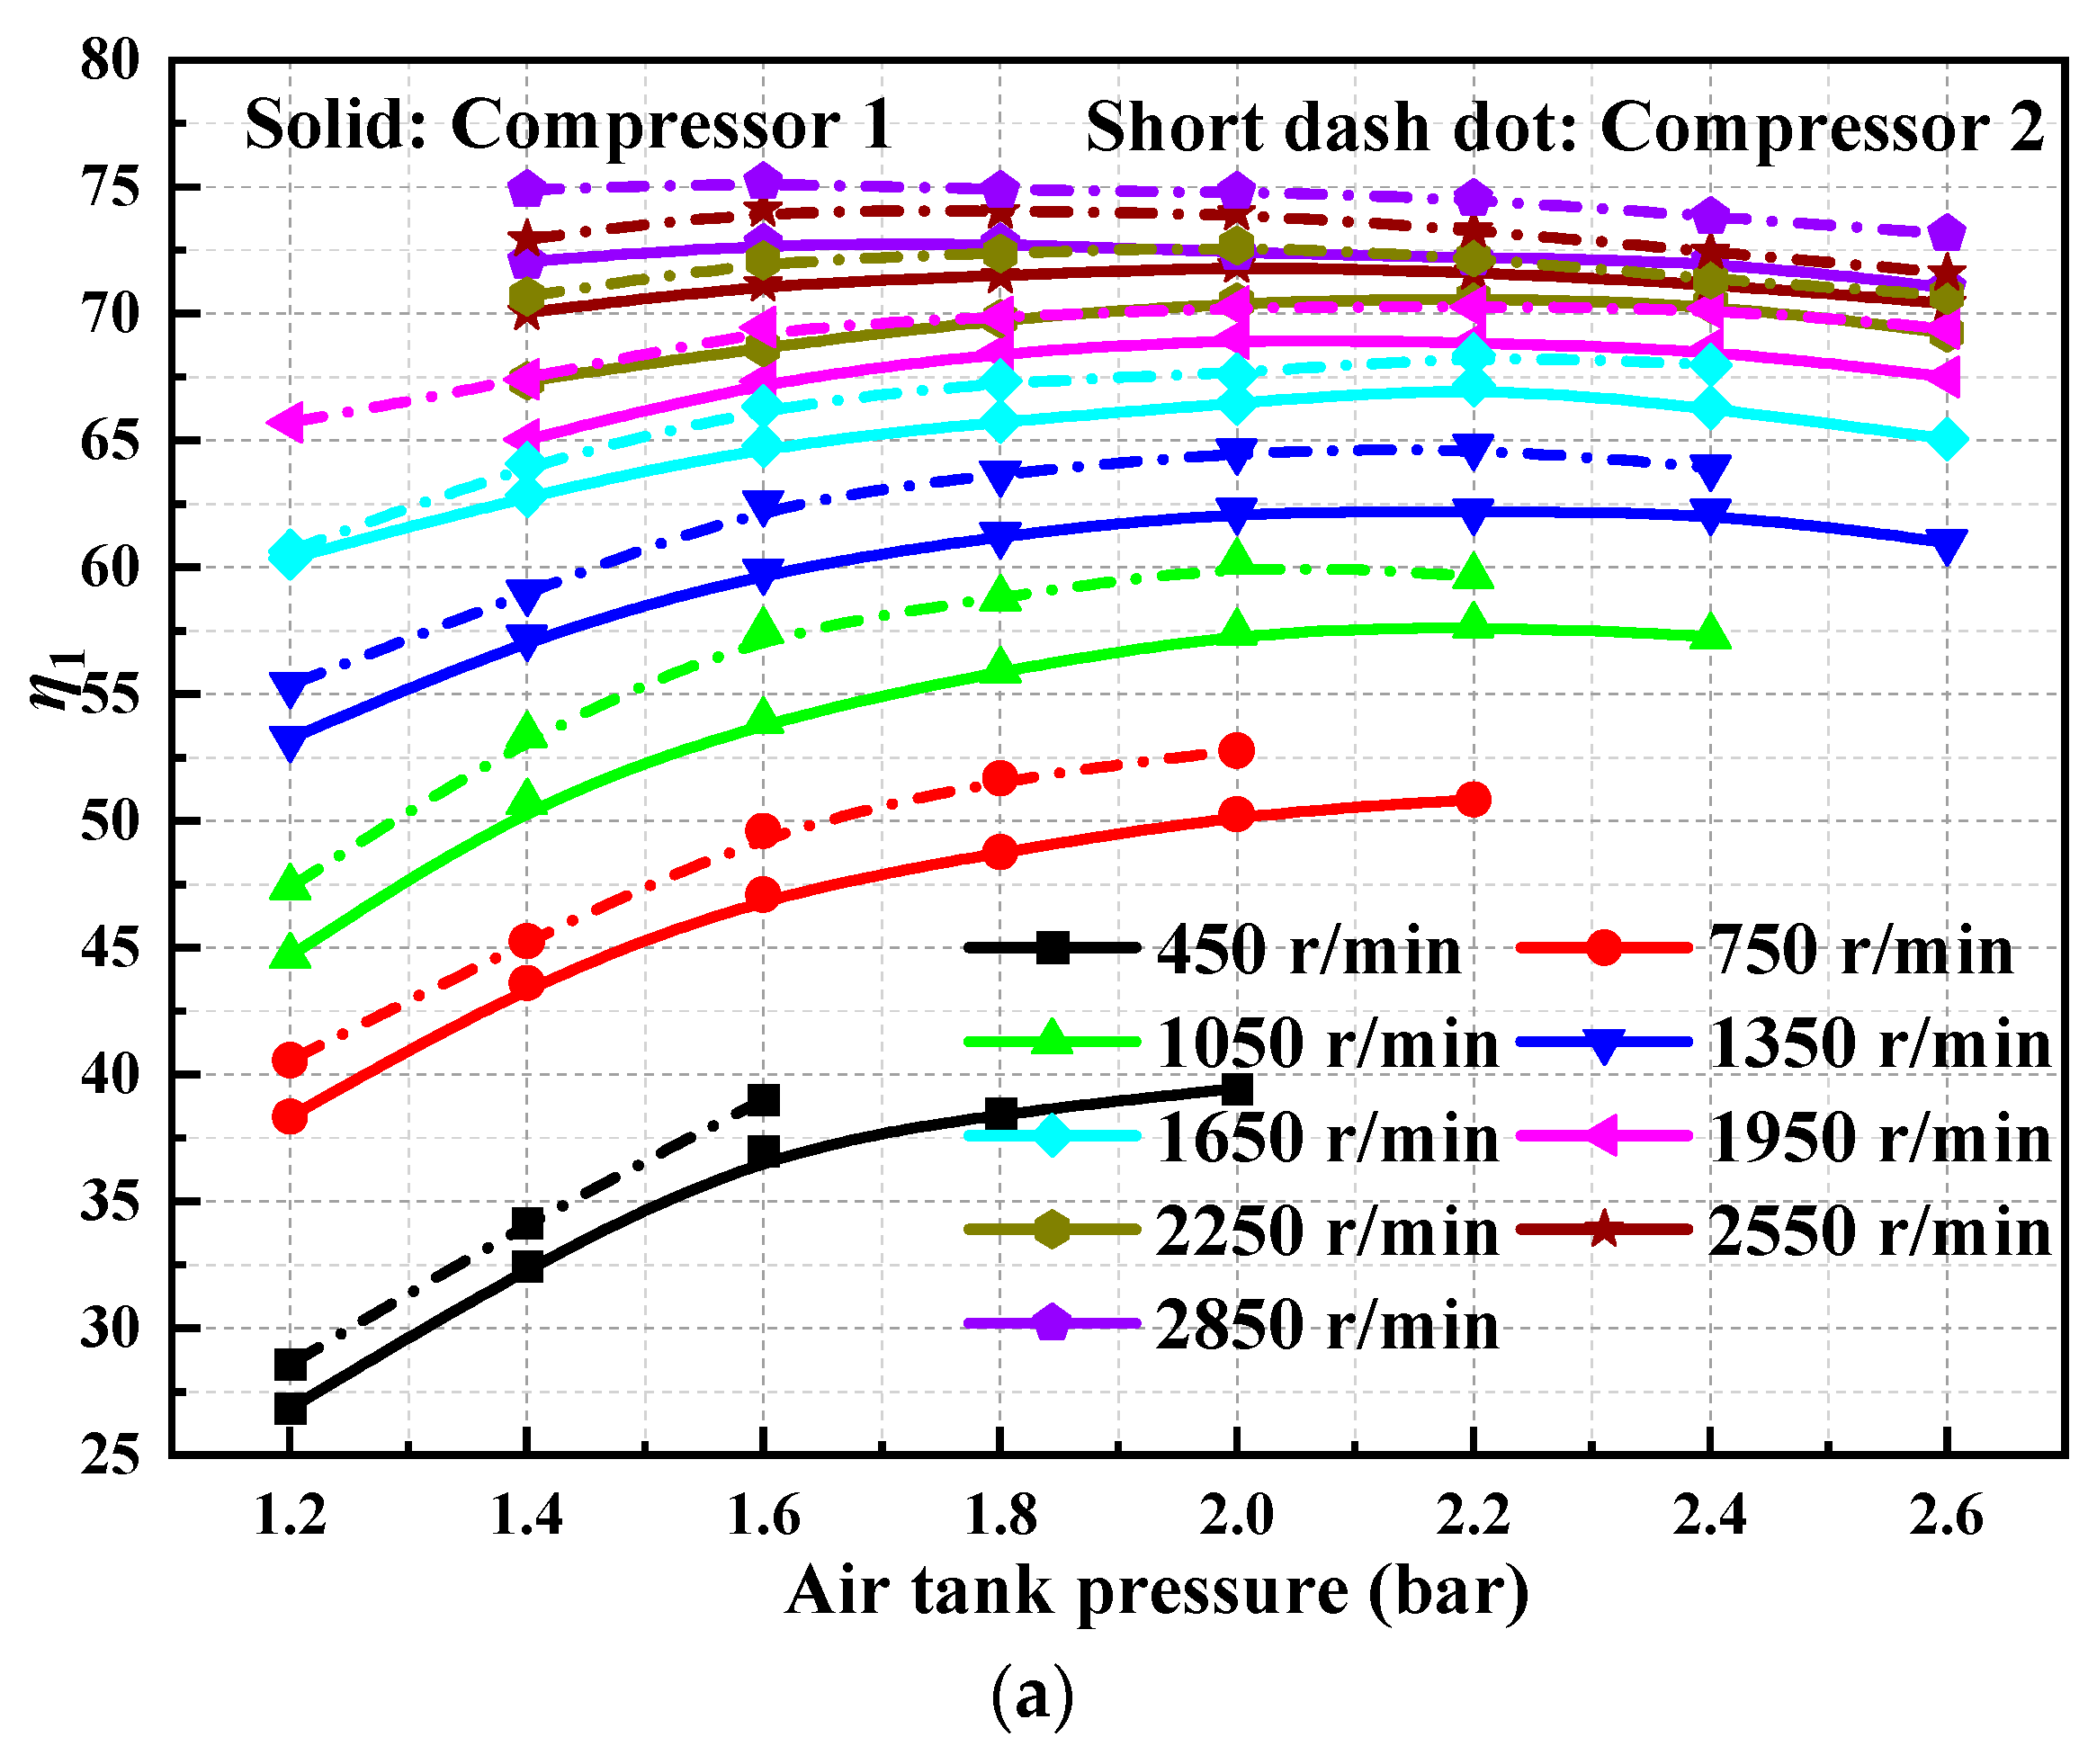
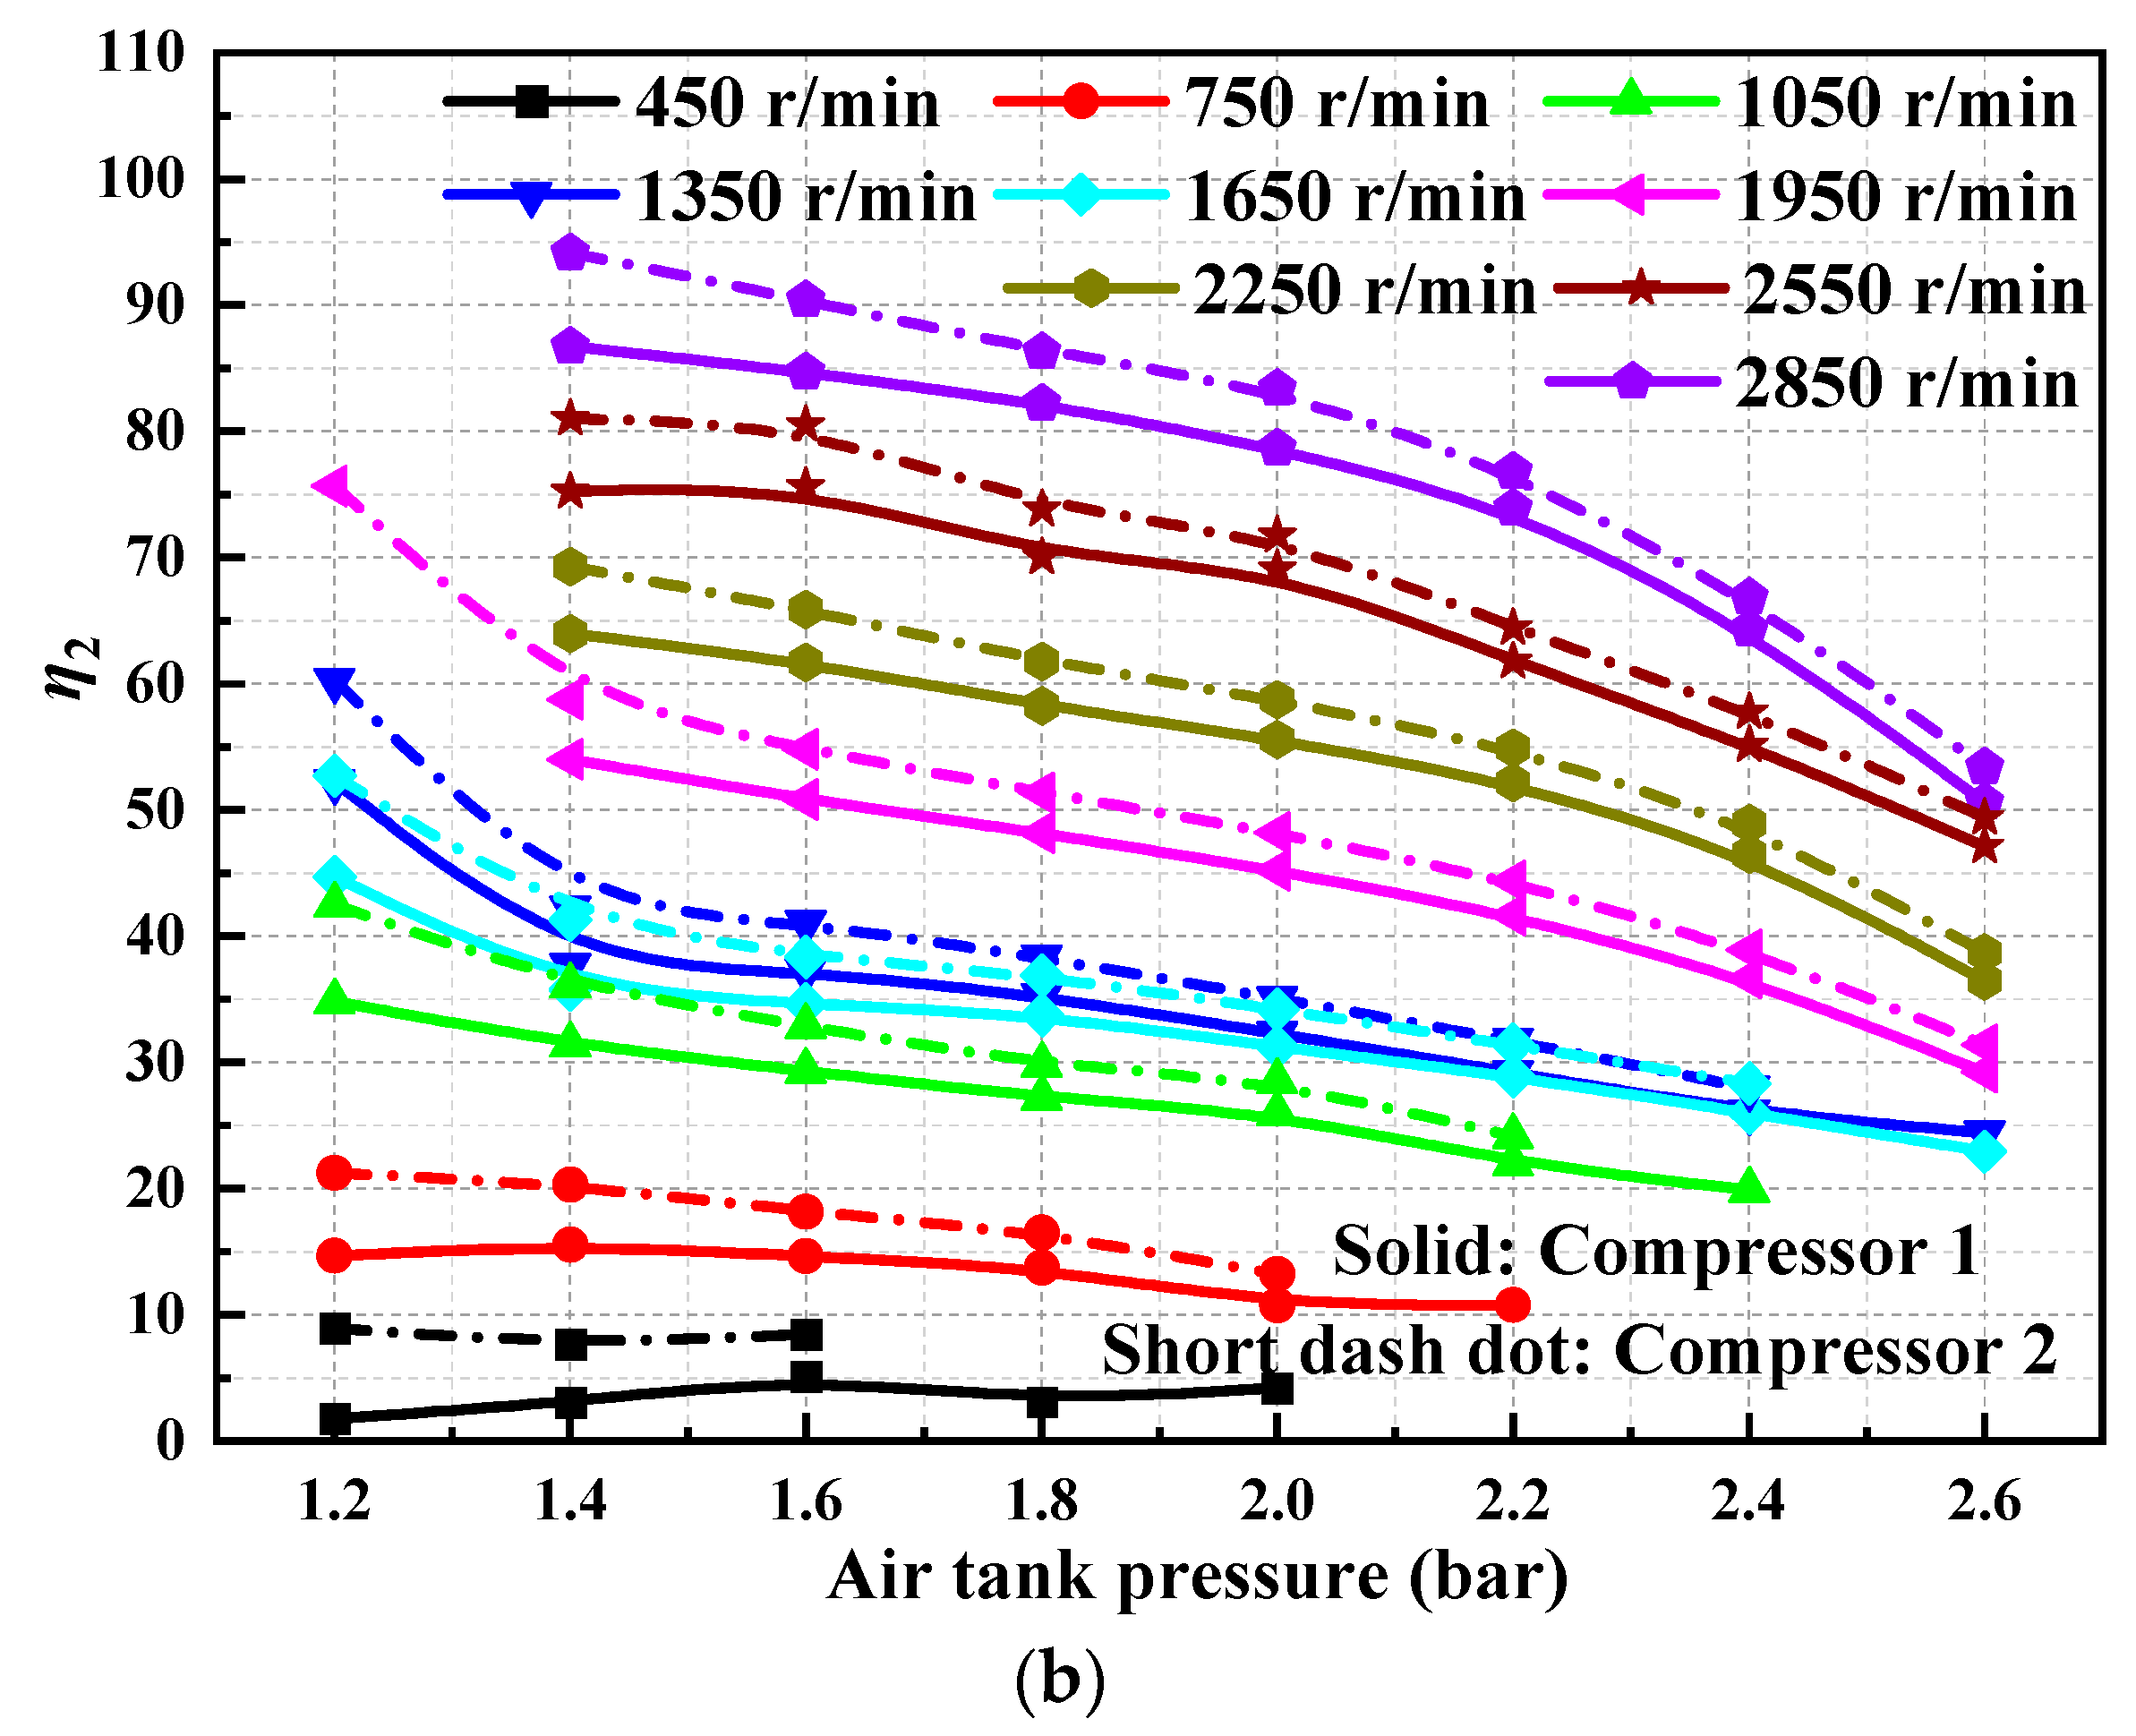
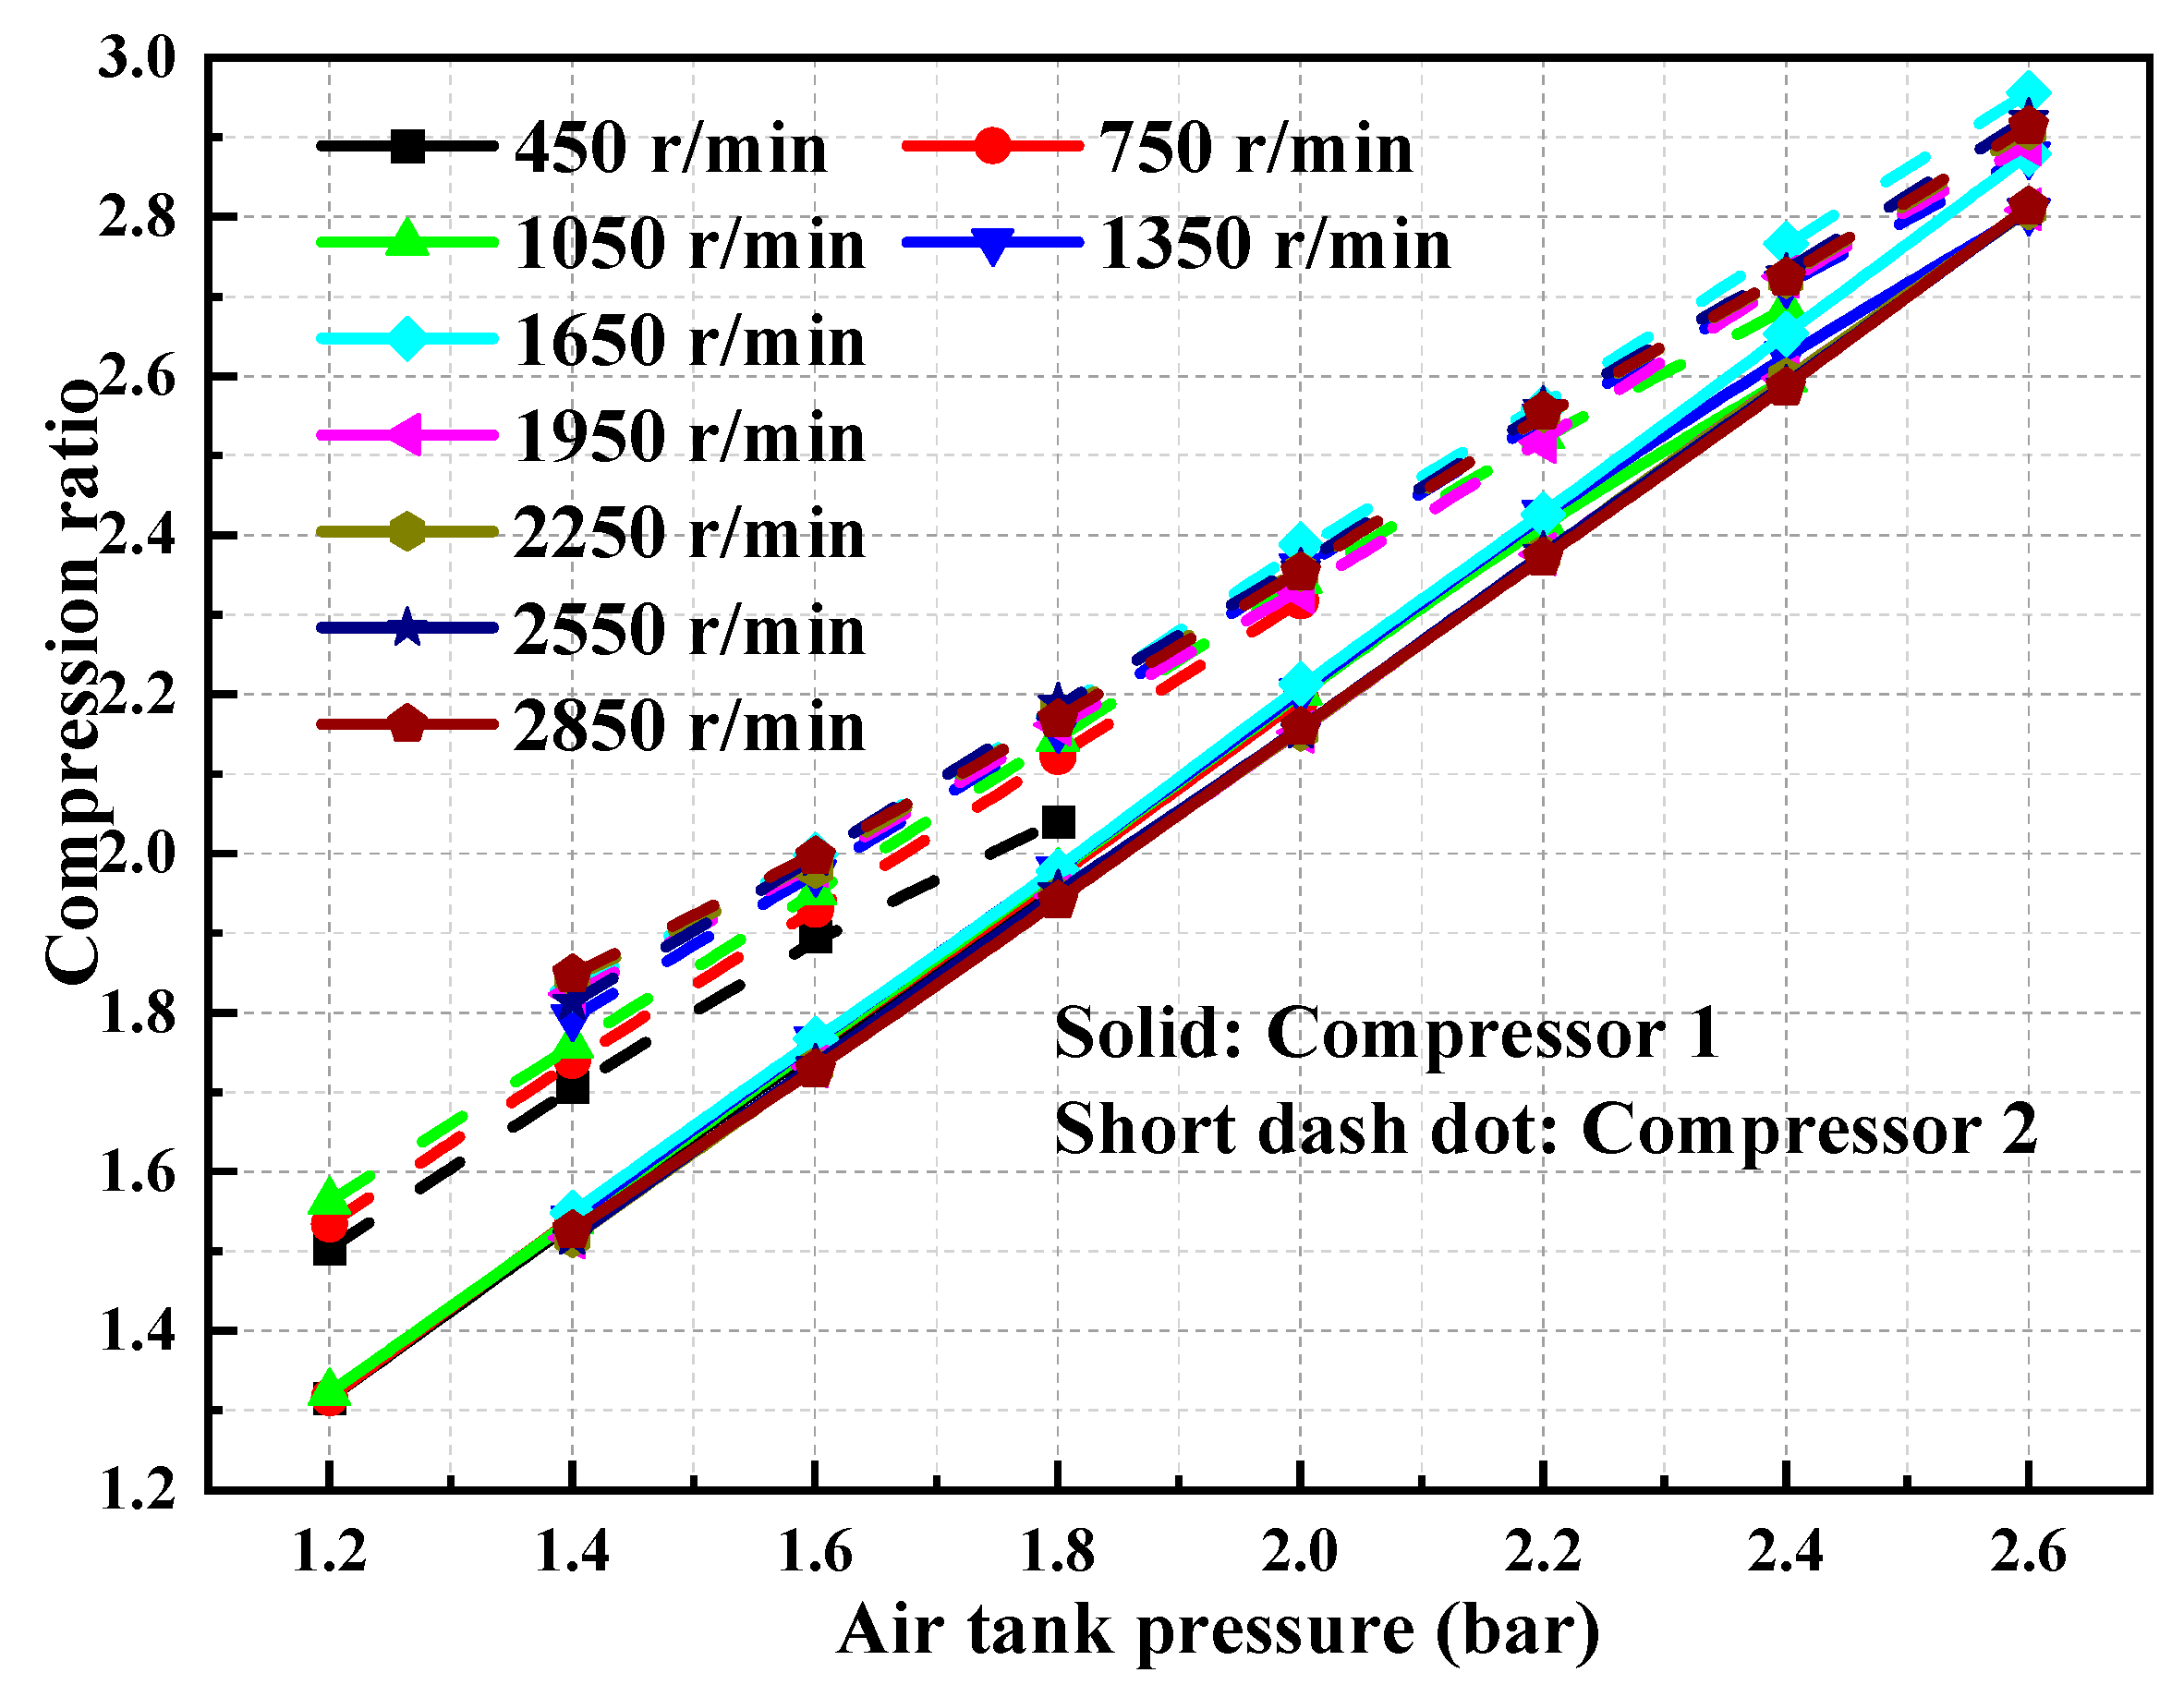
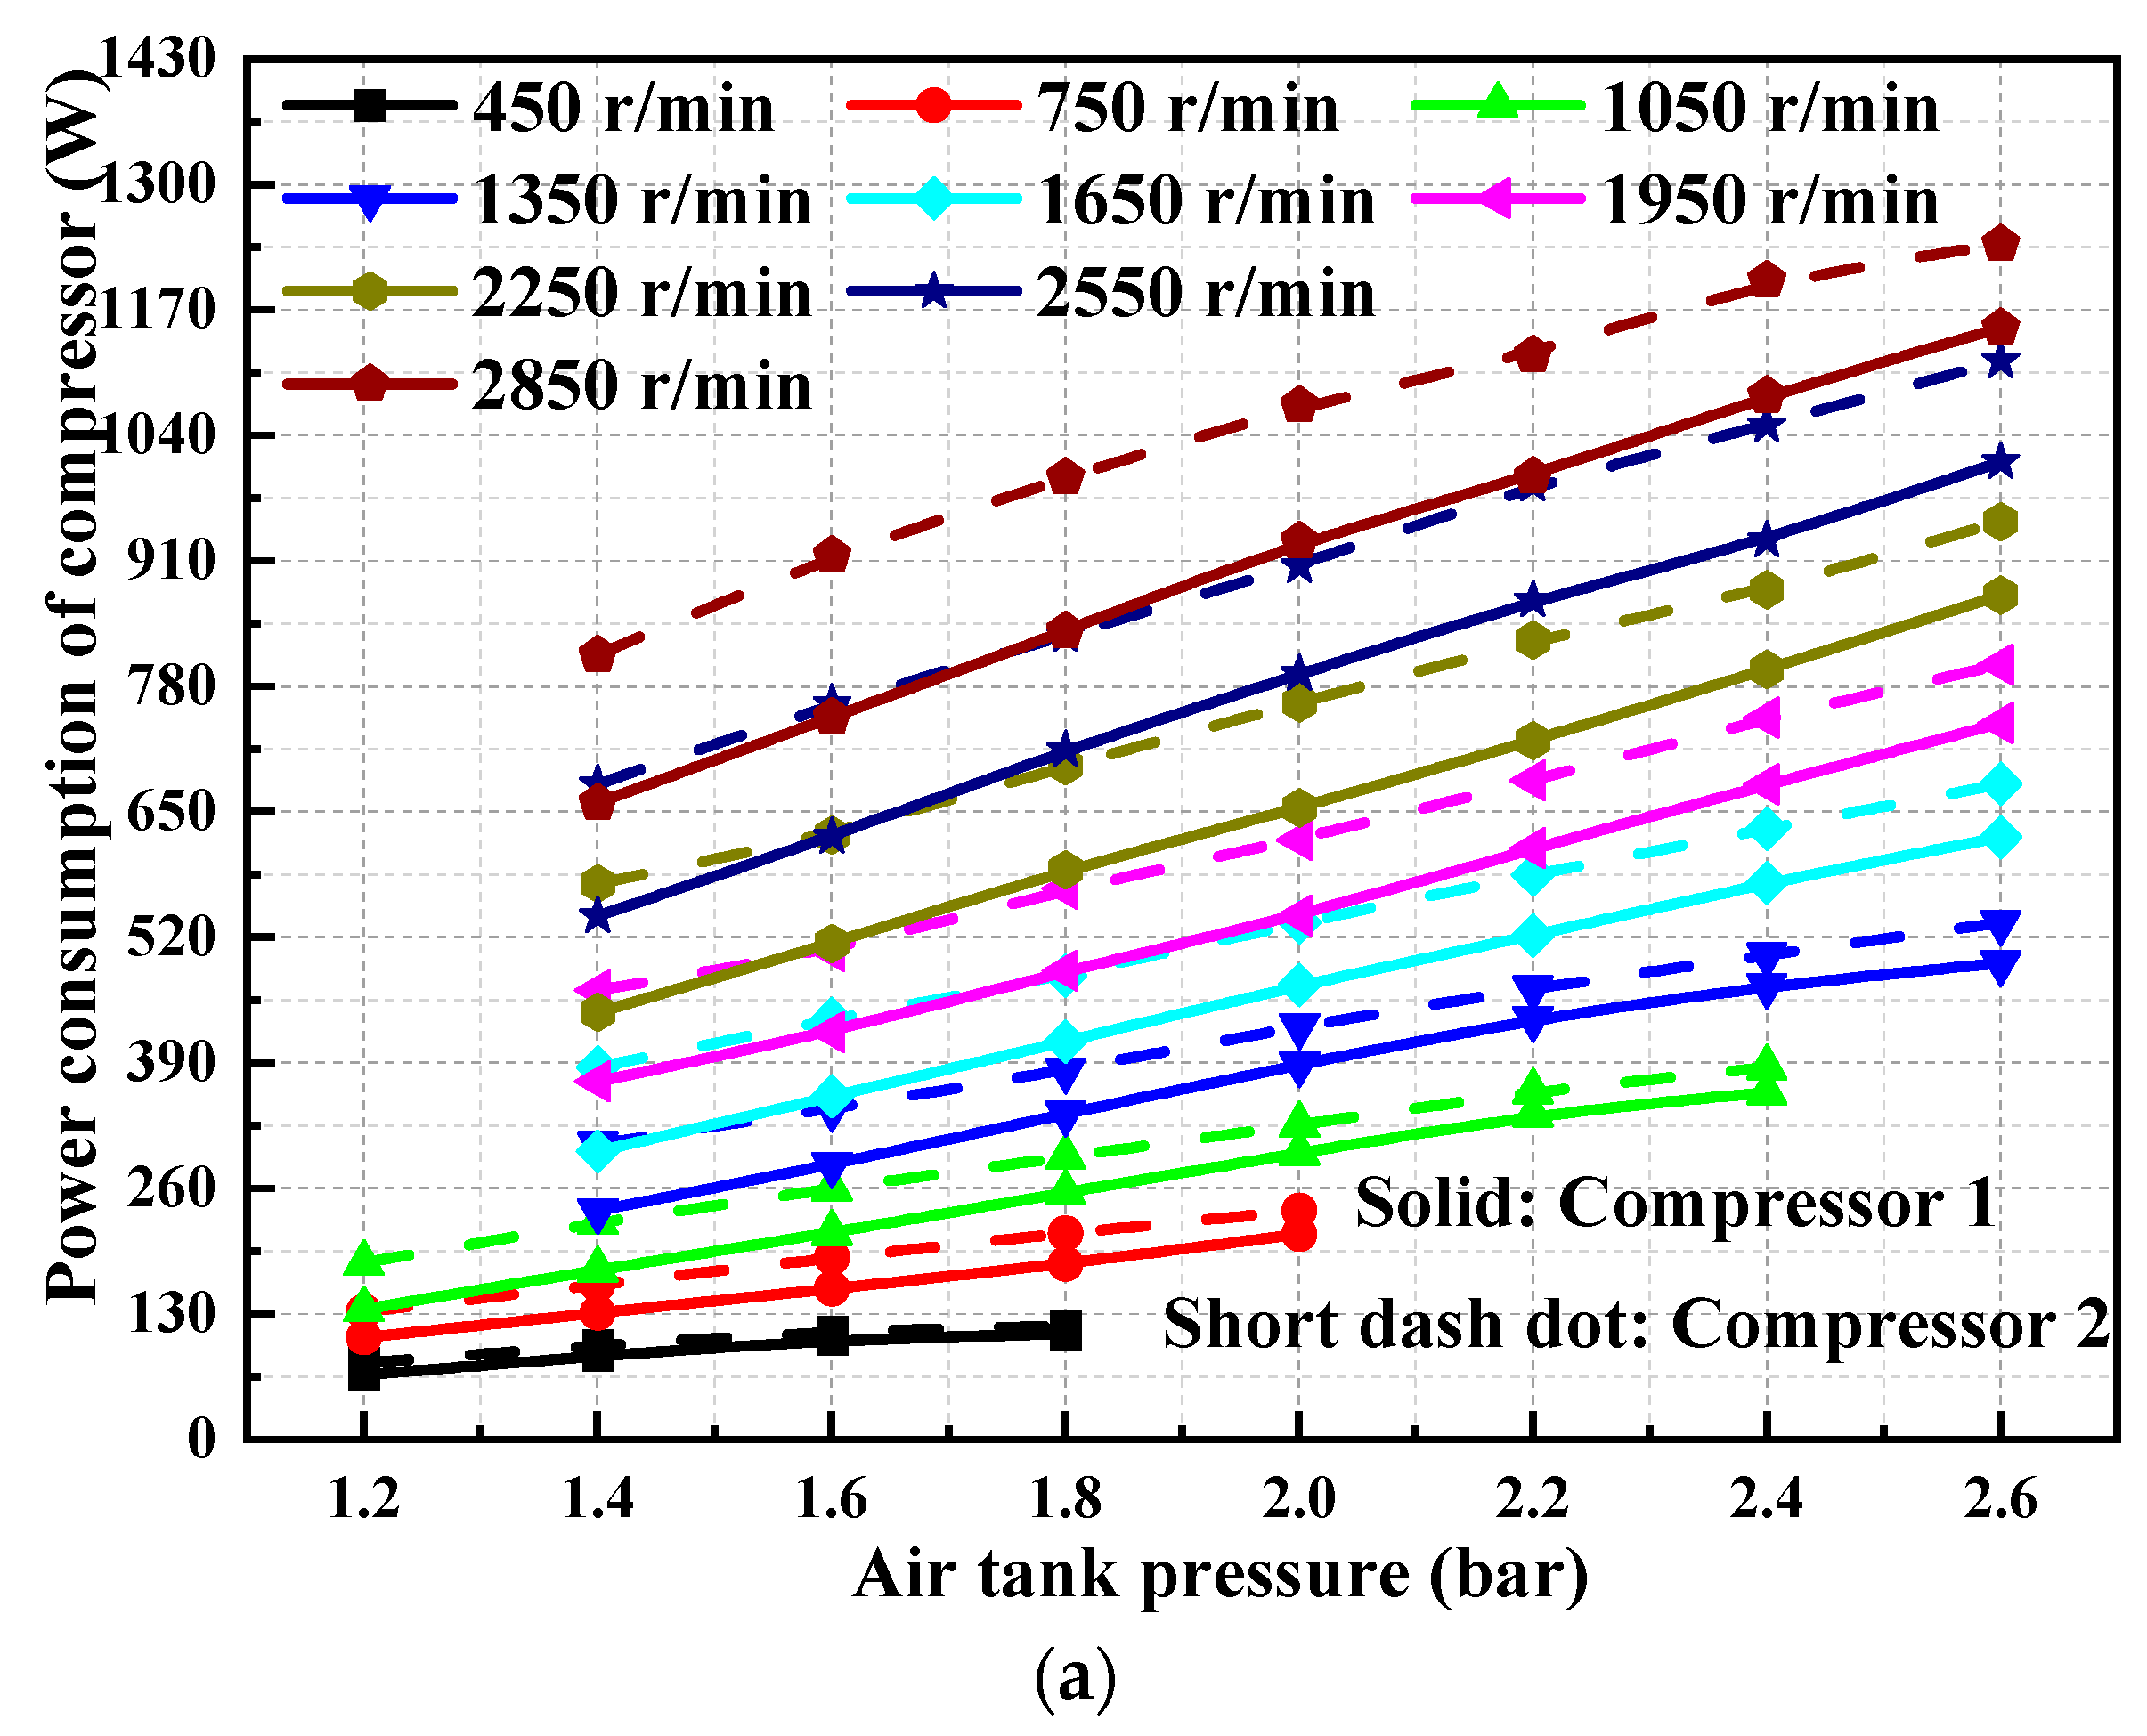
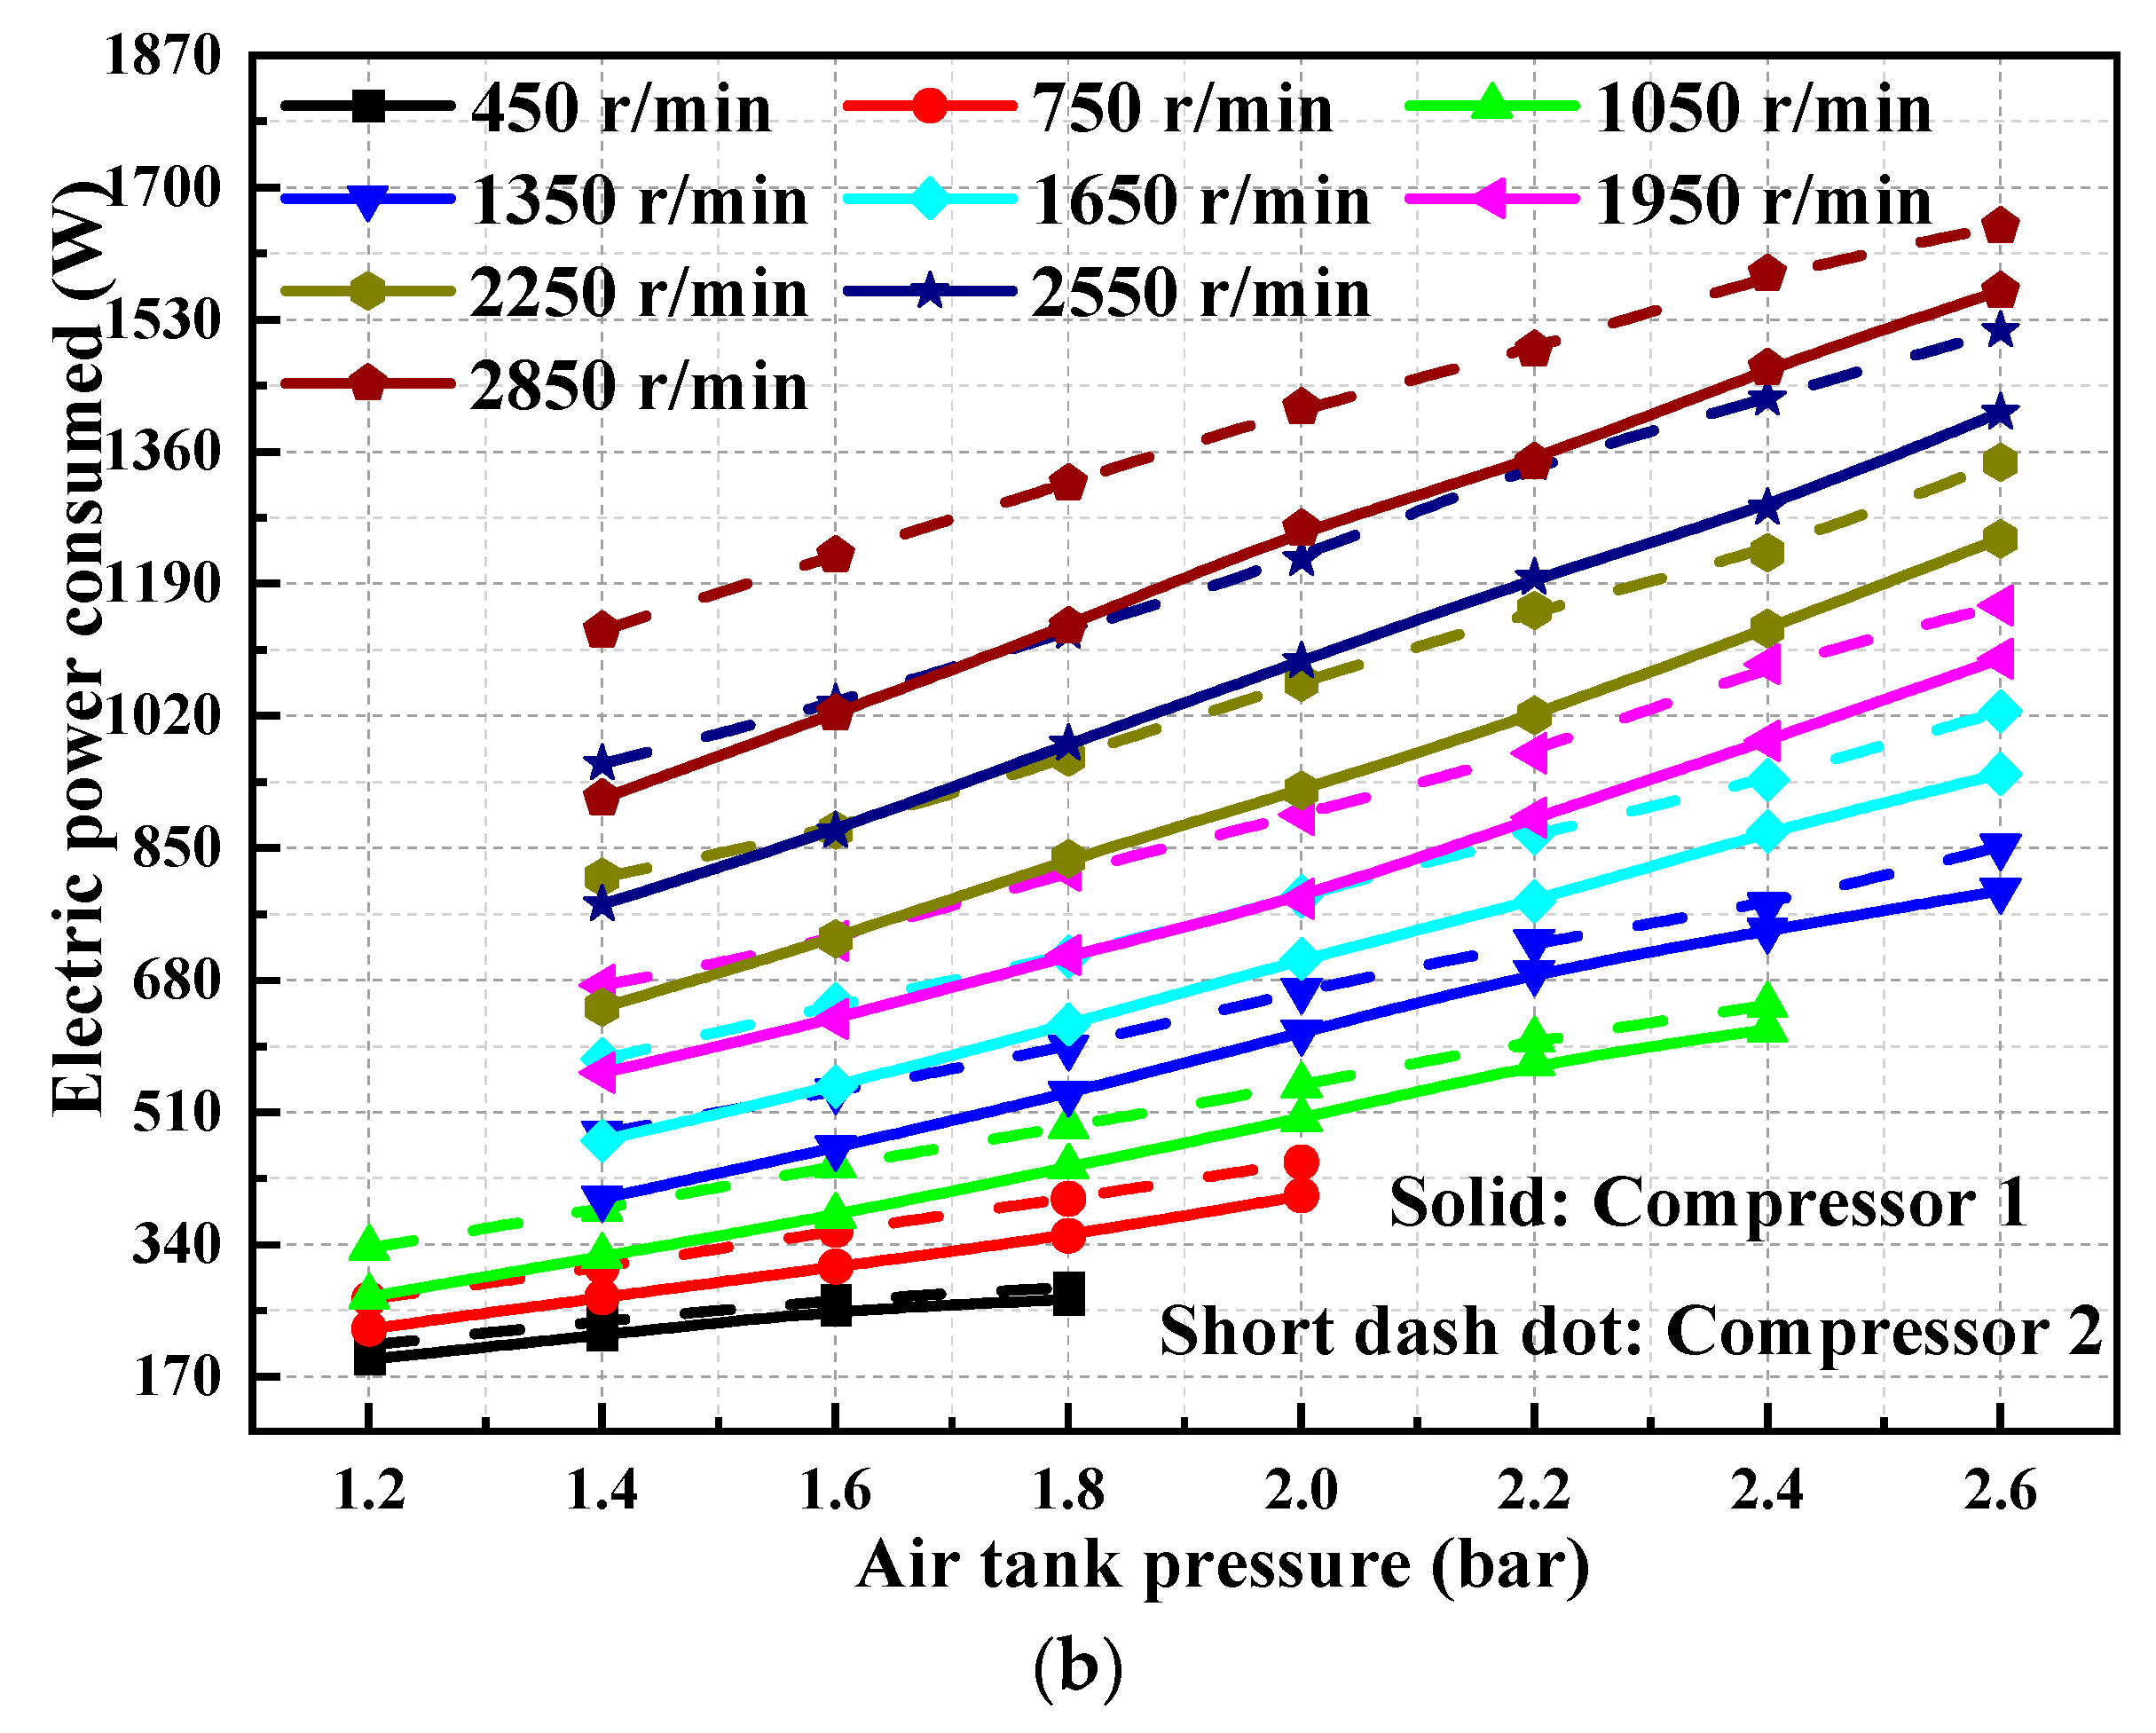
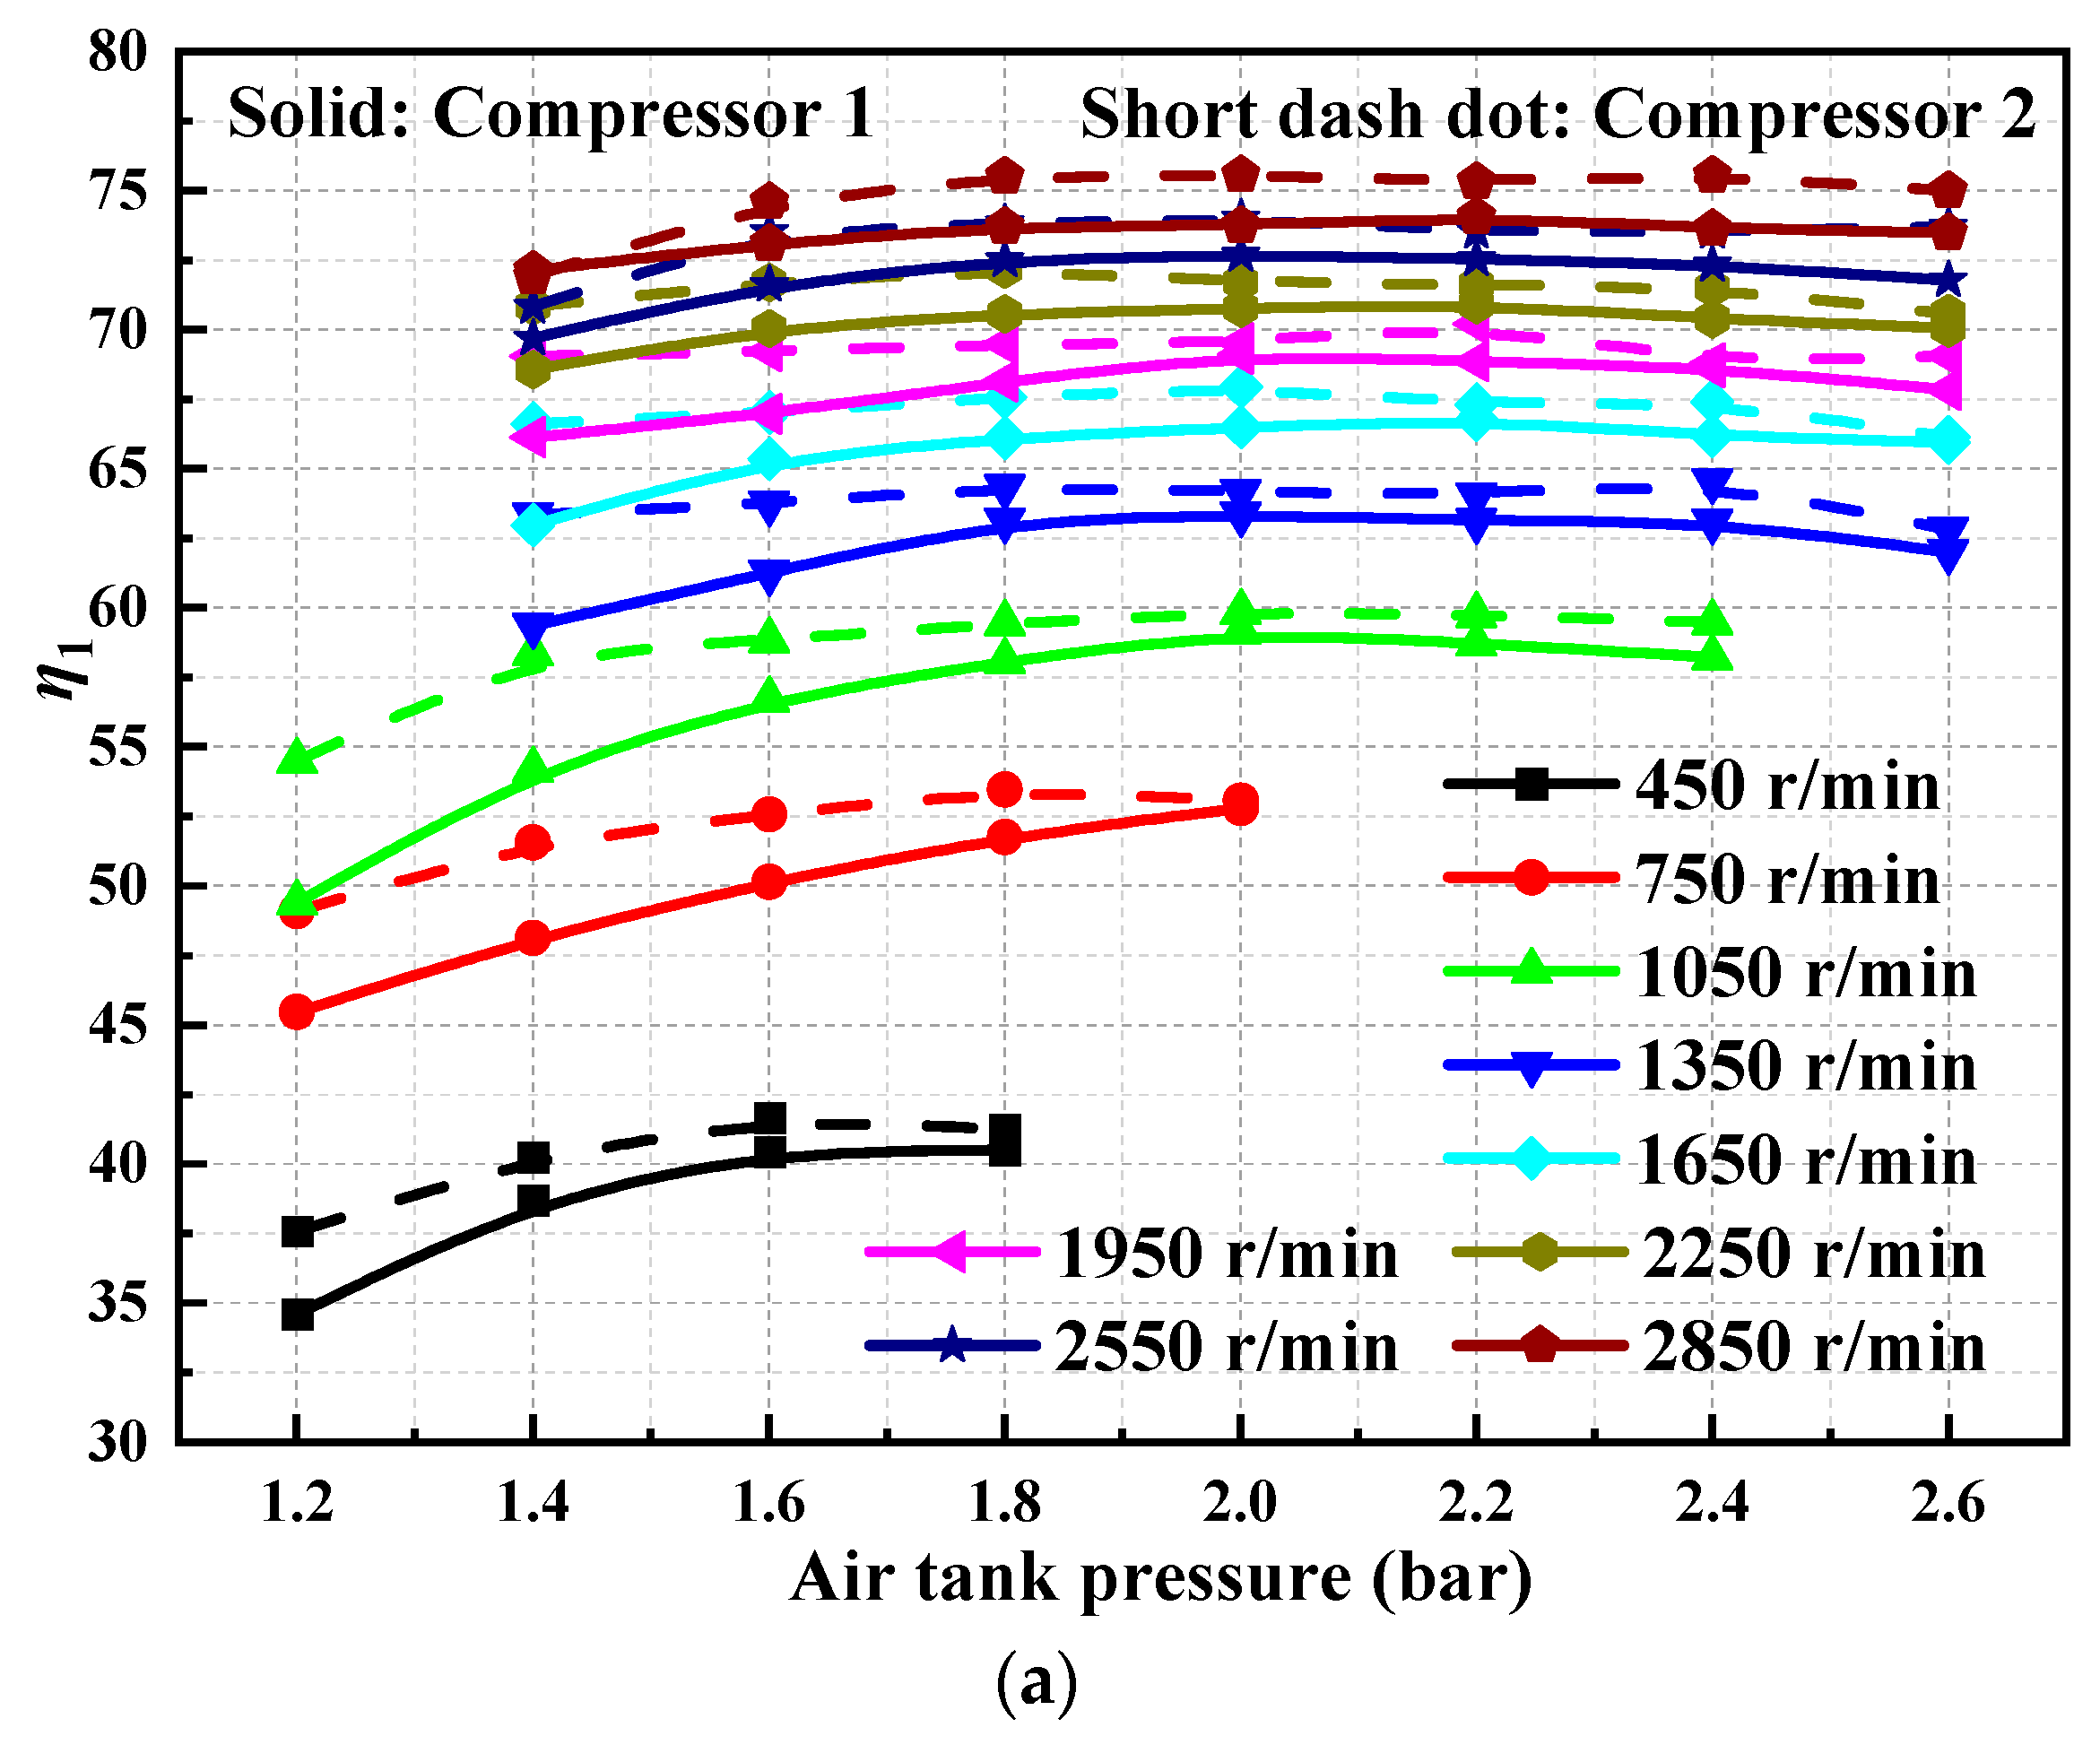
3.1. Influence of Air Tank Pressure on the Performance of the Compressor

Figure 3 displays the torque of the compressor changes with the pressure of the air tank. The torque of the compressor increases linearly with the increasing pressure of the air tank. This is because, with the increase in the pressure of the air tank, the exhaust back pressure of the compressor increases, and the compressor needs greater torque to produce higher-pressure air. When the pressure of the air tank is the same, the torque value of the compressor increases with the increase in the rotational speed. The torque curve of compressors 1 and 2 show the same variation trend with the changing of air tank pressure. Compressors 1 and 2 are two compressors with the same type and the same data acquisition system. The difference between compressors 1 and 2 is due to their different performance. Compressor 1 and compressor 2 are the same compressors in this test bench. It is obvious that higher air tank pressure needs more power to push, so the torque and rotation increase with the tank pressure.
Figure 4 describes the variation of the power battery current consumed by the compressor with the pressure of the air tank. In general, the current increases linearly with the increase in air tank pressure. The amplitude of the current increase rises with the increasing rotational speed. When the rotational speed is 450 r/min and the pressure of the air tank increases from 1.4 bar to 2.0 bar, the current increases from 2.49 A to 3.69 A, and the current increases by 1.2 A. When the rotational speed is 2850 r/min and the pressure of the air tank increases from 1.4 bar to 2.0 bar, the current increases from 12.69 A to 17.72 A, and the current increases by 5.03 A. At the same pressure of the air tank, the current increases with the increase in the rotational speed. The changing trend of the current curve of power battery for compressors 1 and 2 is basically the same. Increasing battery current is not obvious at a low rotation speed and vice versa. The reason is that higher air tank pressure needs more power from the battery pack.
The pressure ratio of the compressor is defined as the ratio of the outtake pressure to the intake pressure. The formula can be written as
ε = p out p in
where ε is the pressure ratio, pout is the outtake pressure, and pin is the intake pressure.
Figure 5 shows the change in the pressure ratio with the pressure of the air tank. The pressure ratio increases linearly with the pressure of the air tank. At different rotational speeds, the pressure ratio curves of compressors 1 and 2 basically coincide at the same air tank pressure. The compression ratio is a fixed value, which could not follow the air tank pressure and motor rotations.
The expression of compressor power consumption is [35]
P c = 2 π × n × T r 60 × 1000
where Pc is the compressor power consumption, n is the rotational speed, and Tr is the torque.
Figure 6a displays the variation of compressor power consumption with the pressure of the air tank. In general, the power consumption of the compressor increases linearly with the increase in air tank pressure. When the pressure of the air tank is the same, the power consumption of the compressor increases with rotational speed. The power consumption of compressors 1 and 2 basically shows the same change trend with the changing of air tank pressure. When the pressure of the air tank increases from 1.4 bar to 2.0 bar and the rotational speed is 450 r/min and 2850 r/min, the power consumption of compressor 1 increases from 60 W to 108.7 W and 677.7 W to 935.6 W, respectively. When the pressure of the air tank is 2.6 bar and the rotational speed is 2850 r/min, the power consumption of compressor 2 reaches the maximum value of approximately 1233.1 W.
The expression of the power output of the power battery is
P b = U × I
where Pb is the power output (W) of the battery, U is the voltage (V), and I is the current (A).
Figure 6b presents the variation of the power output of the power battery with the pressure of the air tank. It can be clearly seen in Figure 6b that the variation trend of the battery output power with the air tank pressure is the same as the variation trend of the power consumption of the compressor. This is because the power battery supplies power to the generator through DC/AC, the generator and compressor are rigidly connected through the coupling, and the generator and compressor have the same rotational speed and torque. When the rotational speed is 2850 r/min and the pressure of the air tank is 2.6 bar, the maximum output power of the power battery is approximately 1685.1 W.
The DC/AC conversion efficiency is the ratio between the power consumption of the compressor and the power output of the battery. The DC/AC conversion efficiency is expressed by the following:
η 1 = P c P b
Figure 7a displays the variation of η1 with the pressure of the air tank. In general, when the rotational speed is low, η1 increases first, then tends to be flat, and finally decreases slightly with the increase in the air tank pressure. When the rotational speed is high, η1 decreases slightly with the increase in the air tank pressure. Under the same pressure as the air tank, η1 increases with the rotational speed. In terms of the overall change trend, η1 of compressor 2 is slightly higher than that of compressor 1, which is caused by the performance difference of the compressor itself. The maximum value of η1 is approximately 75%. DC/AC conversion efficiency is higher as the rotation speed increases. There is no obvious tendency of DC/AC conversion efficiency when air tank pressure is increasing.
η2 is defined as the enthalpy difference between the compressor intake and outtake divided by the isentropic enthalpy value at the compressor outtake minus the enthalpy value at the compressor intake.
η 2 = h 2 h 1 h 2 s h 1
where h2s is the isentropic enthalpy of the compressor at the outtake, (kg/kJ); and h2 and h1 are the enthalpy of the compressor at the outtake and intake, respectively.
Figure 7b displays the variation of η2 with the pressure of the air tank. With the increase in air tank pressure, η2 shows a decreasing trend. With the increase in the air tank pressure, the reduction in efficiency increases. When the pressure of the air tank is the same, η2 increases with the increase in the rotational speed. When the pressure of the air tank increases from 2.2 bar to 2.6 bar and the rotational speed is 2850 r/min and 1650 r/min, η2 decreases from 73.8% to 50.8% and 29.2% to 22.9%, respectively. When the pressure of the air tank is 1.4 bar and the rotational speed is 2850 r/min, η2 of the compressor reaches the maximum value of approximately 95%.

3.2. Influence of Torque on the Performance of the Compressor

Figure 8 displays the variation of the current of the power battery with torque. The current increases linearly with the increase in torque. When the torque is the same, the current increases with the rotational speed. When the torque is the same, the power consumption of the compressor is proportional to the rotational speed. The compressor and generator have the same power, and the power of the generator is provided by the power battery. The current corresponding to compressor 2 is greater than that corresponding to compressor 1 under different rotational speeds and torques.
Figure 9 shows the variation of pressure ratio with torque. The pressure ratio increases with the torque. When the torque value is the same, the pressure ratio shows a decreasing trend with the increase in the rotational speed. The variation curves of the pressure ratio with torque for compressors 1 and 2 coincide. Working at the same compression ratio, selecting a higher rotation speed means higher torque.
Figure 10a displays the variation of compressor power consumption with torque. The power consumption of the compressor increases linearly with the increase in torque and rotational speed. The power consumption curves of compression 1 and 2 coincide with the variation curve of torque. The power consumption of the compressor has great potential at a high rotation speed. On the contrary, a higher rotation speed requires more torque than a lower speed. When the compressor works at the variable rotation speed, the range is very important for compressor power and torque.
Figure 10b shows the variation of the battery power output with torque. With the increase in torque and rotational speed, the battery output power shows an increasing trend. Under different torques and rotational speeds, the battery output power corresponding to compressor 2 is greater than that corresponding to compressor 1.
Figure 11a displays the variation of η1 with torque. With the increase in torque, η1 first increases, then tends to be flat, and finally shows a slight decrease. In addition, η1 tends to increase with the increase in rotational speed. The η1 of compressor 2 is higher than that of compressor 1 under different torques and rotational speeds.
Figure 11b shows the variation of η2 with torque. It can be seen that η2 decreases with the increase of in torque value but increases with the rotational speed. Under different rotational speeds and torques, η2 of compressor 2 is greater than that of compressor 1.

3.3. Influence of Mass Flow Rate on the Performance of the Compressor

Figure 12 describes the variation of torque with mass flow rate. With the increase in mass flow rate, the torque first shows a linear increasing trend, then tends to be flat, and finally shows an increasing trend again. At the same mass flow rate, the torque increases with rotational speed. At different rotational speeds and mass flows rates, the torque value corresponding to compressor 2 is greater than that corresponding to compressor 1.
Figure 13 displays the variation of current with mass flow rate. The current increases with the increase in mass flow rate. At different rotational speeds and mass flow rates, the current value corresponding to compressor 2 is greater than that corresponding to compressor 1.
Figure 14 presents the variation of pressure ratio with mass flow rate. With the increase in mass flow rate, the pressure ratio first presents a linear increasing trend, then tends to be flat, and finally presents an increasing trend again. At different rotational speeds and mass flow rates, the pressure ratio corresponding to compressor 2 is greater than that corresponding to compressor 1. The mass flow rate clearly increases with the compression ratio at the same rotation speed.
Figure 15a displays the variation of compressor power consumption with mass flow rate. With the increase in mass flow rate, the power consumption of the compressor first presents a linear increasing trend, then tends to be flat, and finally shows an increasing trend again. The power consumption of the compressor increases with the increase in rotational speed. At different rotational speeds and mass flow rates, the power consumption of compressor 2 is greater than that of compressor 1.
Figure 15b displays the variation of the battery power output with the mass flow rate. With the increase in mass flow rate, the battery power output first presents a linear increasing trend, then tends to be flat, and finally displays an increasing trend again. The battery power output increases with the increase in rotational speed. At different rotational speeds and mass flow rates, the battery power output corresponding to compressor 2 is greater than that corresponding to compressor 1. Figure 15a multiplies DC/AC conversion efficiency equal to Figure 15b.
Figure 16a describes the variation of η1 with mass flow rate. With the increase in mass flow rate, η1 first shows a linear increasing trend and then tends to be flat. Also, η1 increases with the increase in rotational speed. The η1 of the compressor 2 is higher than that of compressor 1 under different mass flow rates and speeds.
Figure 16b presents the variation of η2 with mass flow rate. η2 decreases with the increase in mass flow rate but tends to increase with the increase in rotational speed. When the rotational speed is less than 2550 r/min, η2 of compressor 2 is greater than that of compressor 1.

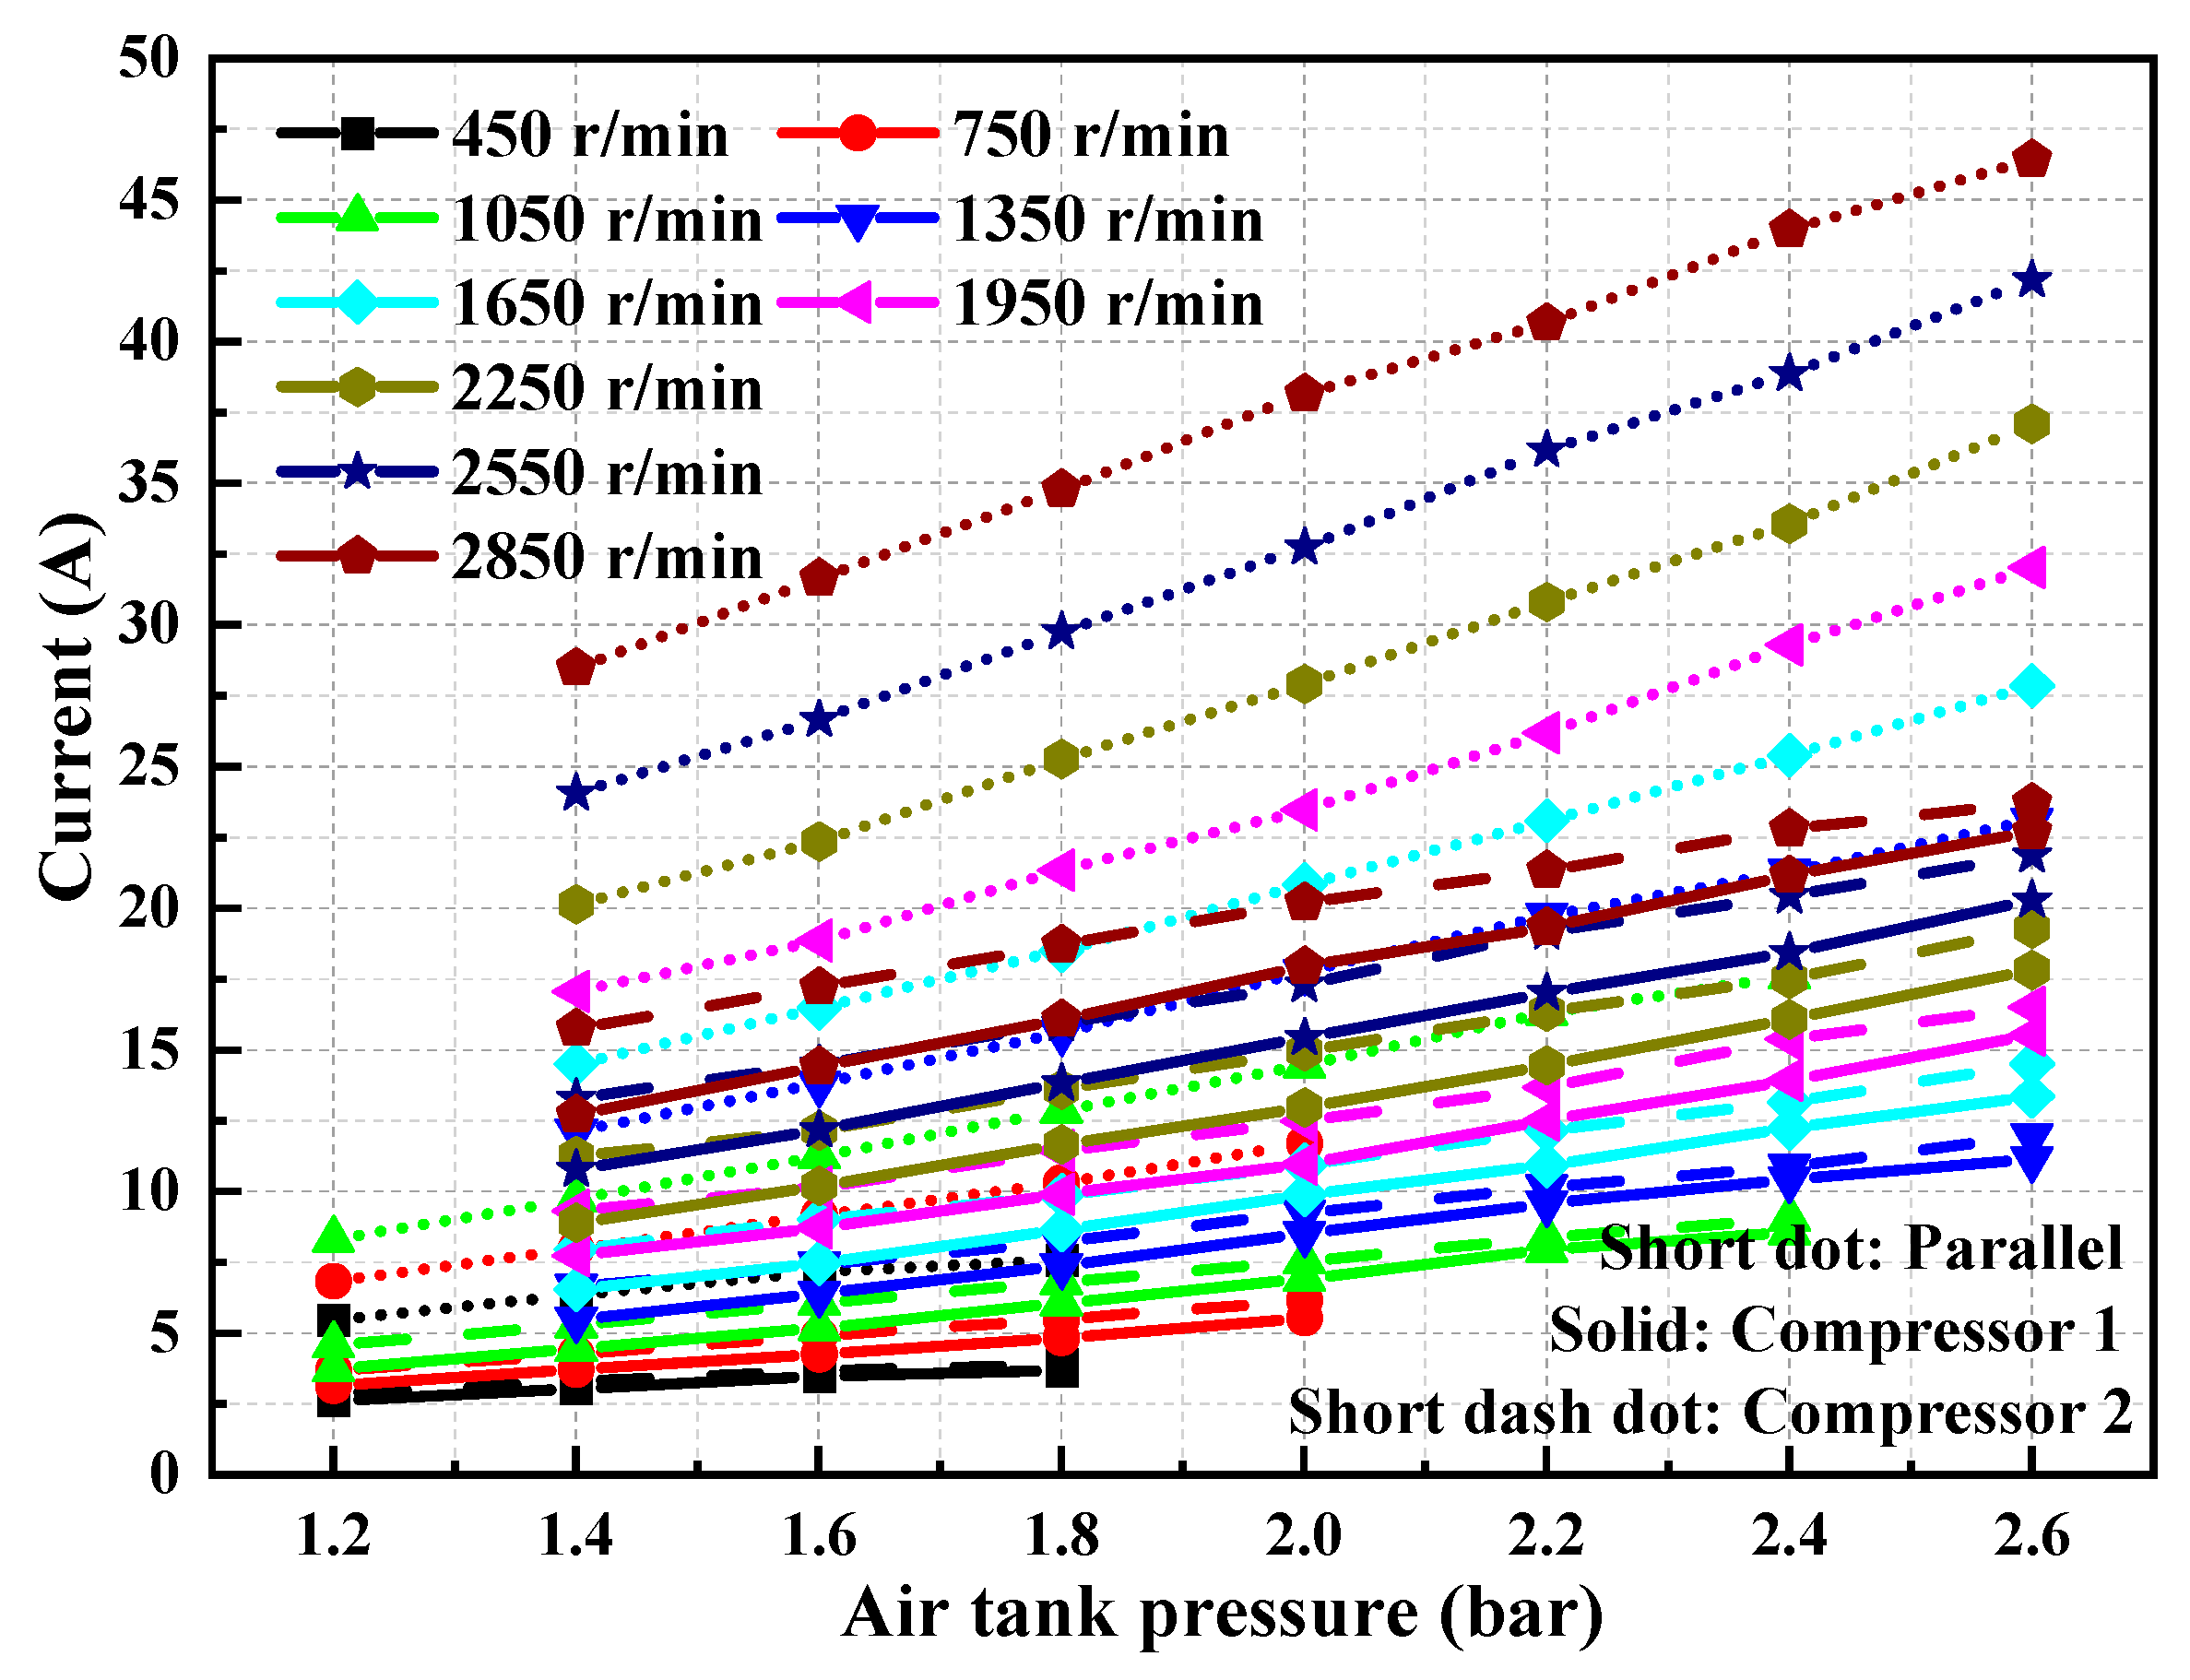
3.4. Influence of Air Tank Pressure on the Performance of the Compressor in Parallel Mode

In Figure 17, solid and dash-dot lines show the variation of torque with the air tank pressure when two compressors work in parallel. The torque increases with the pressure of the air tank and rotational speed. In addition, the torque value corresponding to compressor 2 is greater than that corresponding to compressor 1. In parallel mode, the CAES unit would have wide torque at the same rotation speed. It is obvious that under the same pressure, the torque changed from 5.39 N·m to 8.23 N·m at the rotation speed of 2850 r/min. On the contrary, single mode could reach 4.5 N·m at the same rotation speed. Parallel mode could absorb more torque from the servo motor. Working in the variable condition, the CAES unit would have a wide range to run. It is good for extensive CAES units. At the same rotation speed of 2850 r/min, the parallel range is from 5.39 N·m to 8.23 N·m. On the contrary, the single mode range is from 2.96 N·m to 4.25 N·m. But for lower rotation speeds, the single range is from 1.24 N·m to 2.23 N·m at 450 r/min. The parallel range is from 2.94 N·m to 4.65 N·m at 450 r/min.
Figure 18 shows the current at the same rotation speed has an influent on air tank pressure. High torque needs a high current to drive the compressor. Especially at air tank pressure, the compressor cannot pressurize the air in the tank easily, so it needs more torque, and more current at the same rotation speed. Such as for 2850 r/min, 1.4 bar, the current reaches 15.75 A and 12.71 A for compressor 2 and compressor 1. Dot lines show the parallel influence, at 2850 r/min, the air tank pressure at 1.4 bar and 2.6 bar could reach 28.47 A and 46.4 A. Parallel mode could absorb more current from the grid because the compressors are working in wide working conditions.
Figure 19 displays the variation of the pressure ratio with the pressure of the air tank when two compressors work in parallel. The pressure ratio curves of compressors 1 and 2 basically coincide at different rotational speeds and air tank pressures. In parallel operation mode, the pressure ratio corresponding to compressor 2 is greater than that corresponding to compressor 1.
Figure 20a describes the variation of compressor power consumption with the air tank pressure in parallel mode. It can be seen from the figure that the compressor power consumption increases with the increase in the air tank pressure and rotational speed. In addition, the power consumption corresponding to compressor 2 is greater than that corresponding to compressor 1 at different rotational speeds and air tank pressures.
Figure 20b describes the variation trend of the battery power output corresponding to the compressor with the air tank pressure in parallel mode. The battery power output corresponding to the compressor increases with the increase in the rotational speed and the air tank pressure. In parallel mode, the battery power output corresponding to compressor 2 is greater than that corresponding to compressor 1.
Figure 21a displays the variation of η1 with the air tank pressure in parallel mode. In general, η1 shows an increasing trend with the increase in the rotational speed and the air tank pressure. In parallel mode, the η1 of compressor 2 is greater than that of compressor 1.
Figure 21b displays the variation of η2 with the air tank pressure in parallel mode. In parallel mode, the variation trend of η2 with the air tank pressure is relatively gentle. η2 increases with the increase in rotational speed. In addition, the η2 corresponding to compressor 2 is greater than that corresponding to compressor 1 at different rotational speeds and air tank pressures.
There is a large difference in isotropic efficiency at lower air tank pressures, but the tendency is similar to Figure 16b. The air could obtain more energy at higher air tank pressures at the same rotation speed. For isotropic efficiency, Figure 21b shows a good performance in single mode, the isotropic efficiency is slowed down as the air tank pressure increases. In parallel mode, this index first increases and then decreases in a small fluctuation range.

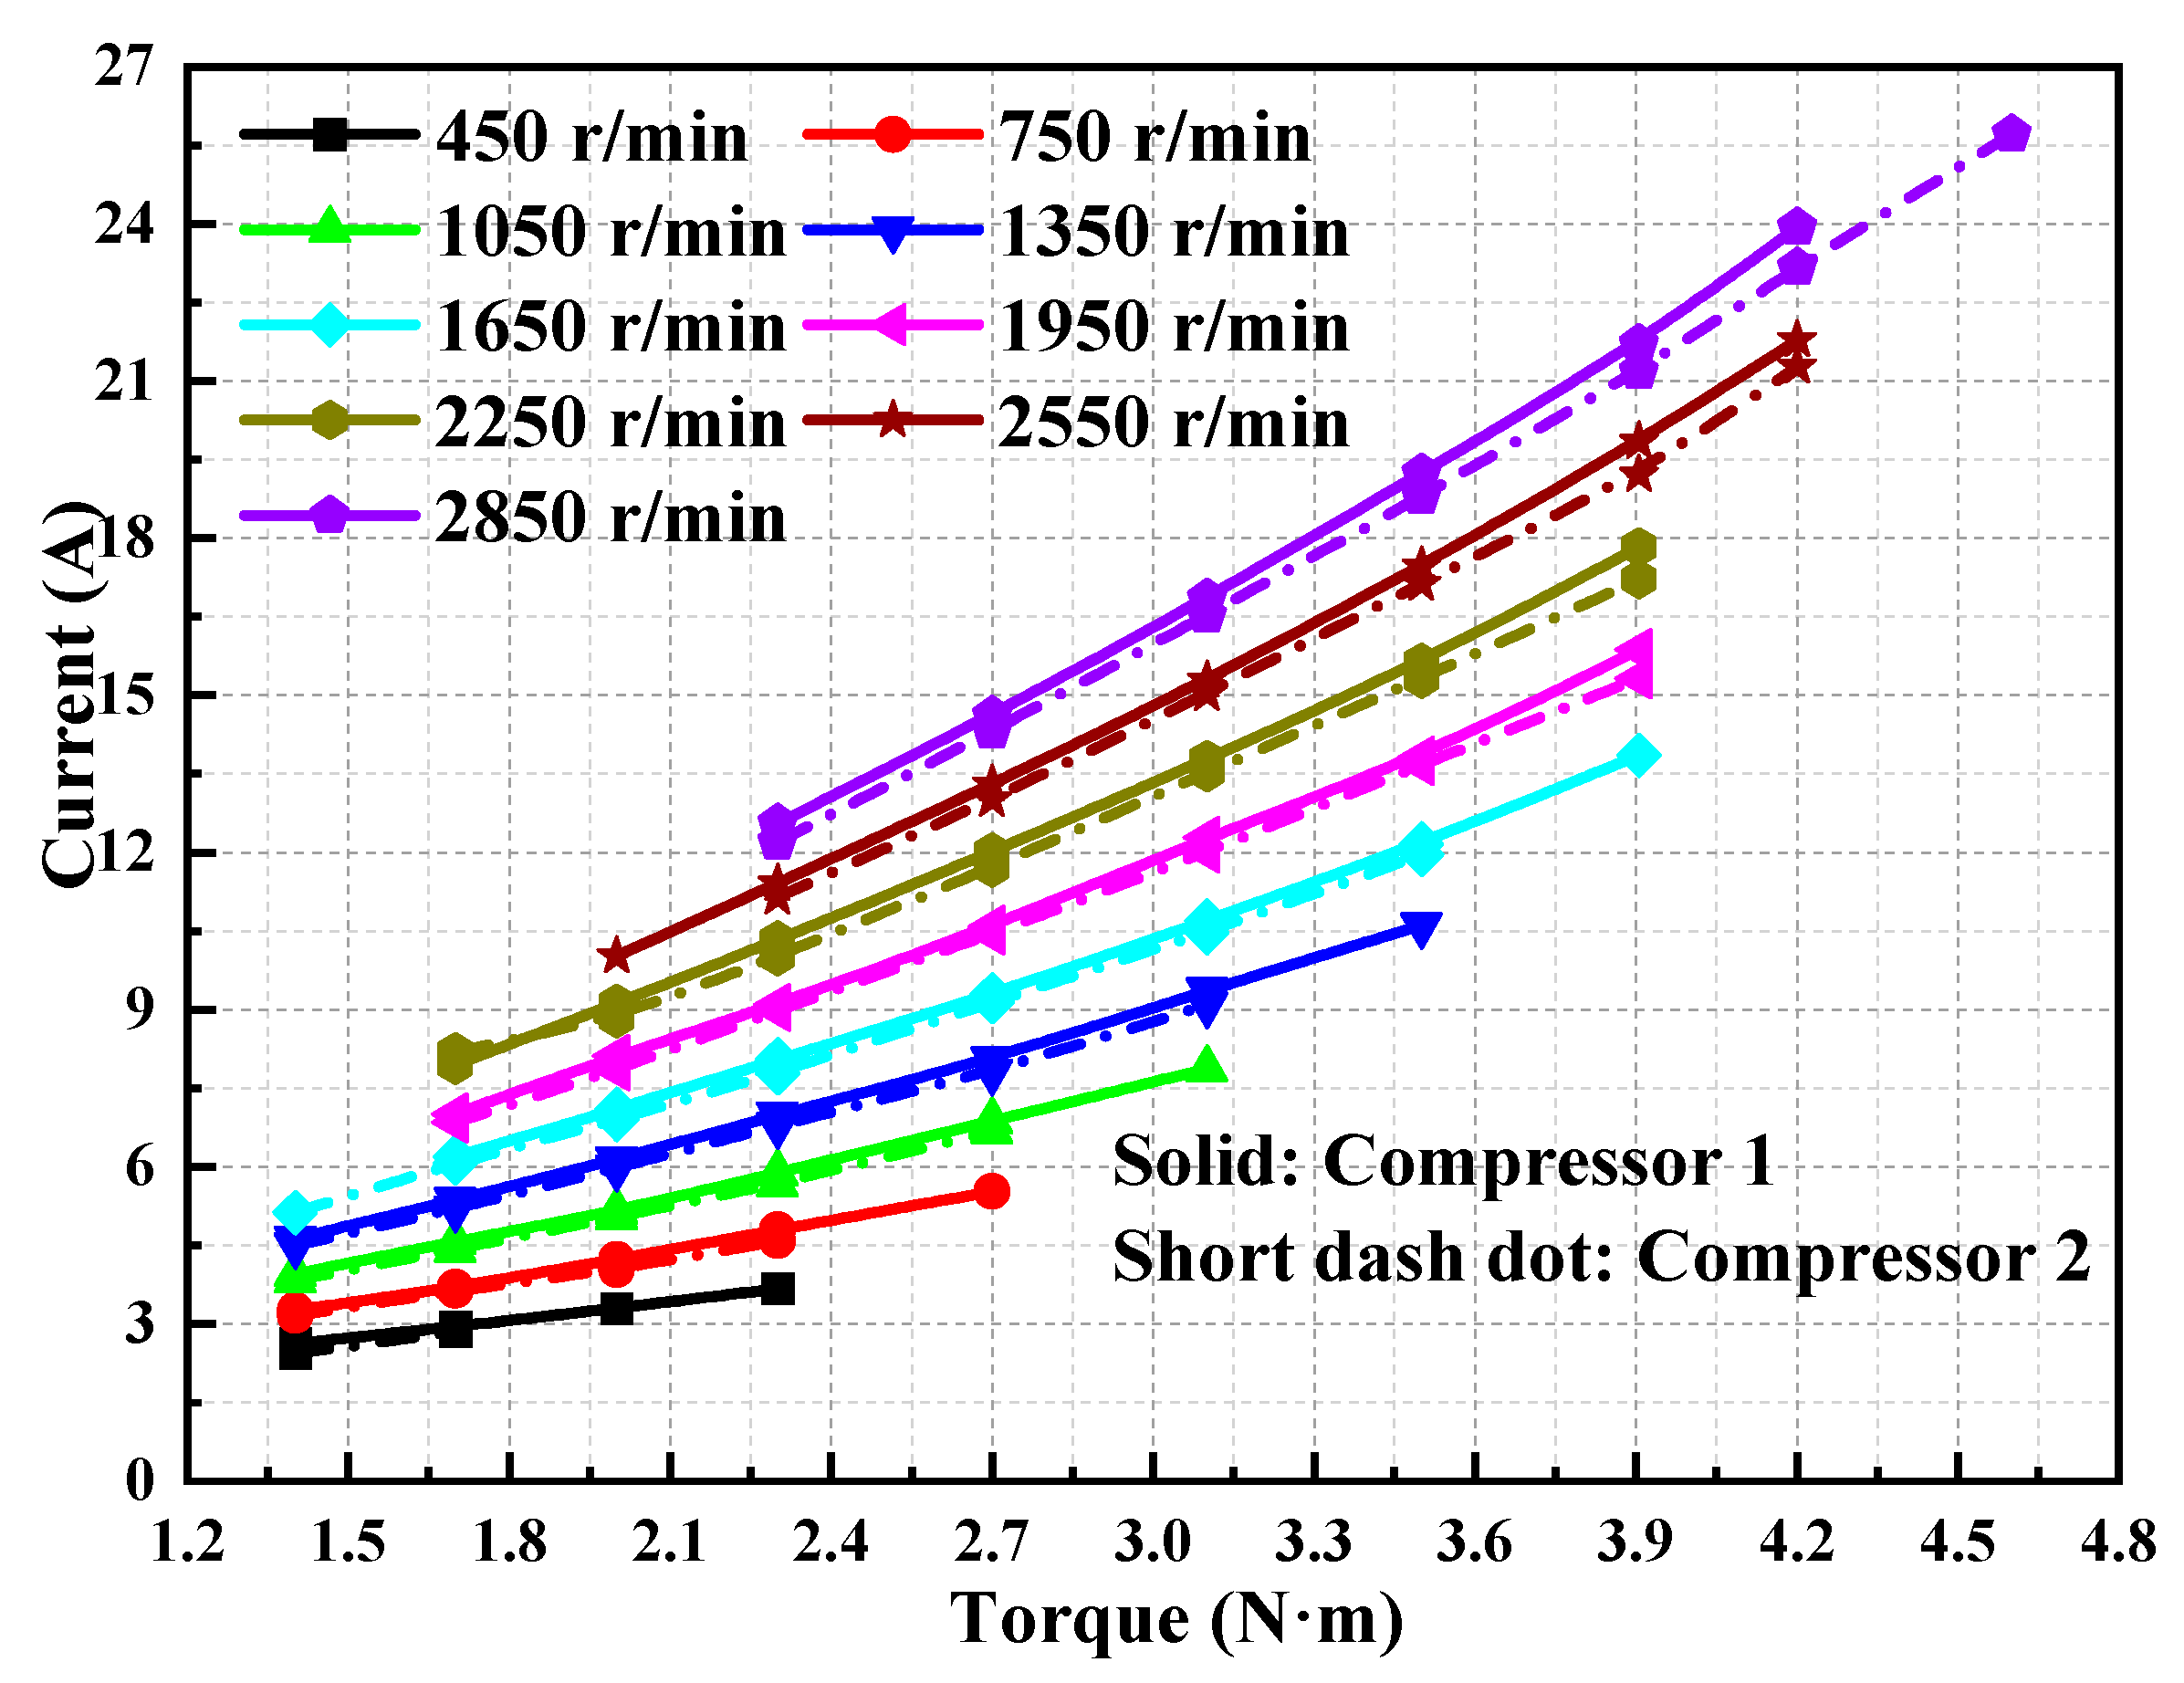
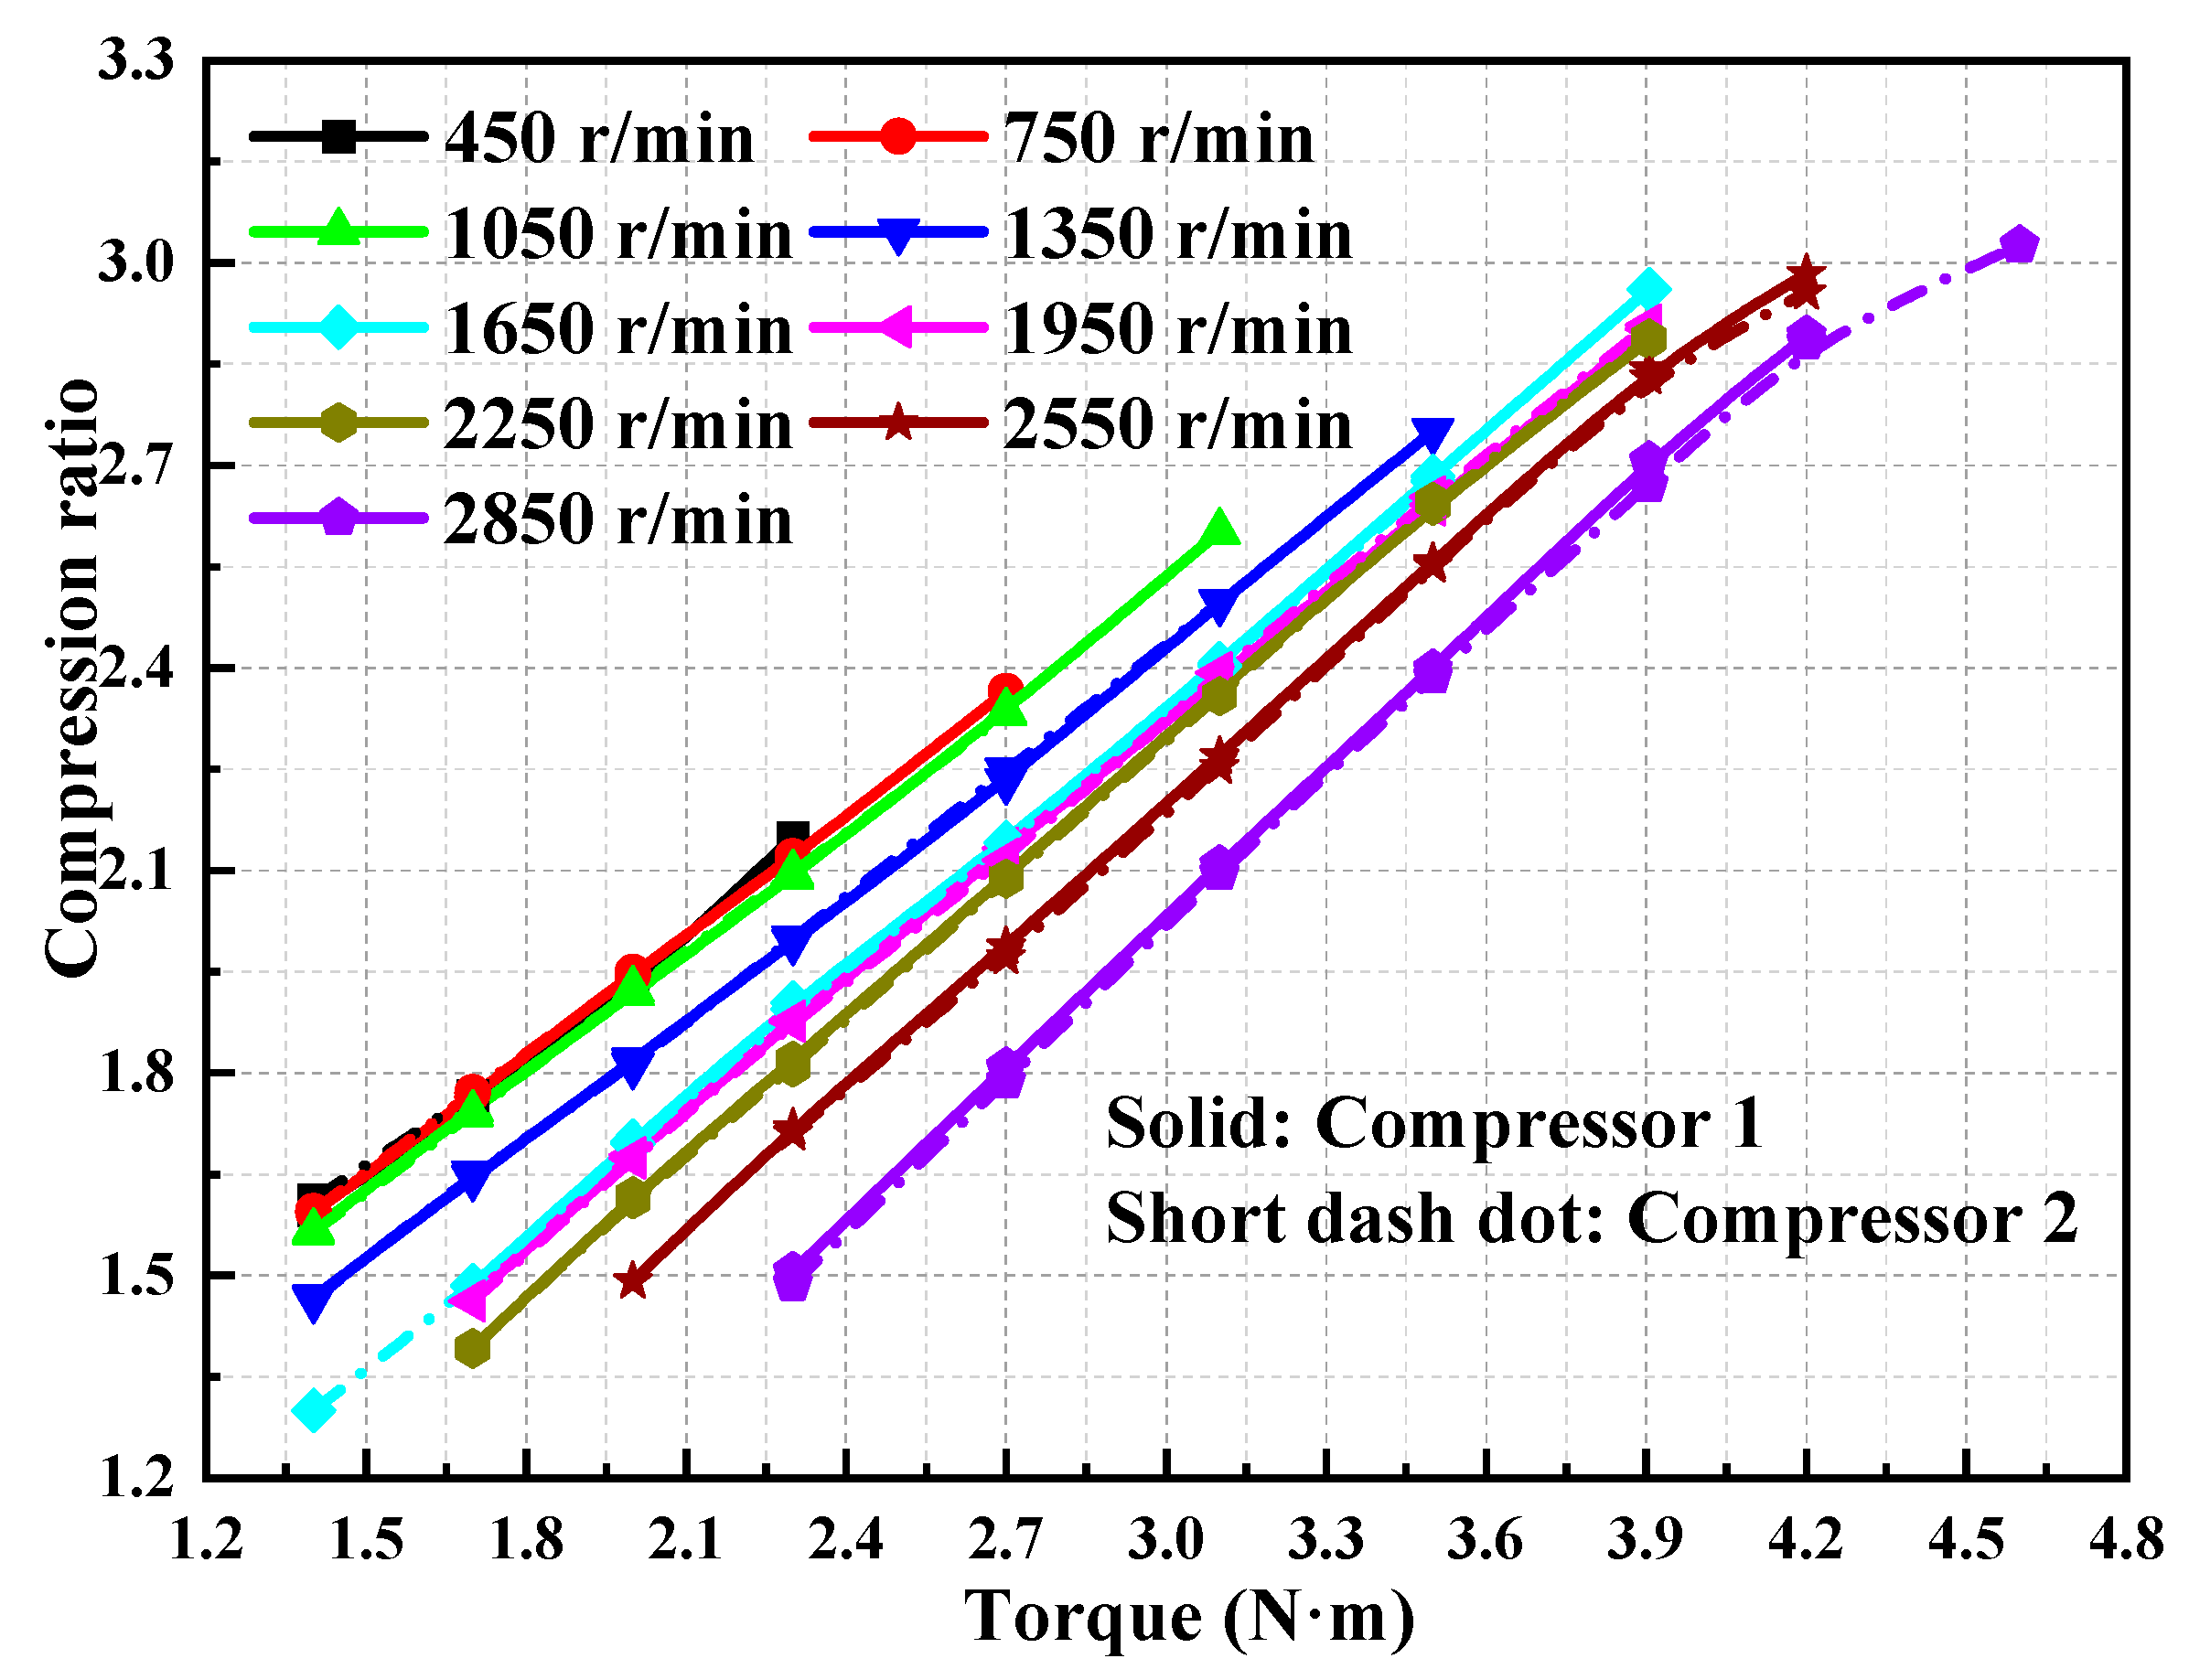
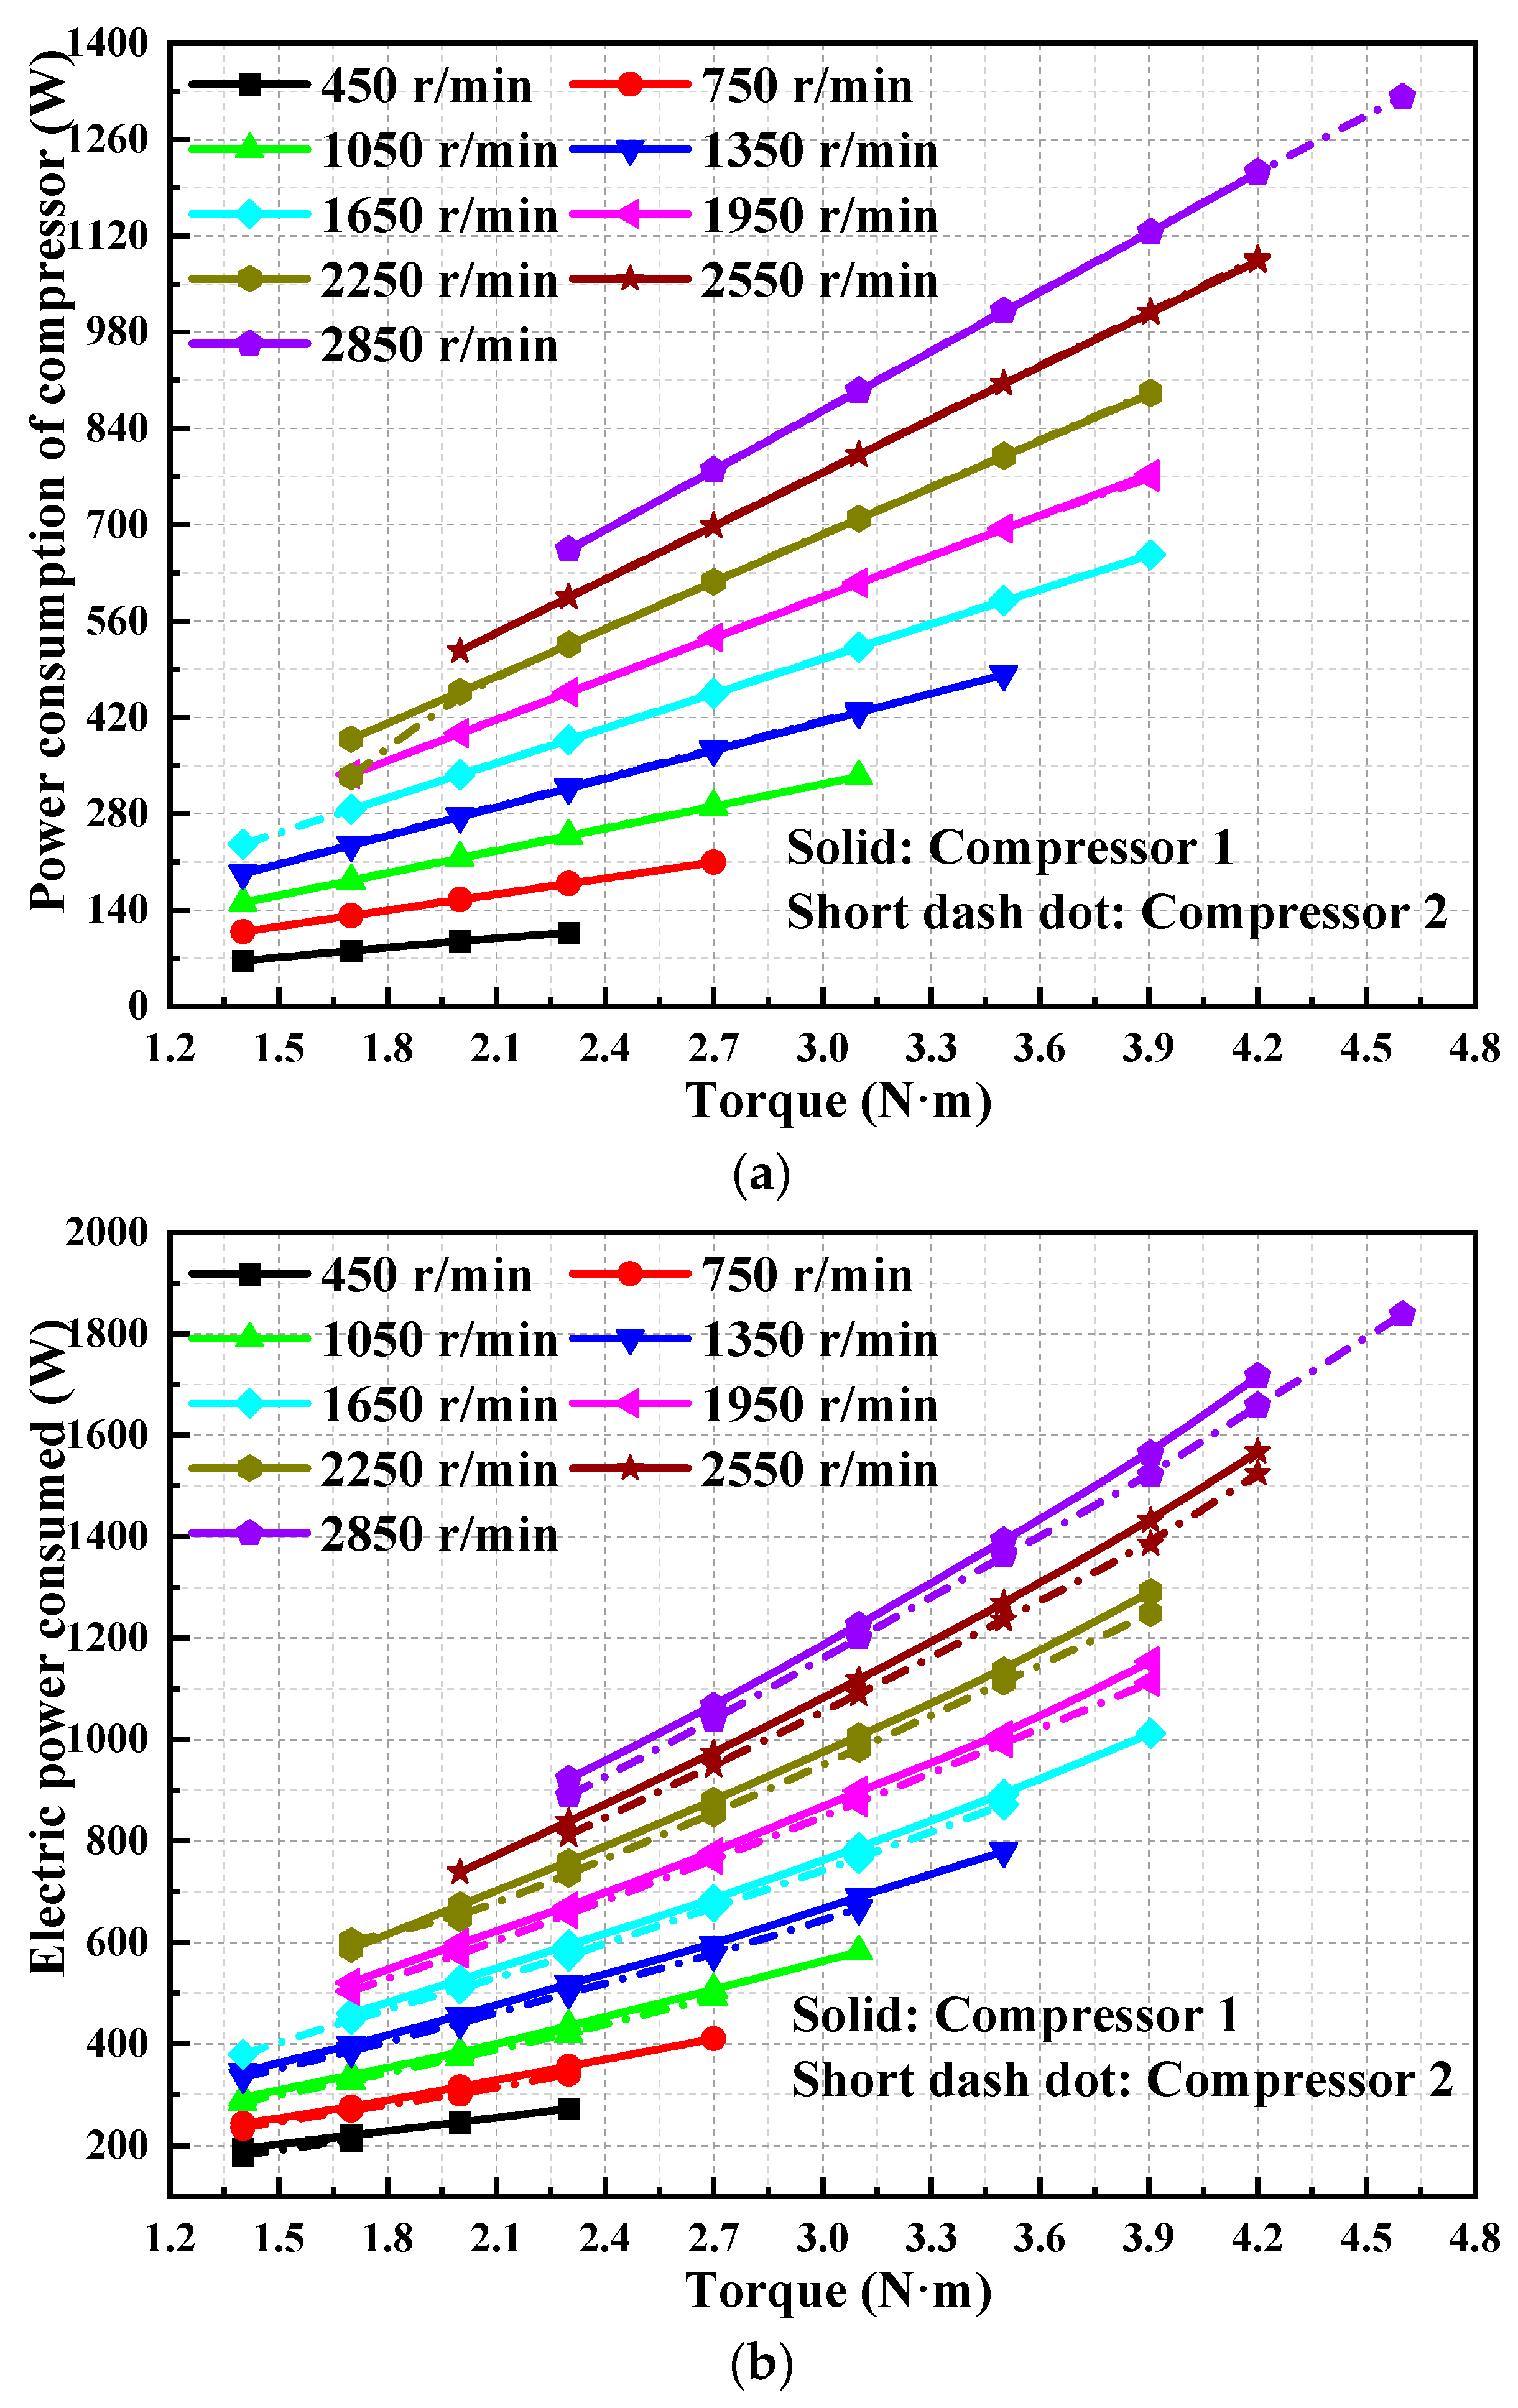
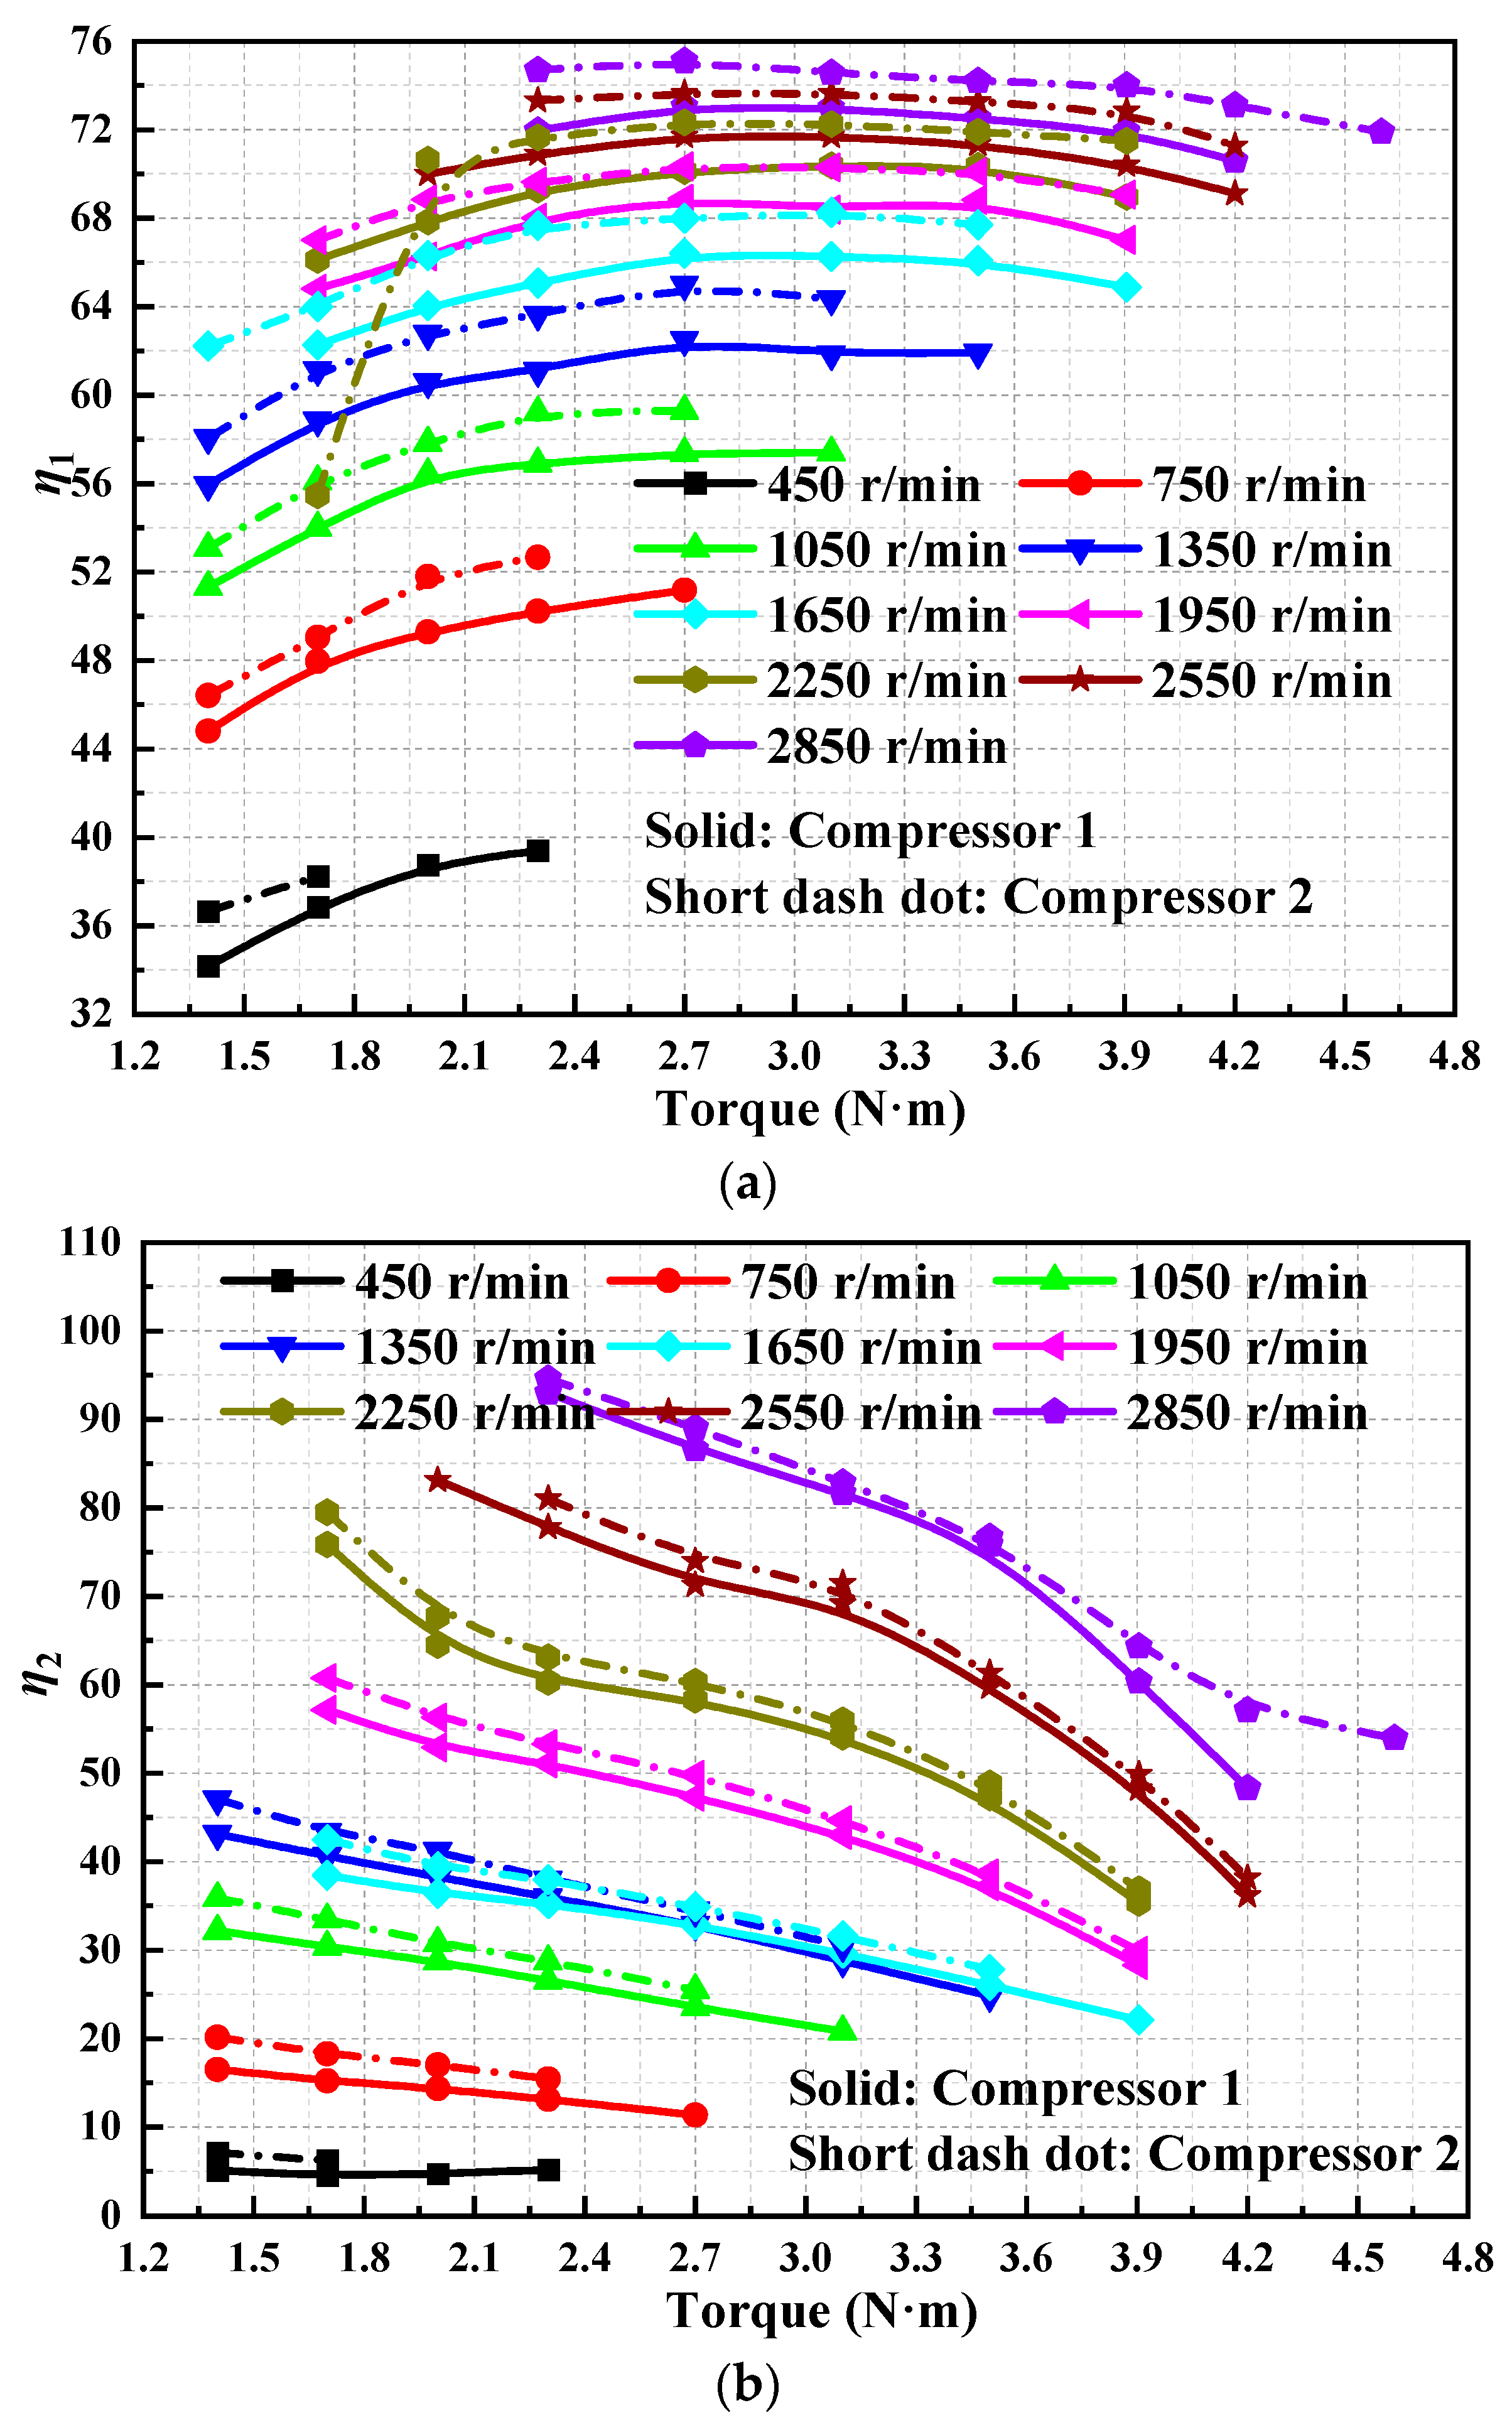
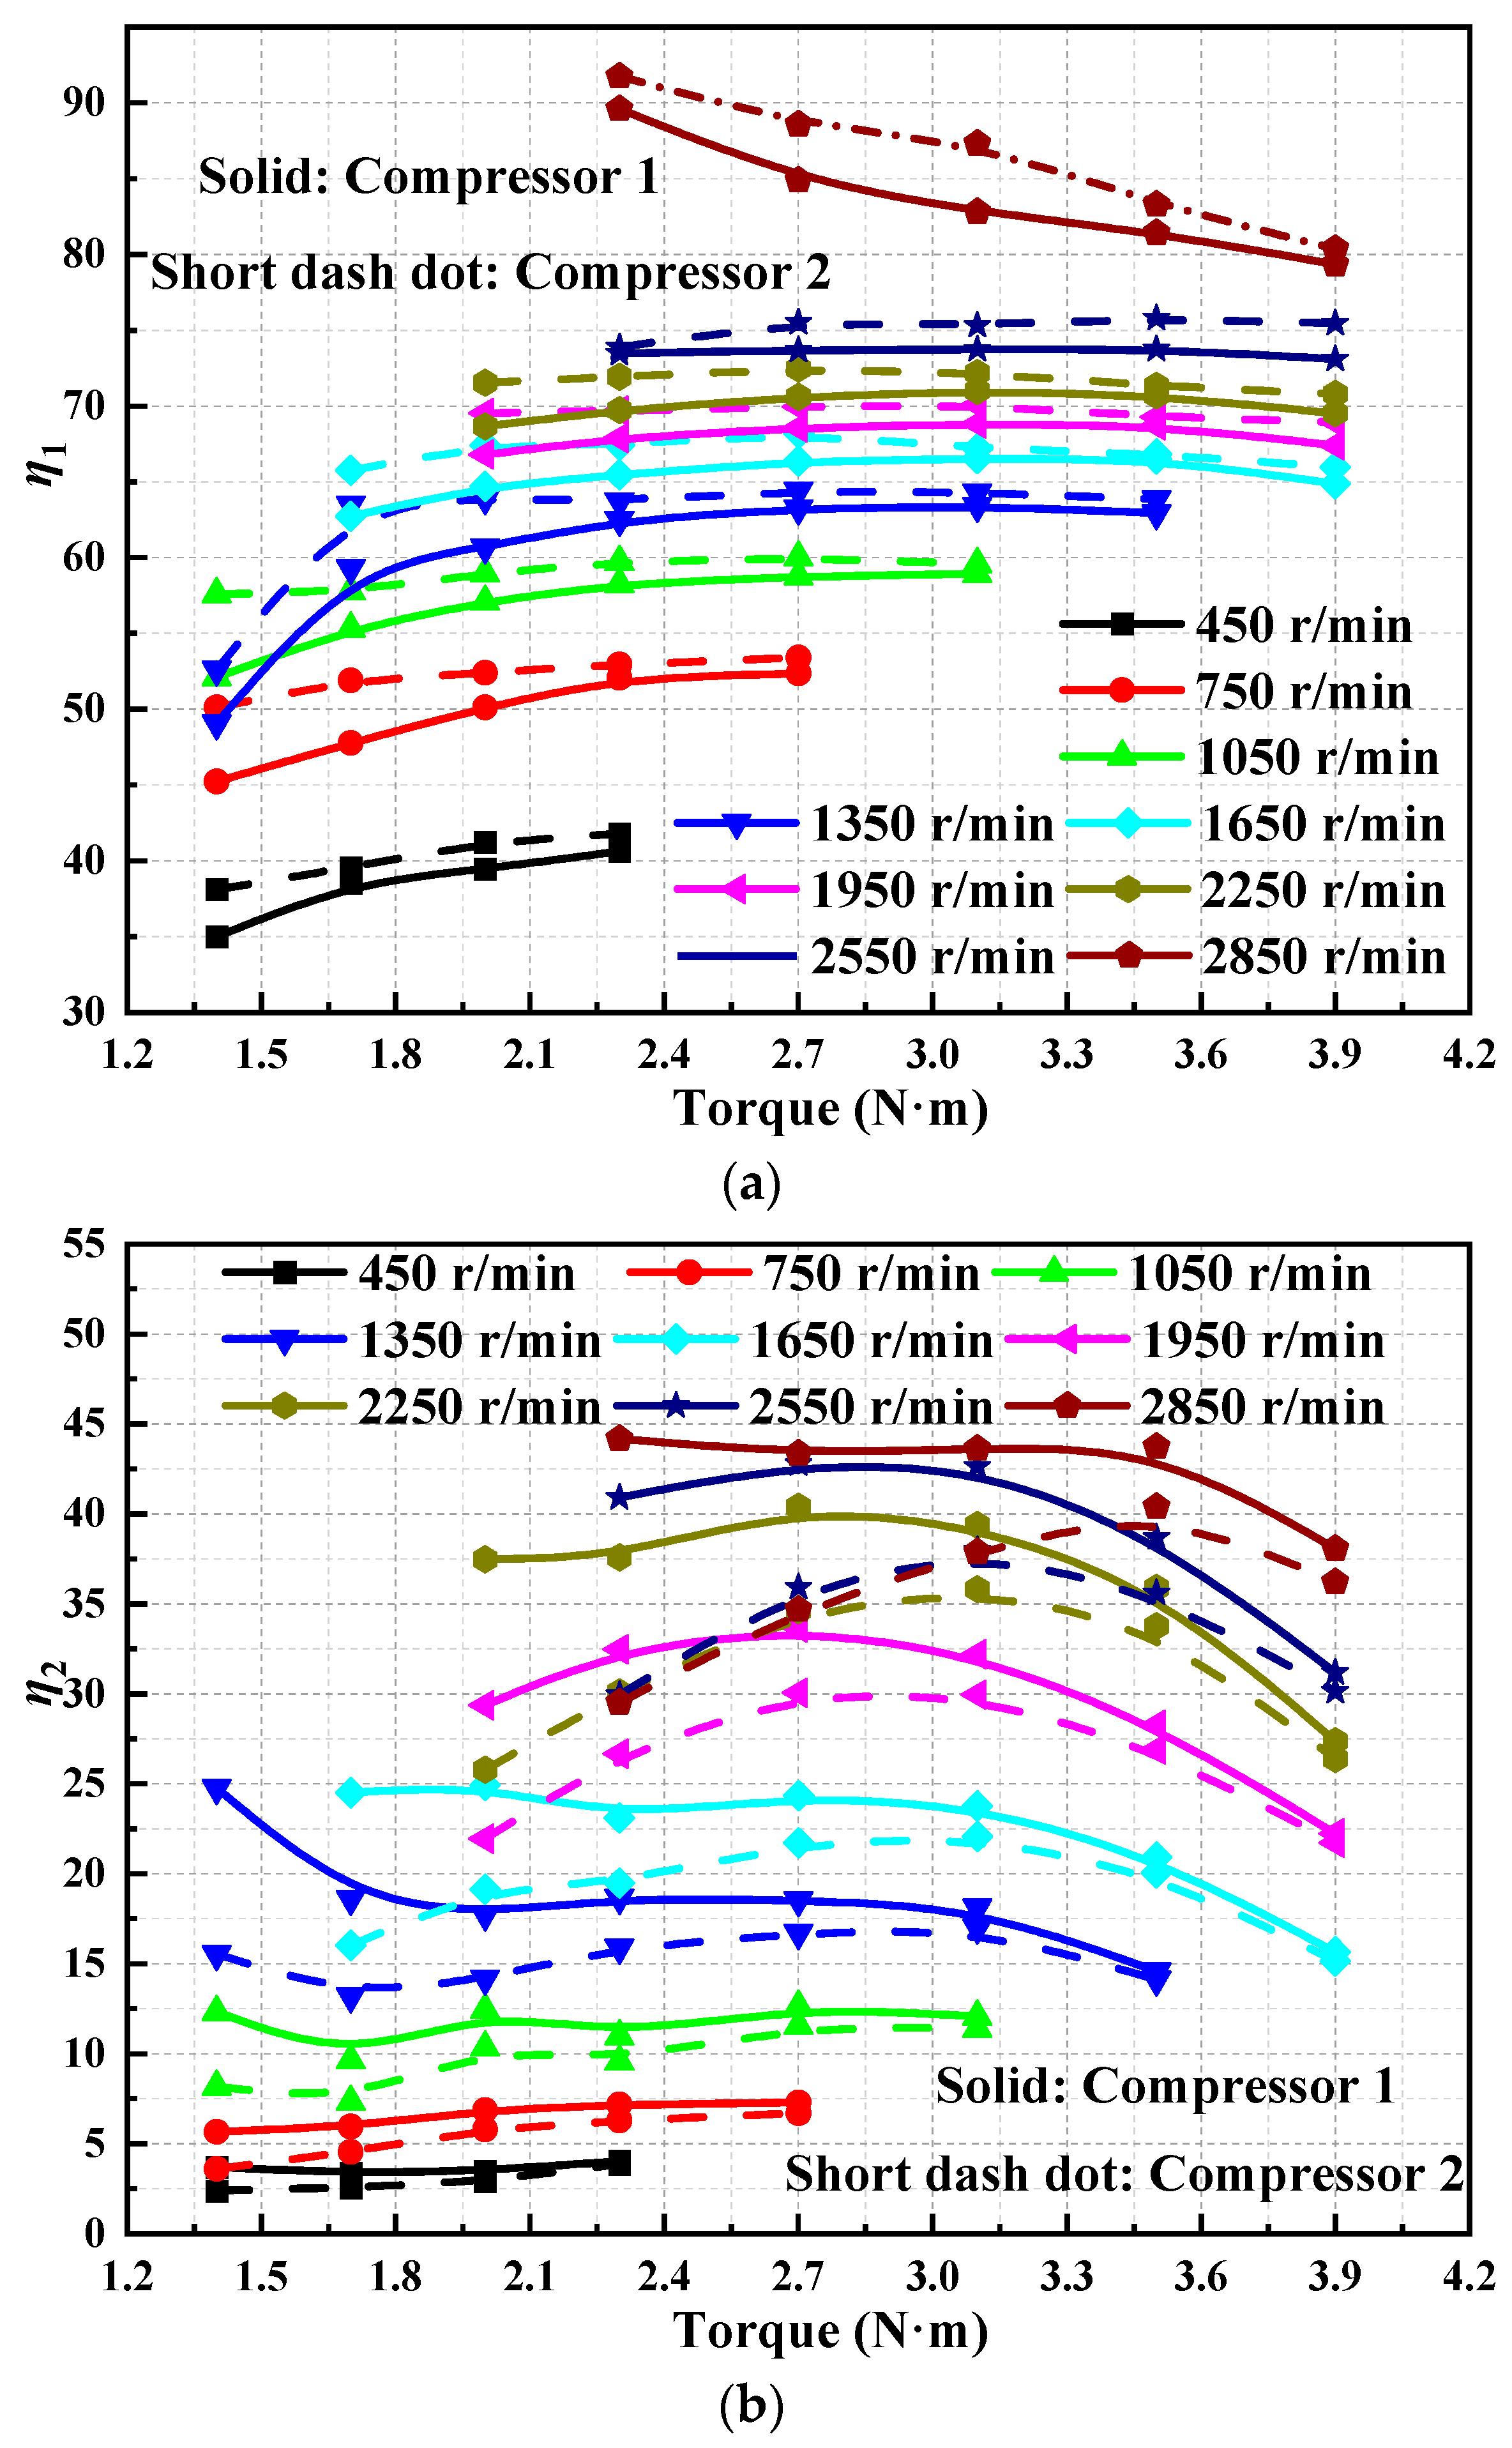
3.5. Influence of Torque on the Performance of the Compressor in Parallel Mode

In Figure 22, solid and dash-dot lines display the variation of the battery current corresponding to the compressor with torque in parallel mode. In parallel mode, the battery current increases with the increase in torque and rotational speed. Moreover, the battery current corresponding to compressor 2 is greater than that corresponding to compressor 1 at different rotational speeds and torques. In parallel mode, the compressor current range is from 29.02 A to 45.76 A, from 25.69 A to 42.07 A, and from 20.73 A to 37.61 A, corresponding to 2850 r/min, 2550 r/min, and 2250 r/min. The values are larger than those in single mode, and the range is wider than in single mode. That means compressor parallel mode could work in a large and wide current situation.
Figure 23 presents the variation of pressure ratio with torque in parallel mode. In parallel mode, the pressure ratio increases with the increase in torque while decreasing with the increase in rotational speed. The pressure ratio corresponding to compressor 2 is greater than that corresponding to compressor 1 at different rotational speeds and torques.
Figure 24a describes the variation of compressor power consumption with torque in parallel mode. The power consumption of the compressor increases with the increase in torque and rotational speed. In parallel mode, the power consumption of compressor 2 is greater than that of compressor 1 at different rotational speeds and torques. A fixed voltage could cause Figure 22 and Figure 24a to overlap.
Figure 24b displays the variation of the battery power output corresponding to the compressor in parallel mode with the torque. The power output of the battery corresponding to the compressor increases with the increase in torque and rotational speed. In parallel mode, the battery power output corresponding to compressor 2 is greater than that corresponding to compressor 1 at different rotational speeds and torques.
Figure 25a exhibits the variation of η1 with torque in parallel mode. In general, η1 increases first and then tends to be flat with the increase in torque. In parallel mode, the η1 of compressor 2 is higher than that of compressor 1 at different rotational speeds and torques. Higher efficiency could be achieved in small torque and maintained in a wide torque range.
Figure 25b describes the variation of η2 with torque in parallel mode. When the rotational speed is low, η2 decreases first and then tends to be flat with the increase in torque. When the speed is high, η2 first increases, then tends to be flat, and finally decreases slightly with the increase in torque. In parallel mode, η2 of compressor 1 is higher than that of compressor 2 at different rotational speeds and torques. In parallel mode, a lower torque leads to higher isotropic efficiency for the two compressors. As the torque increases, isotropic efficiency is promoted at the same rotation speed. The isotropic efficiency is distributed in a wide bell curve at high rotation speeds. But in the same torque range, the fluctuation is not wide. On the contrary, a small rotation speed change is not significant.

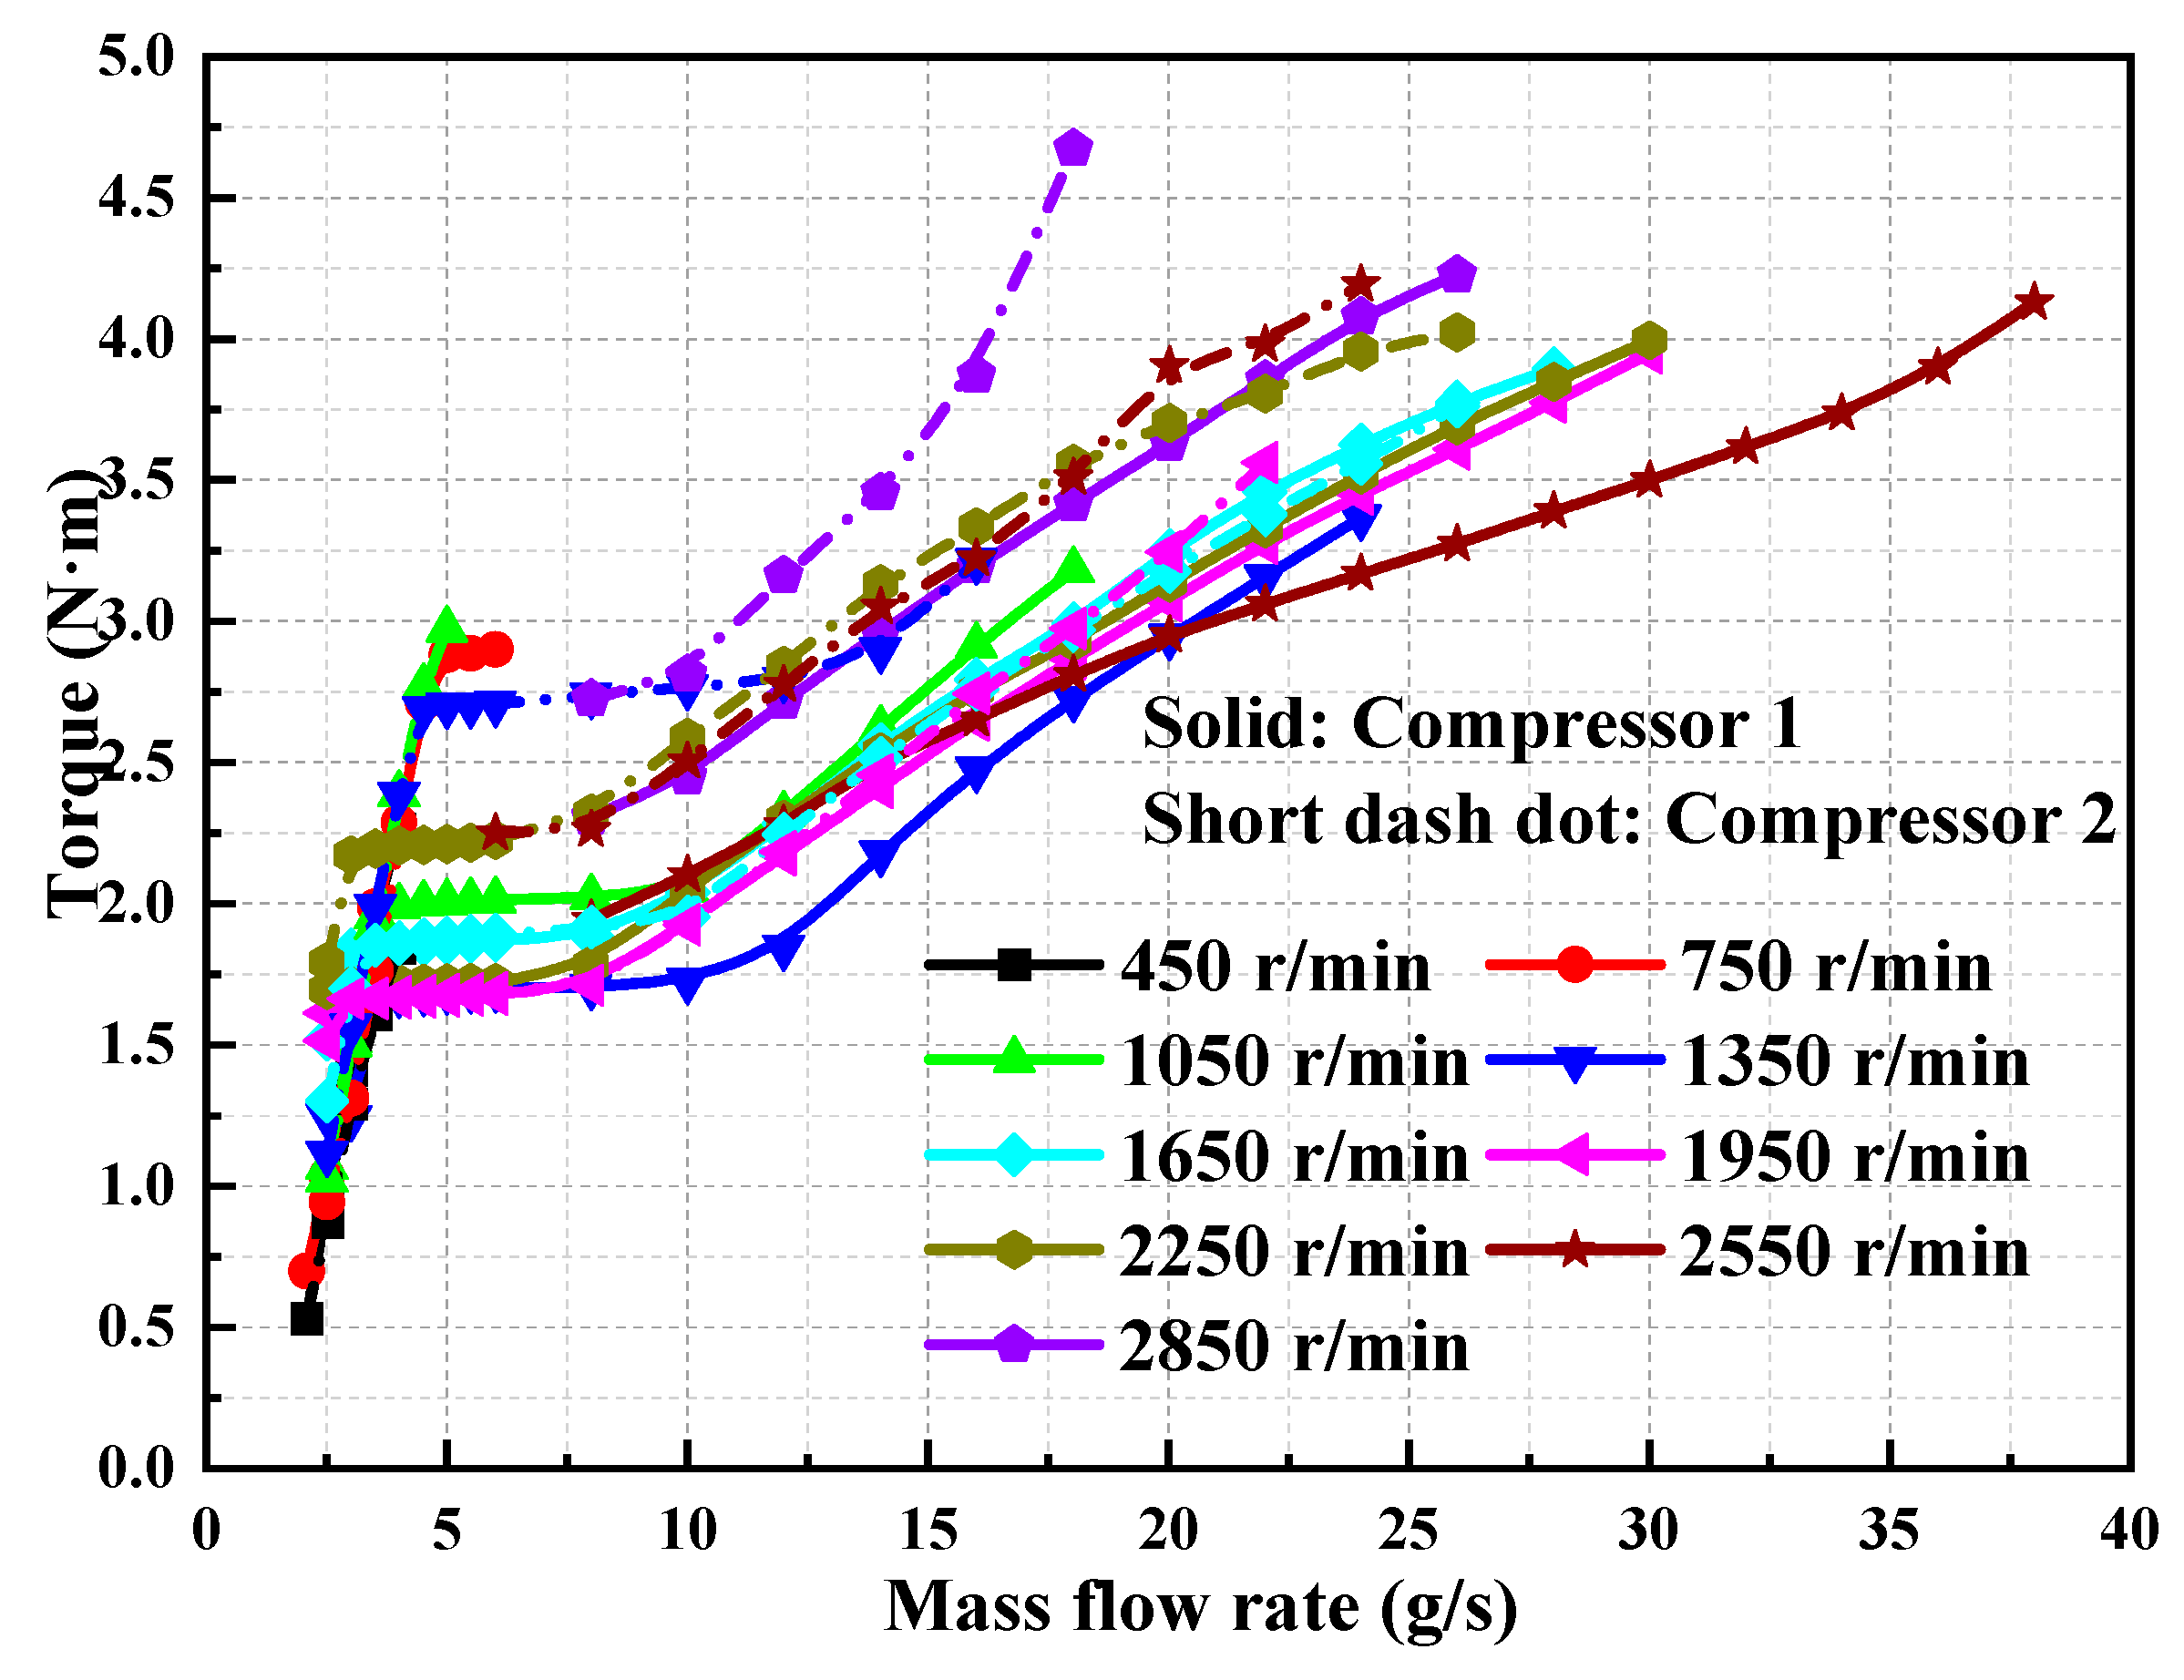
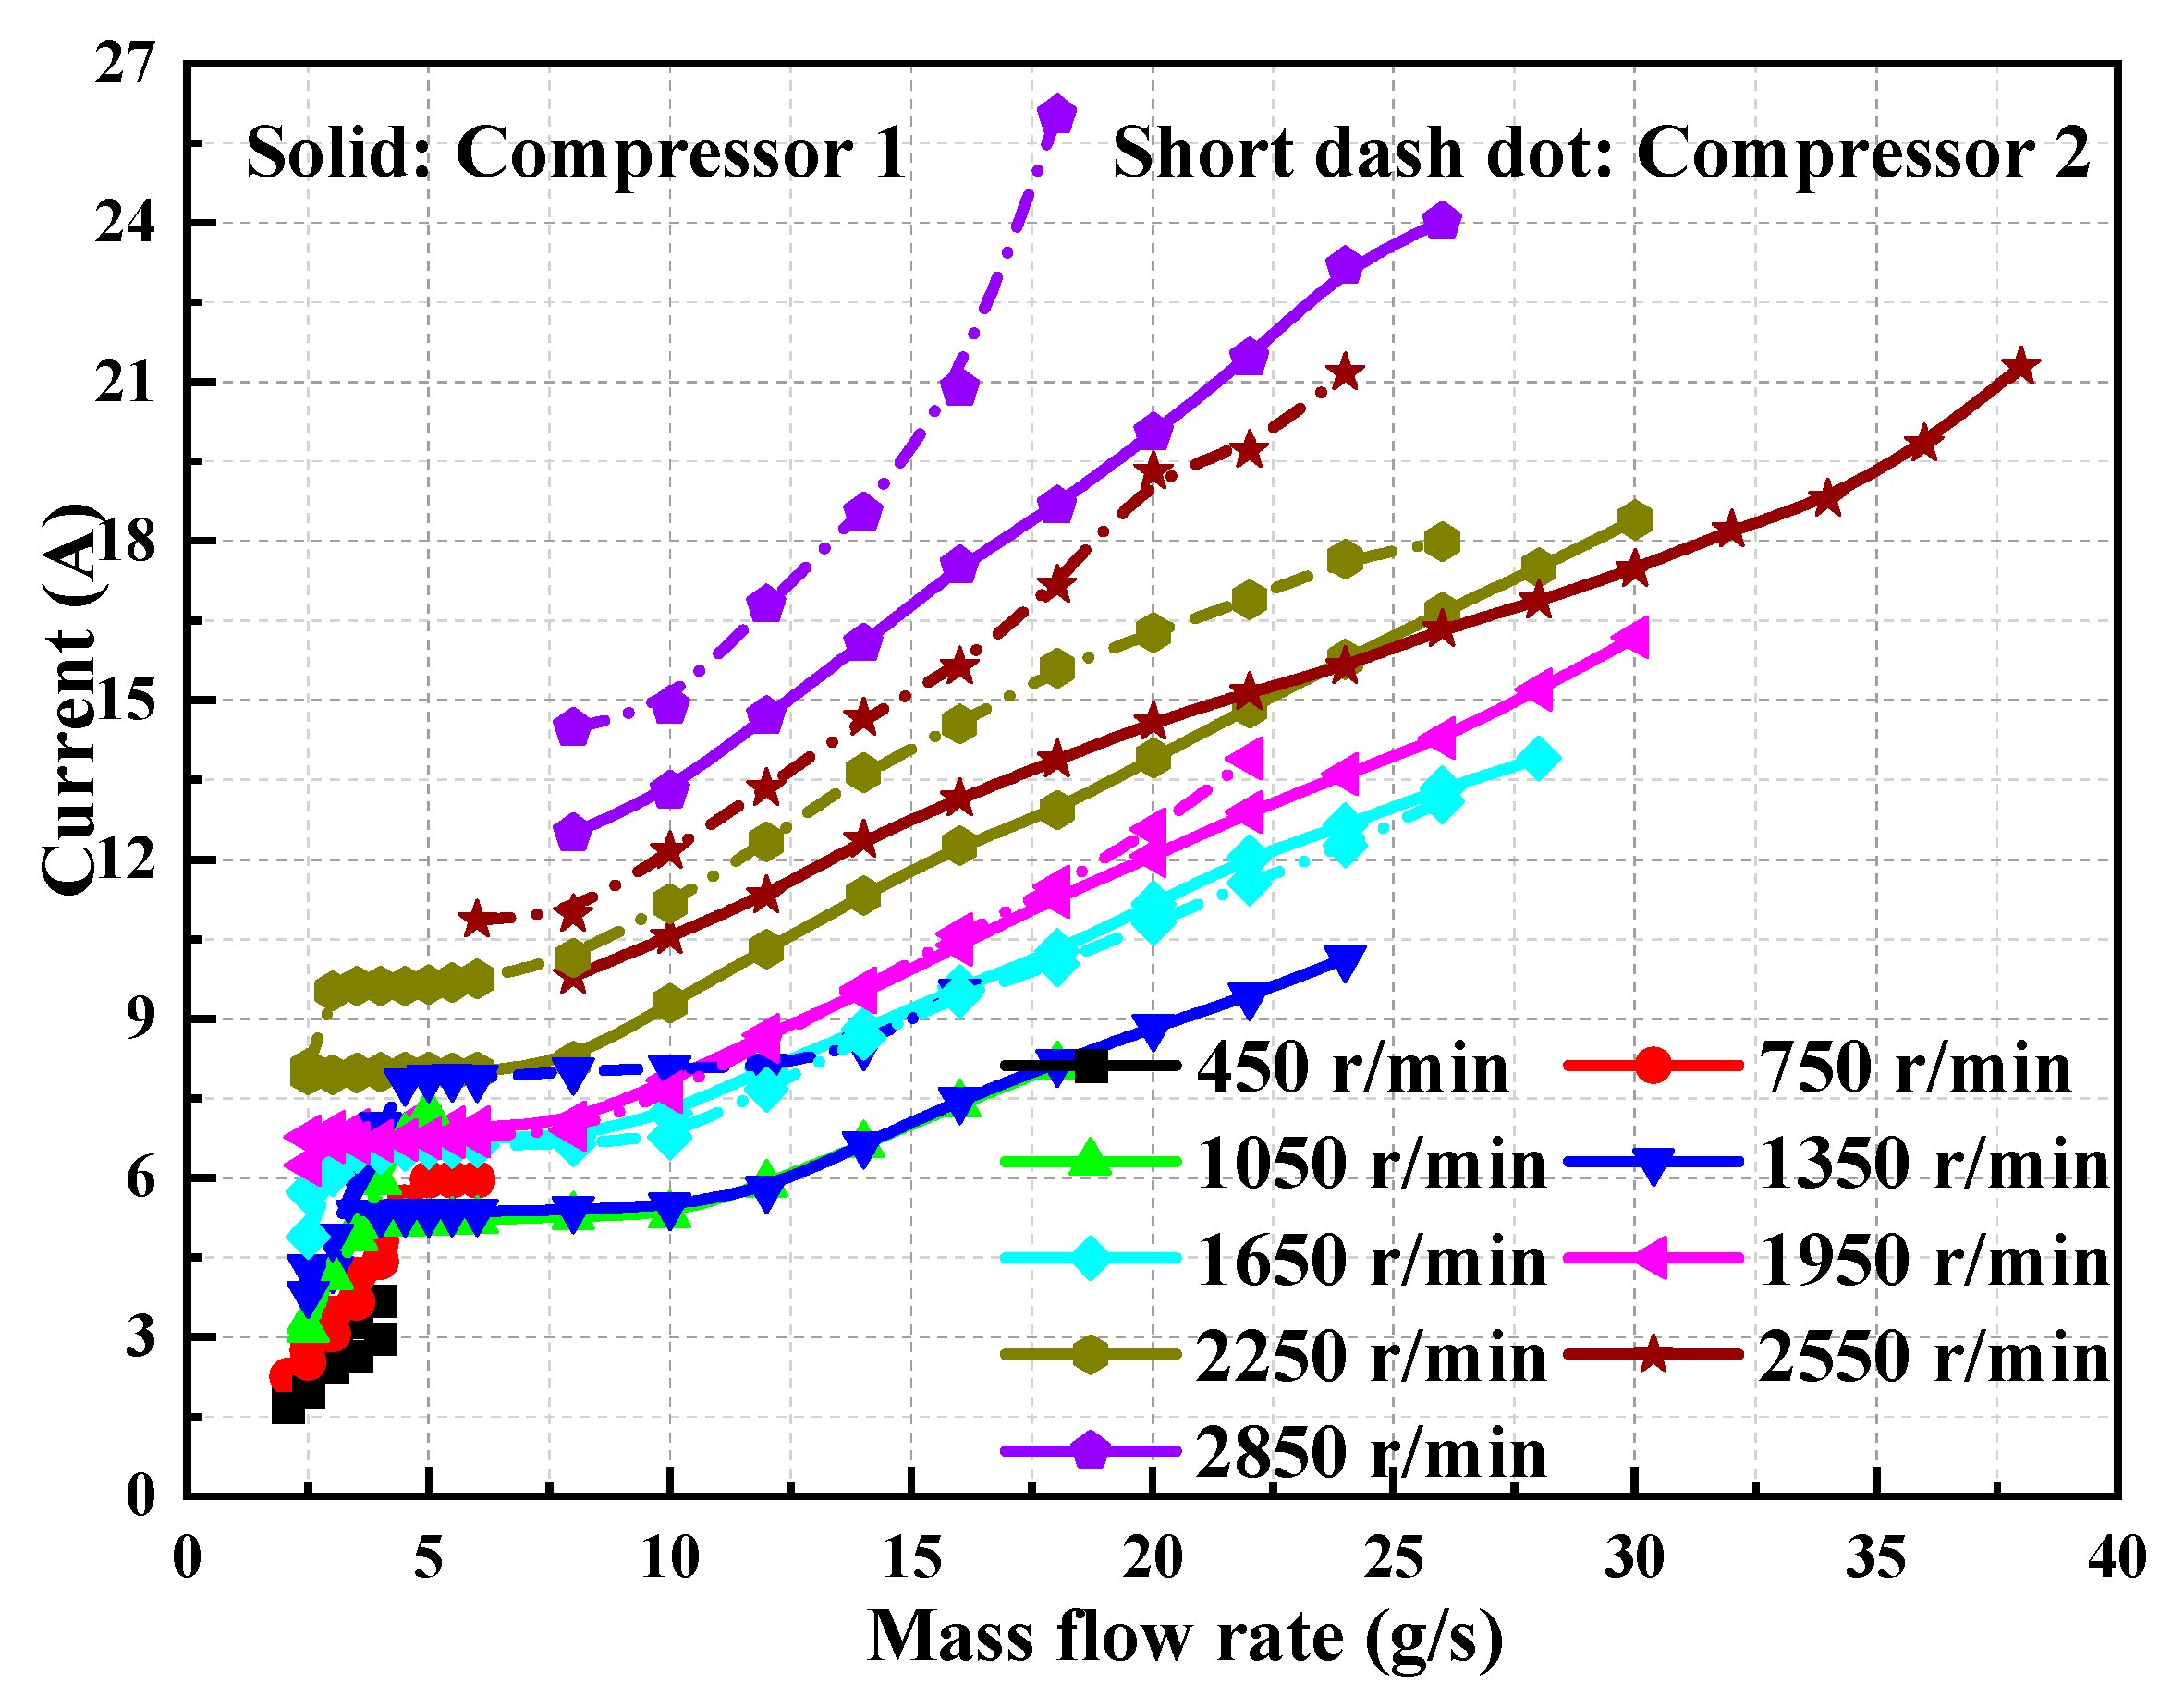
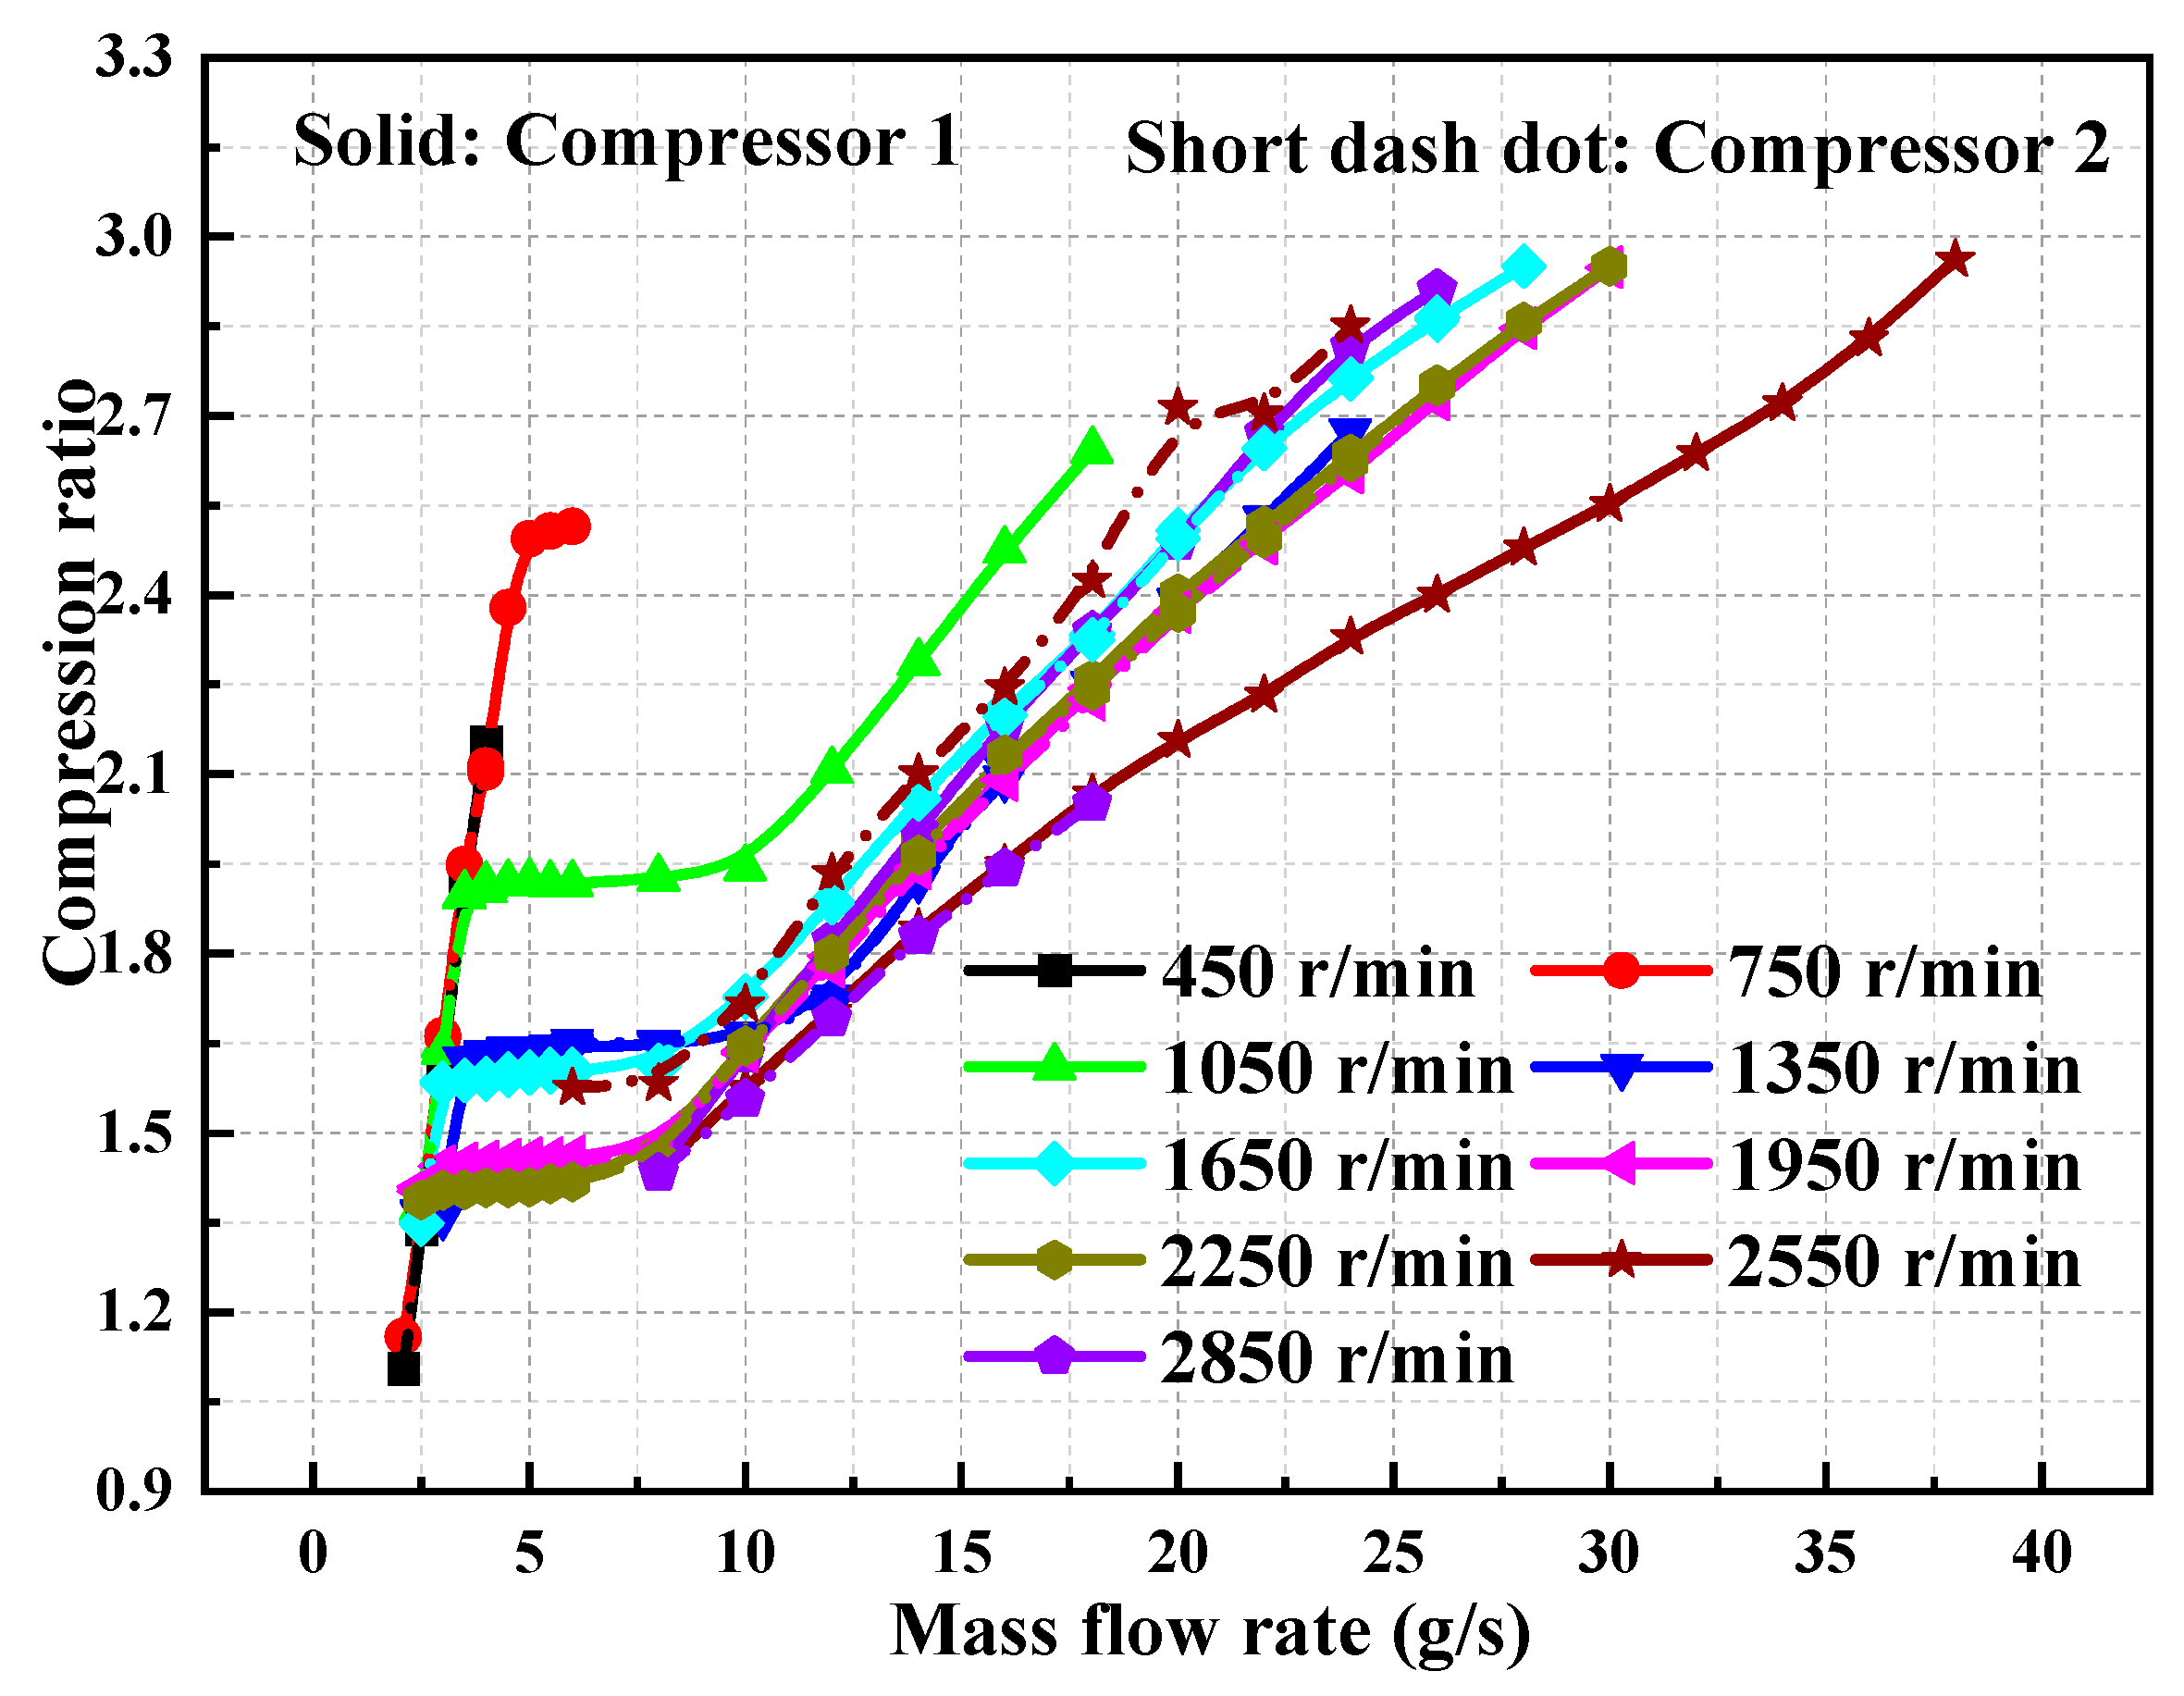
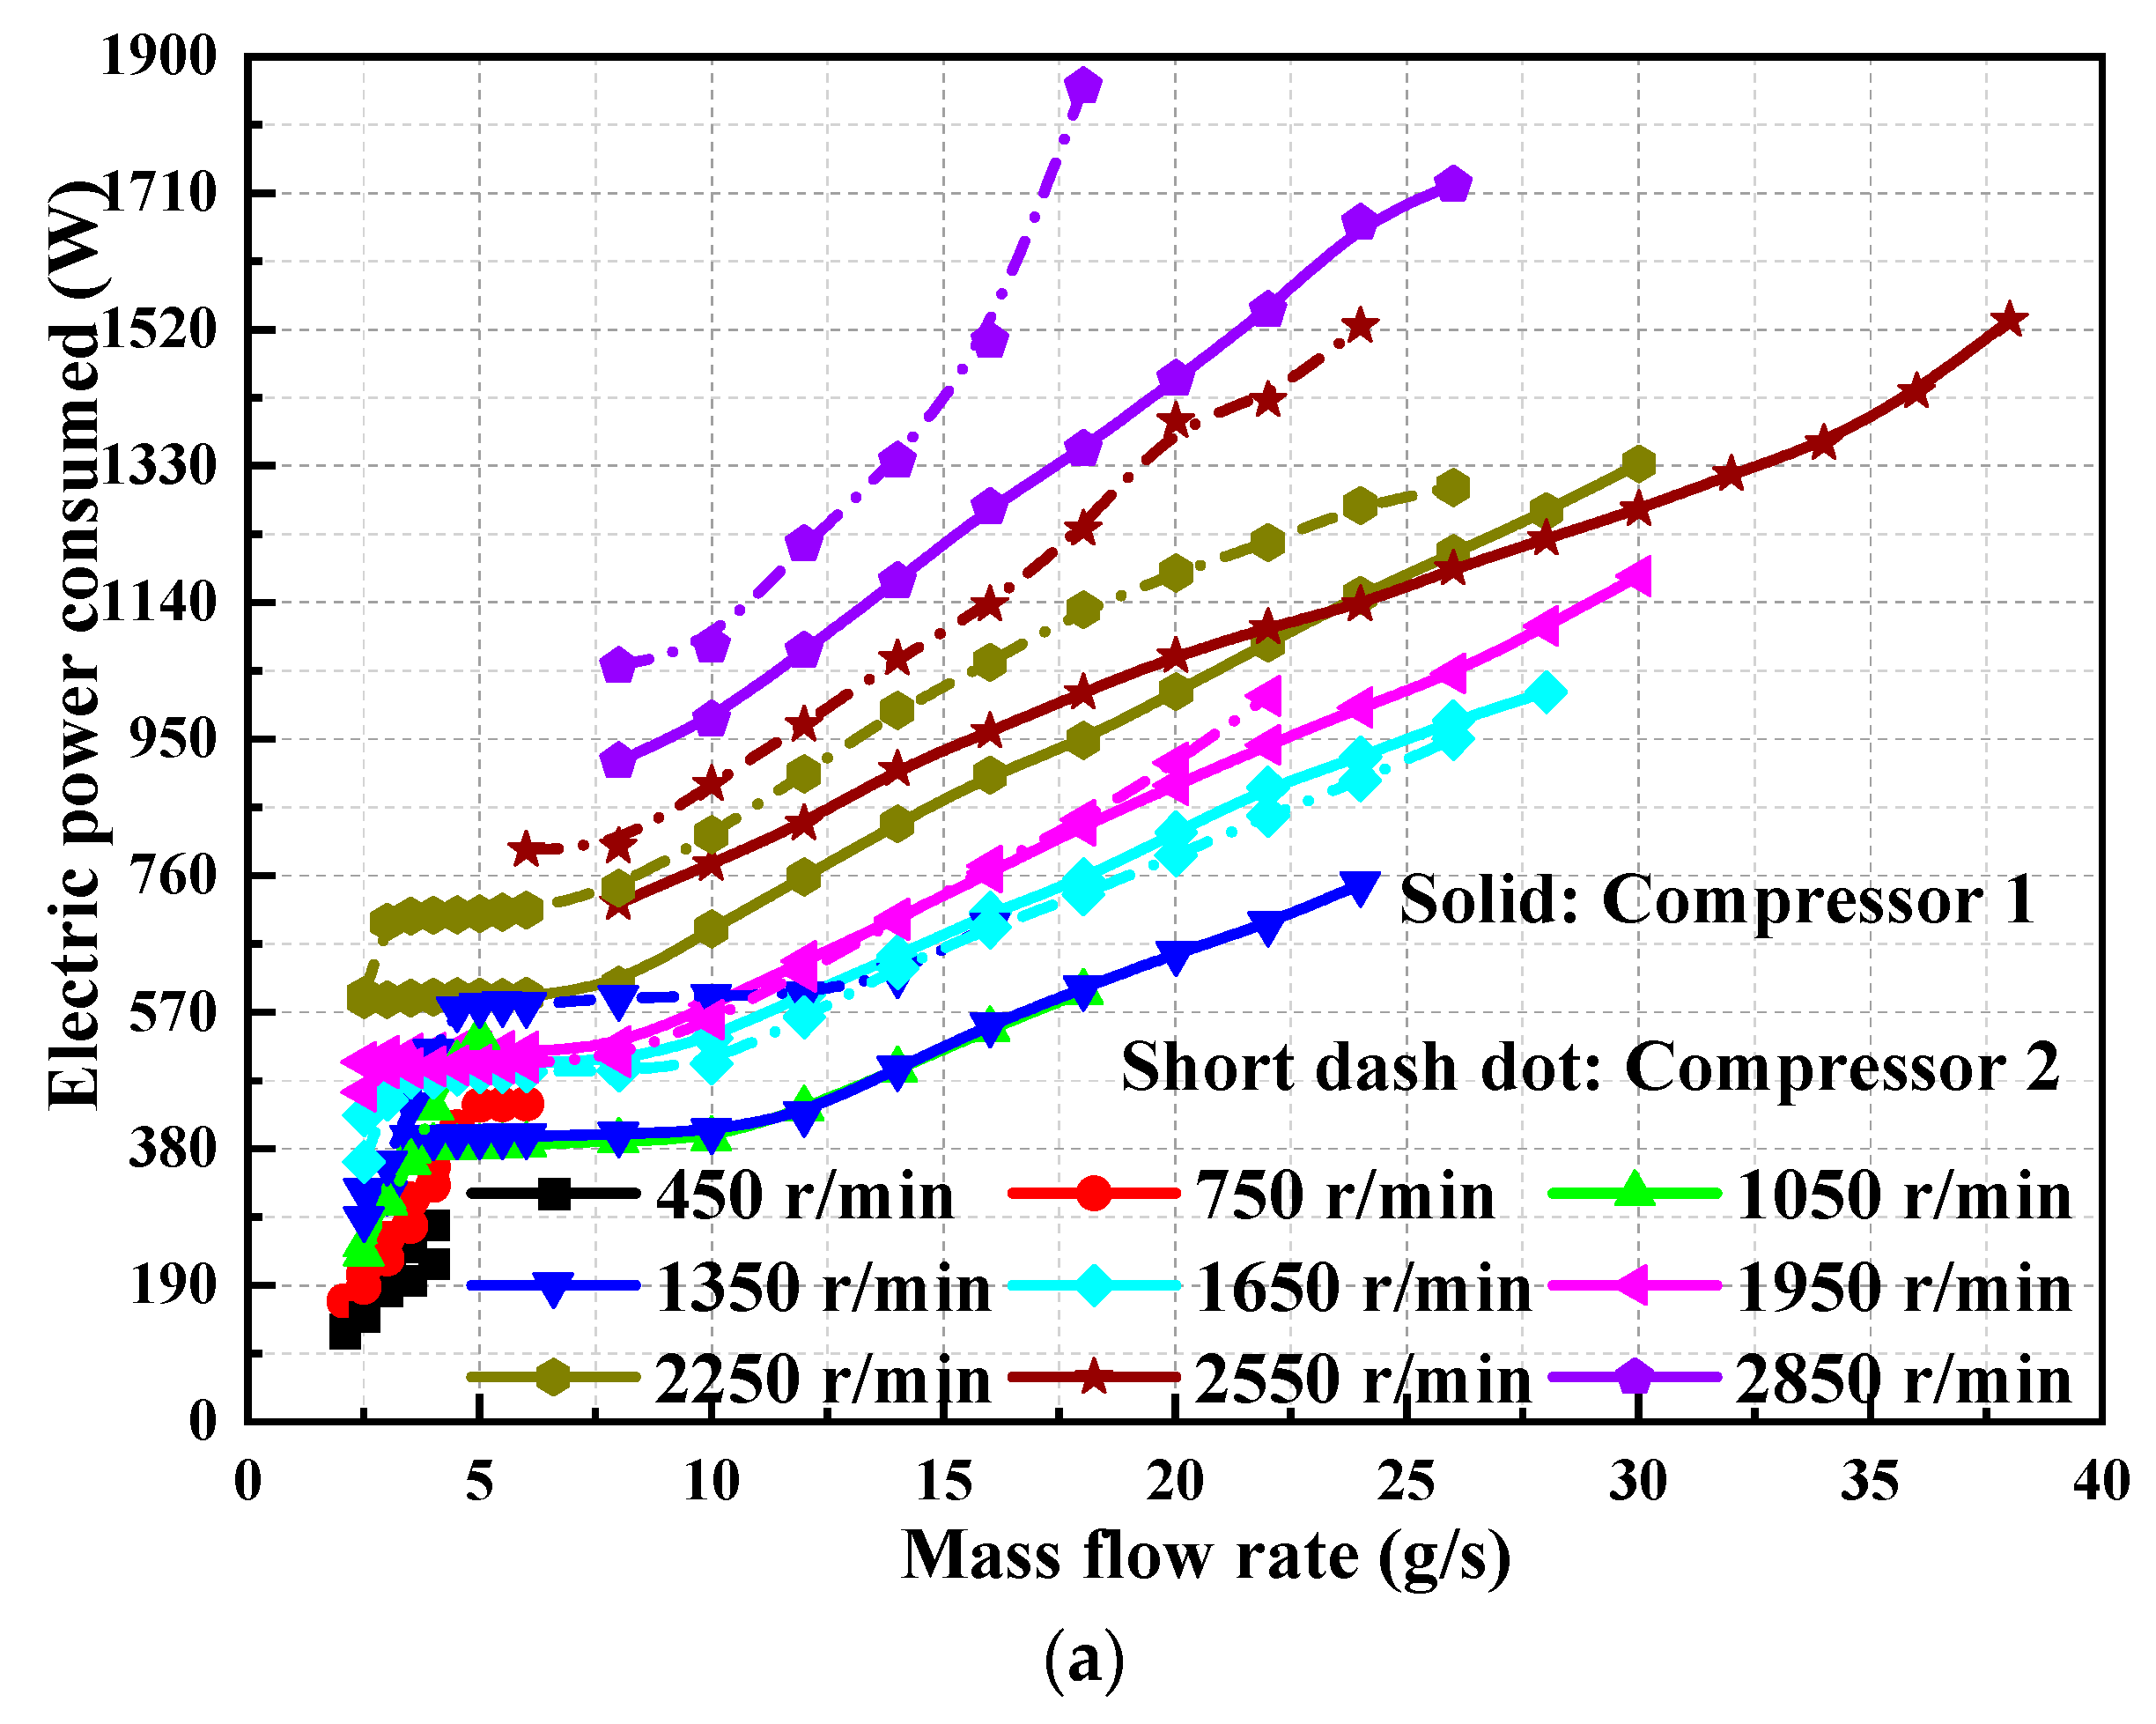
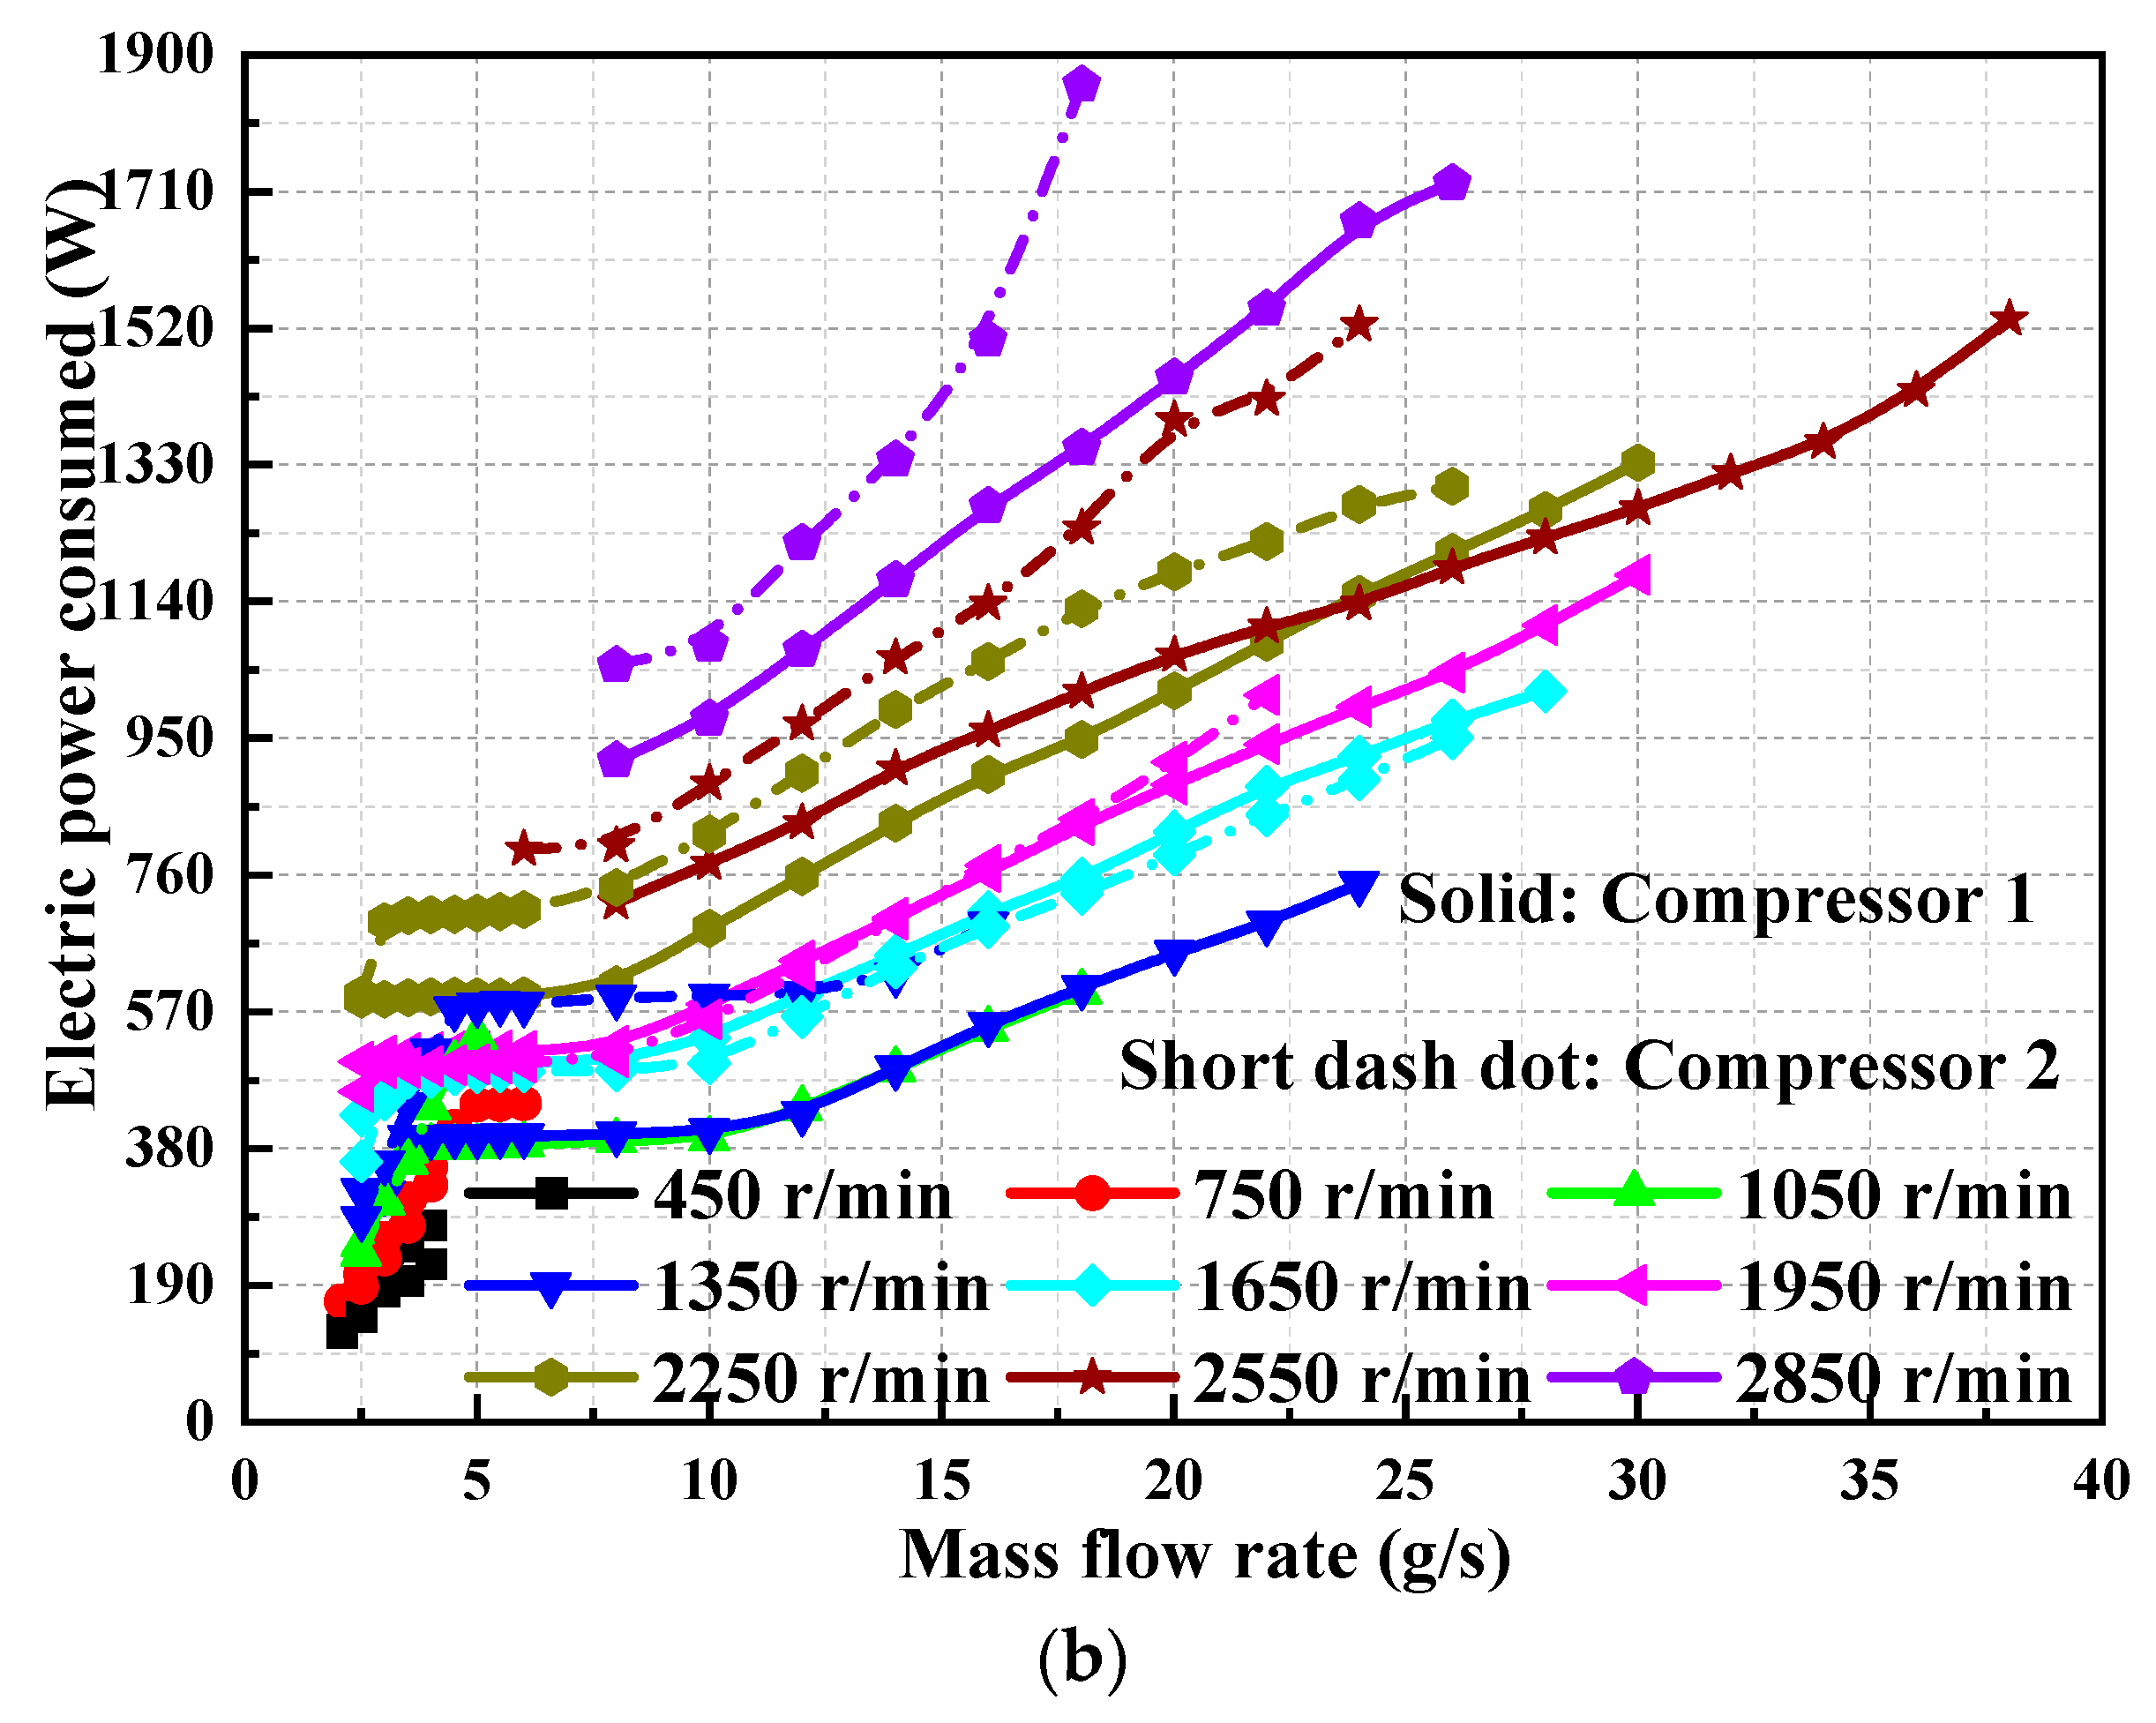
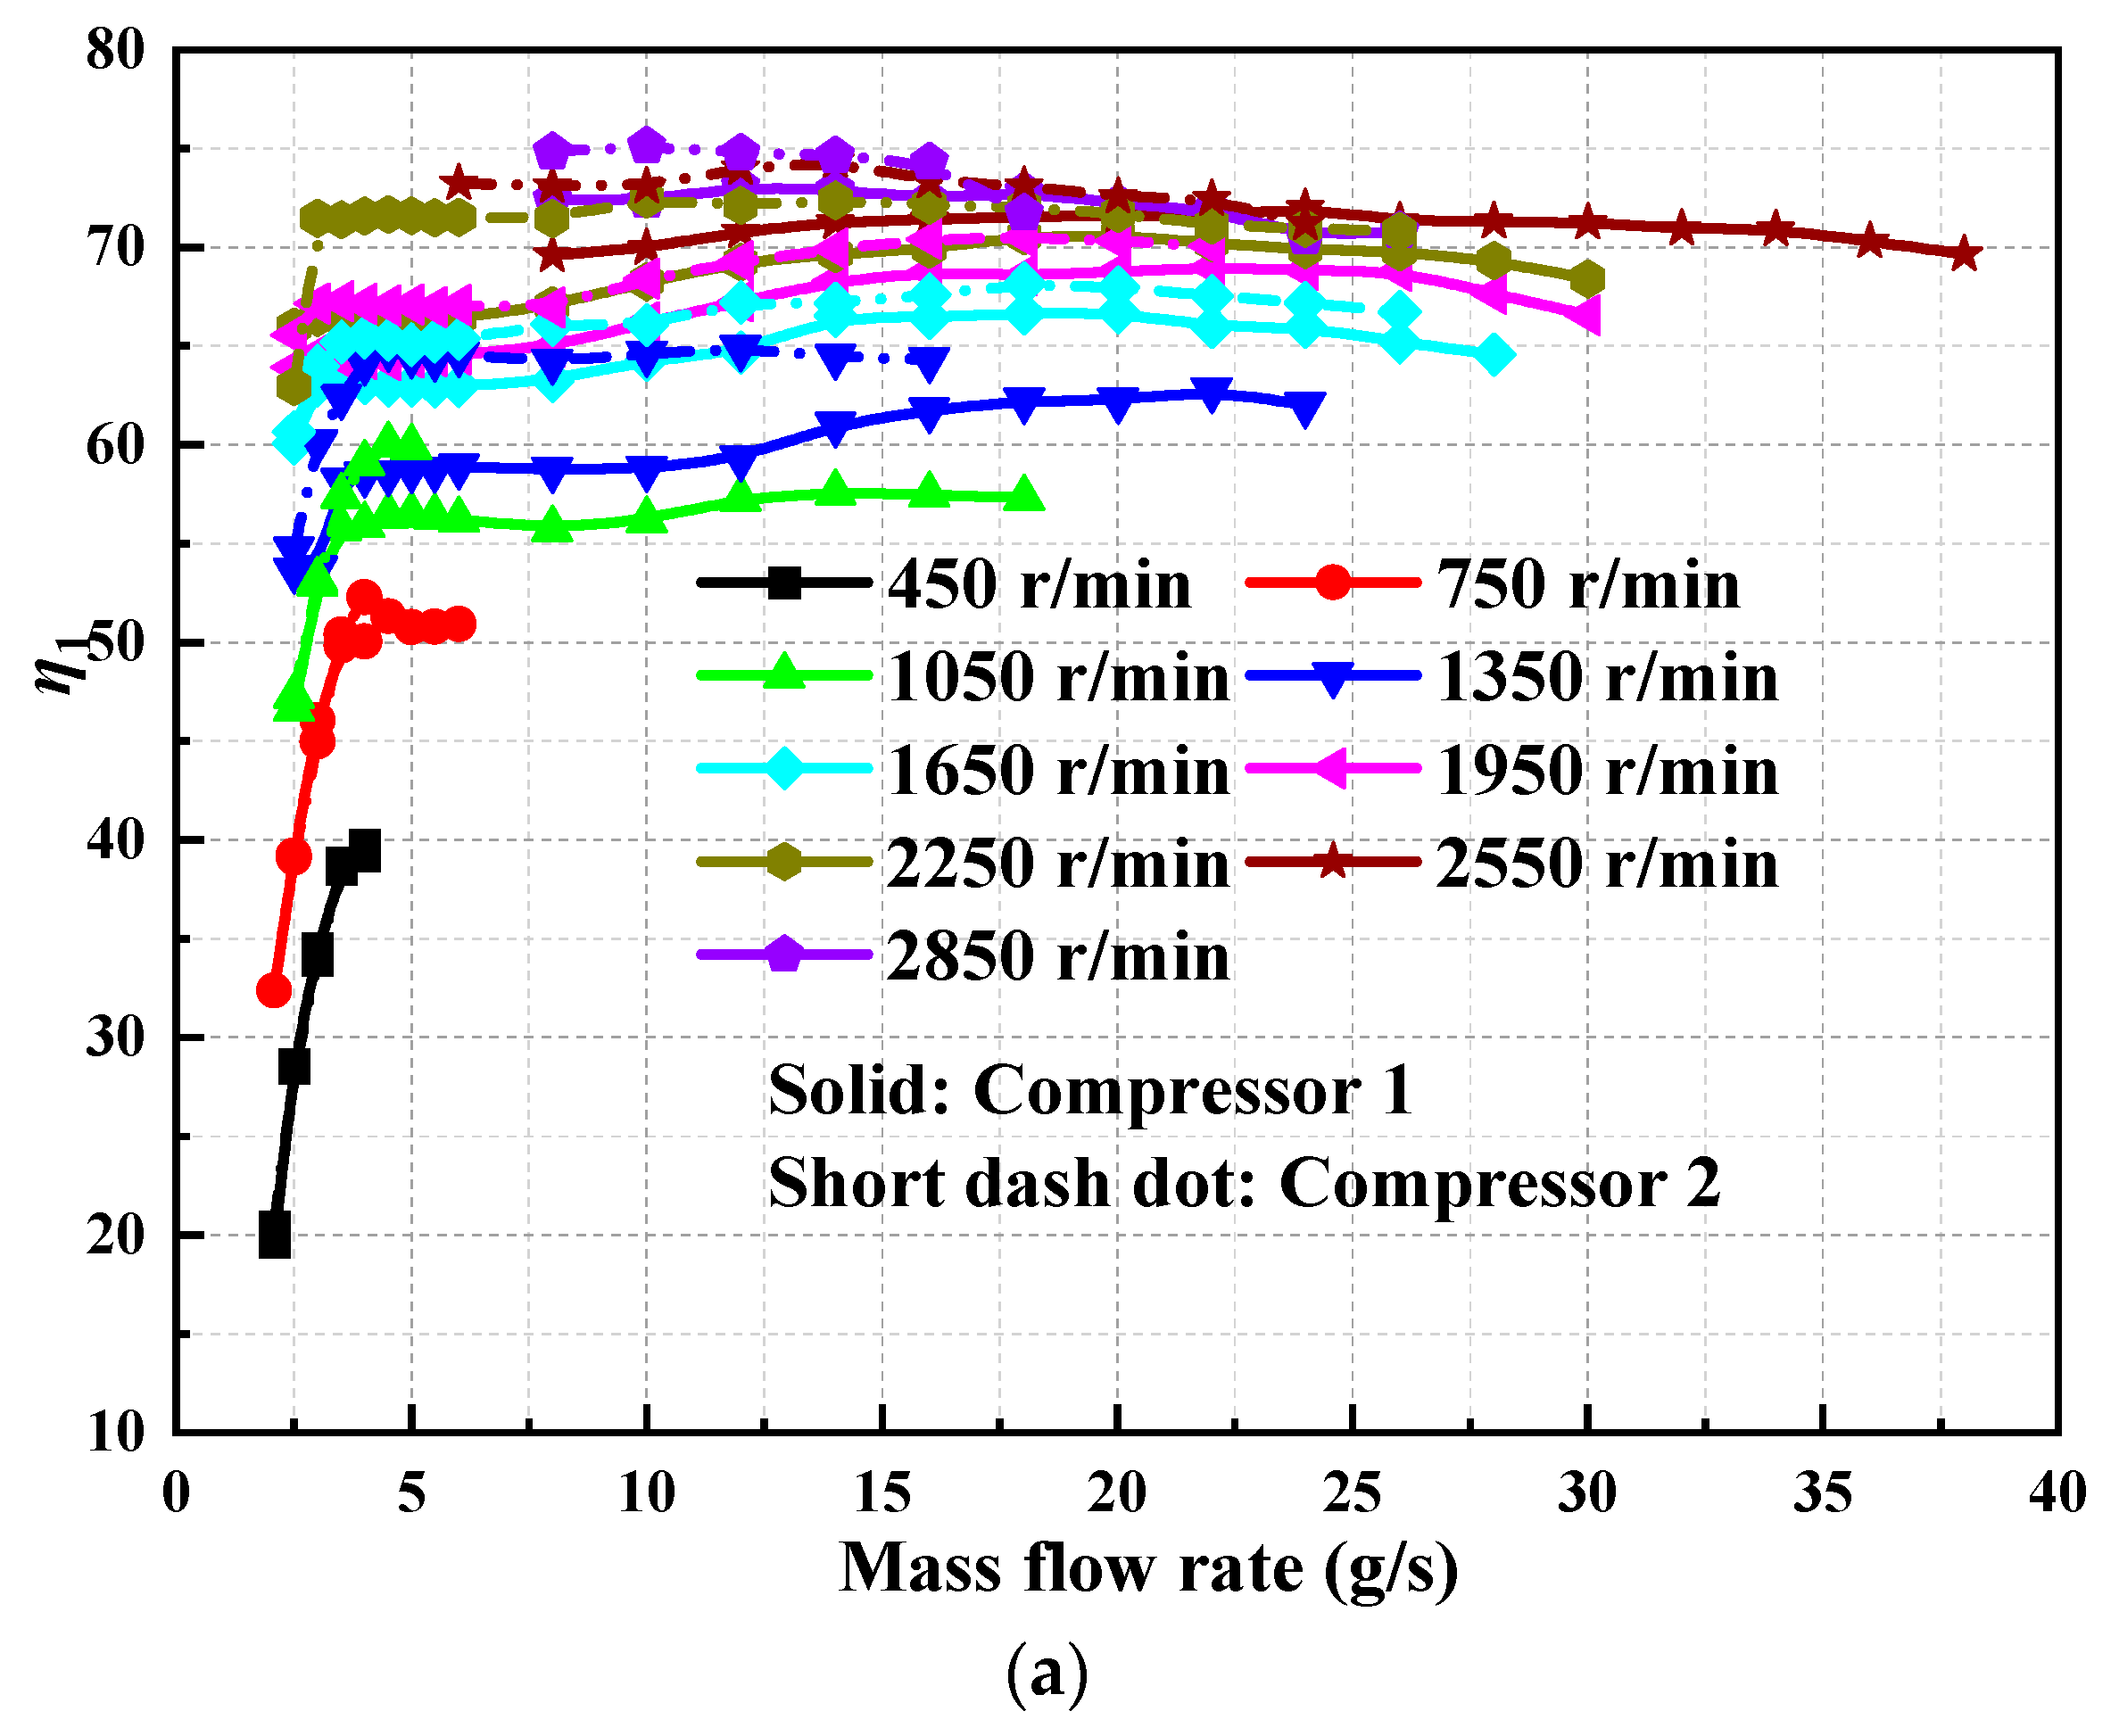
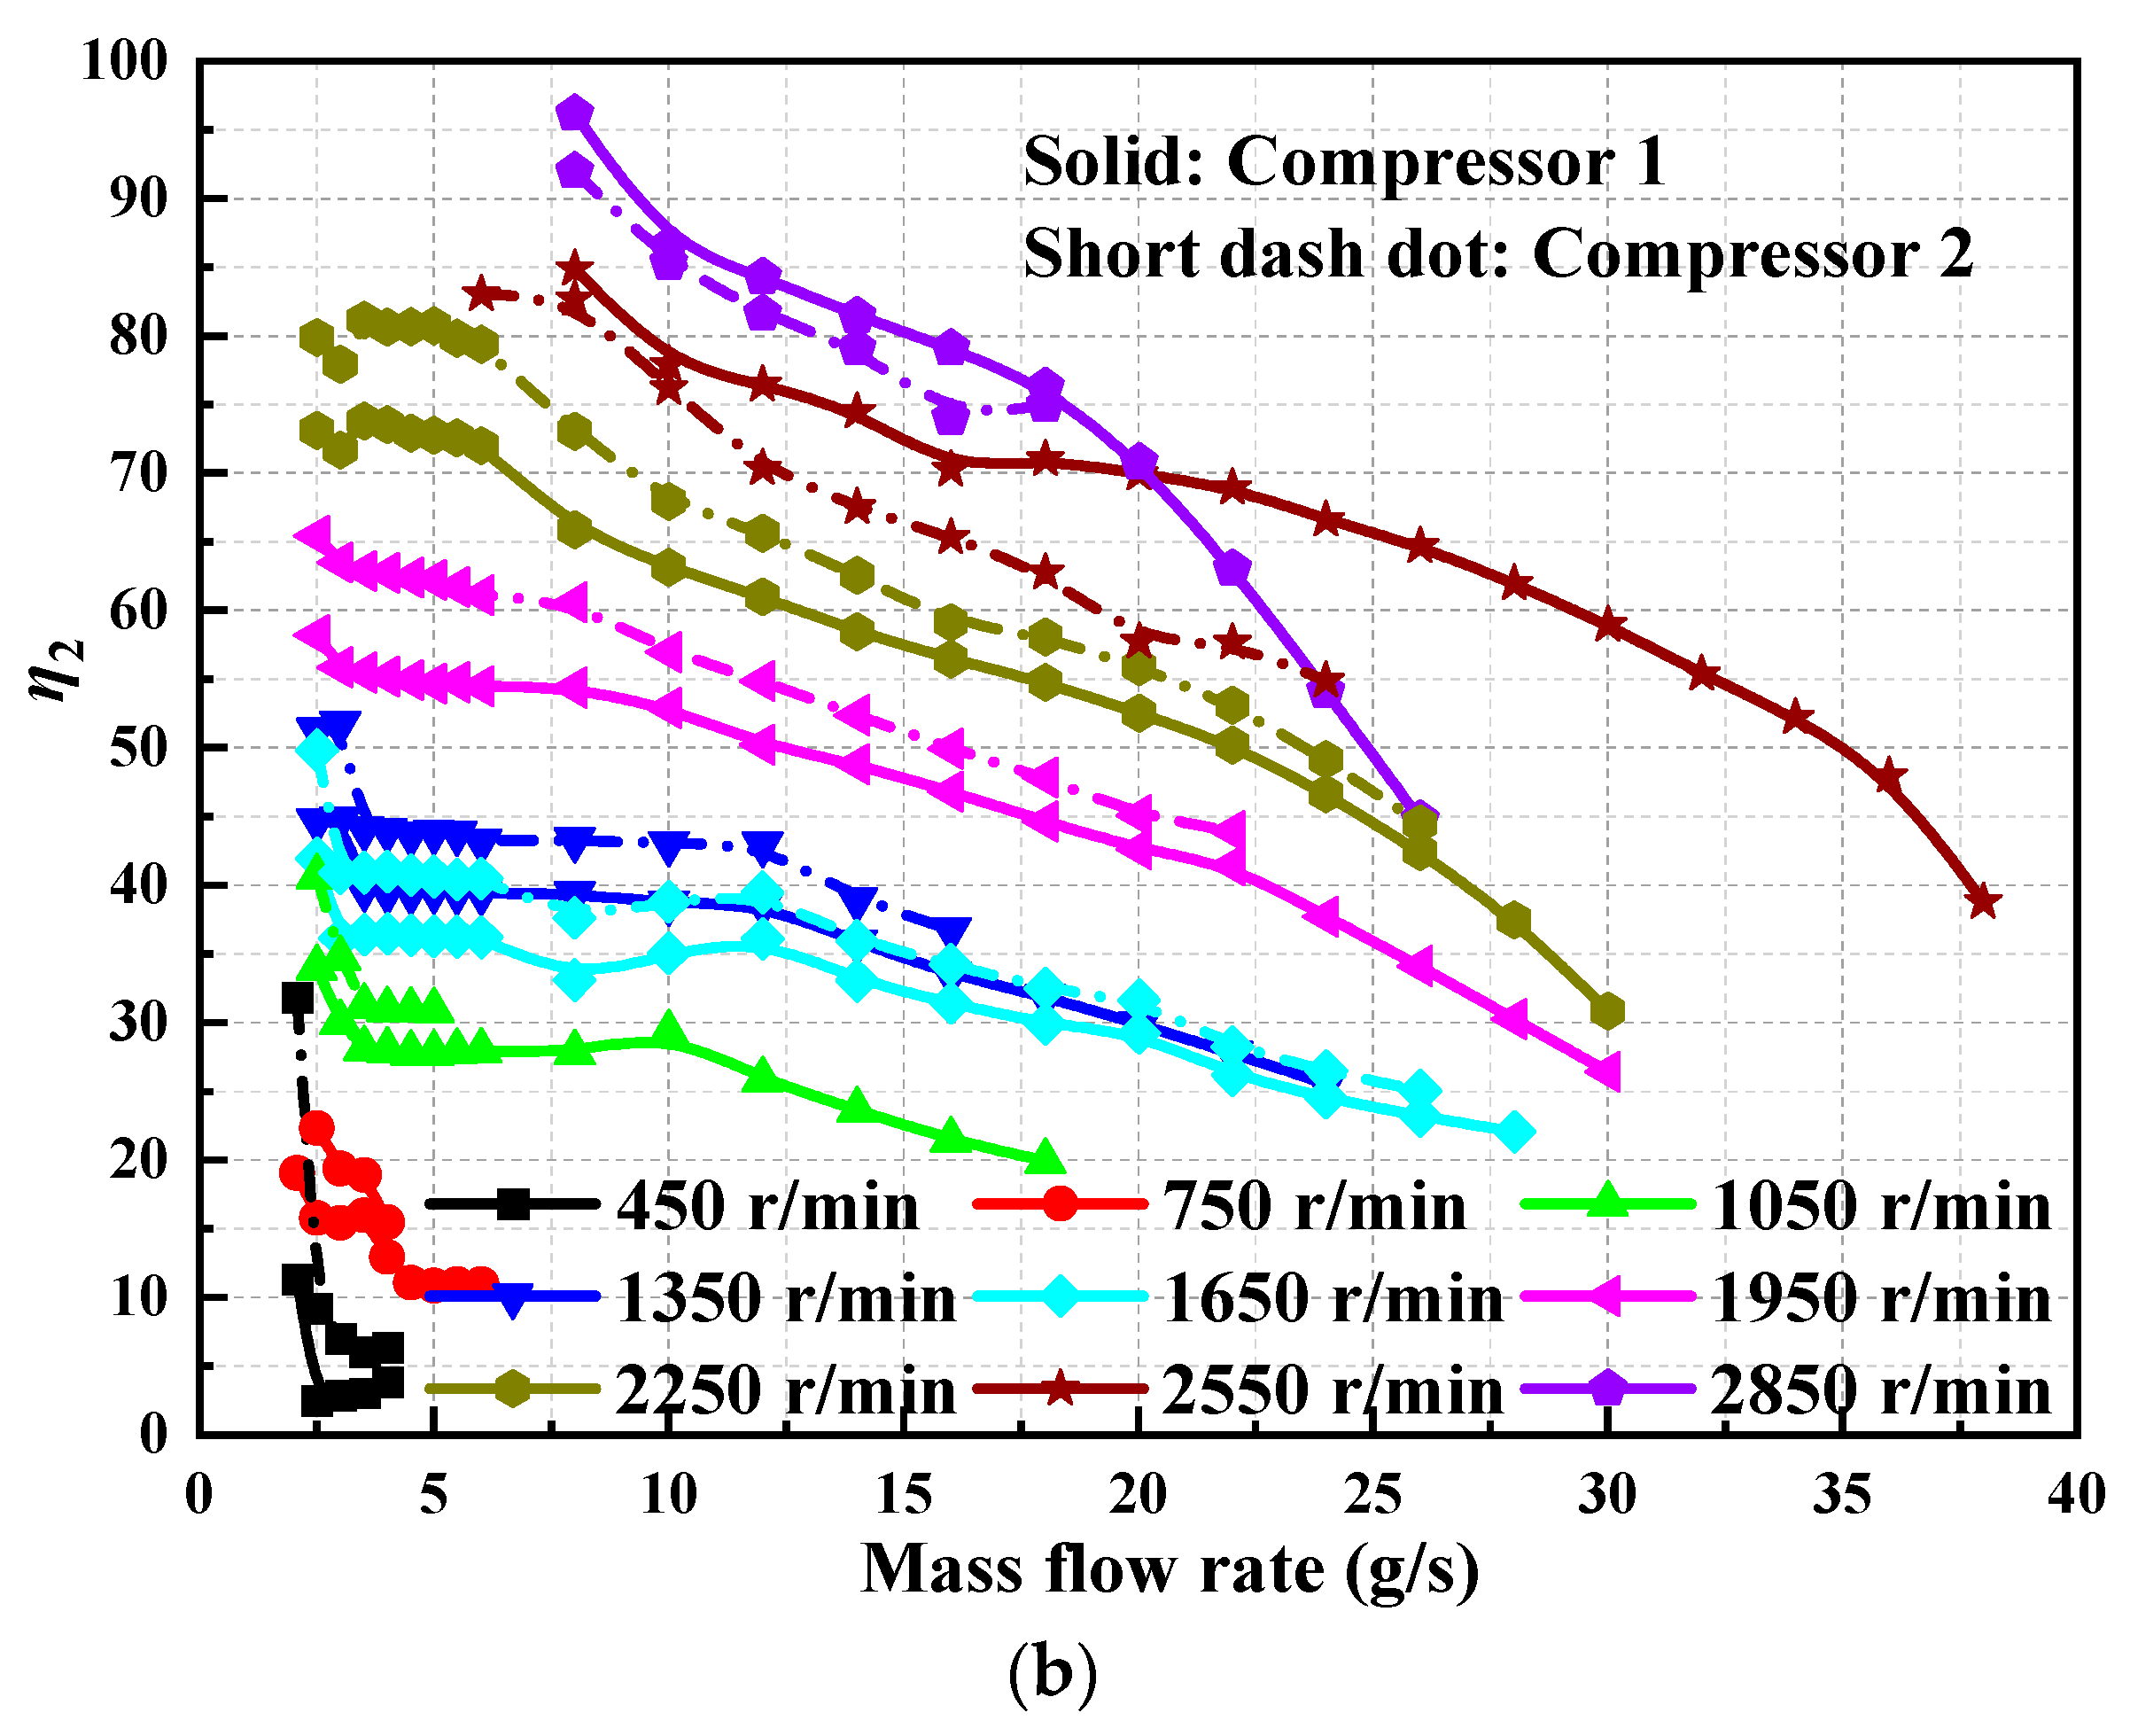
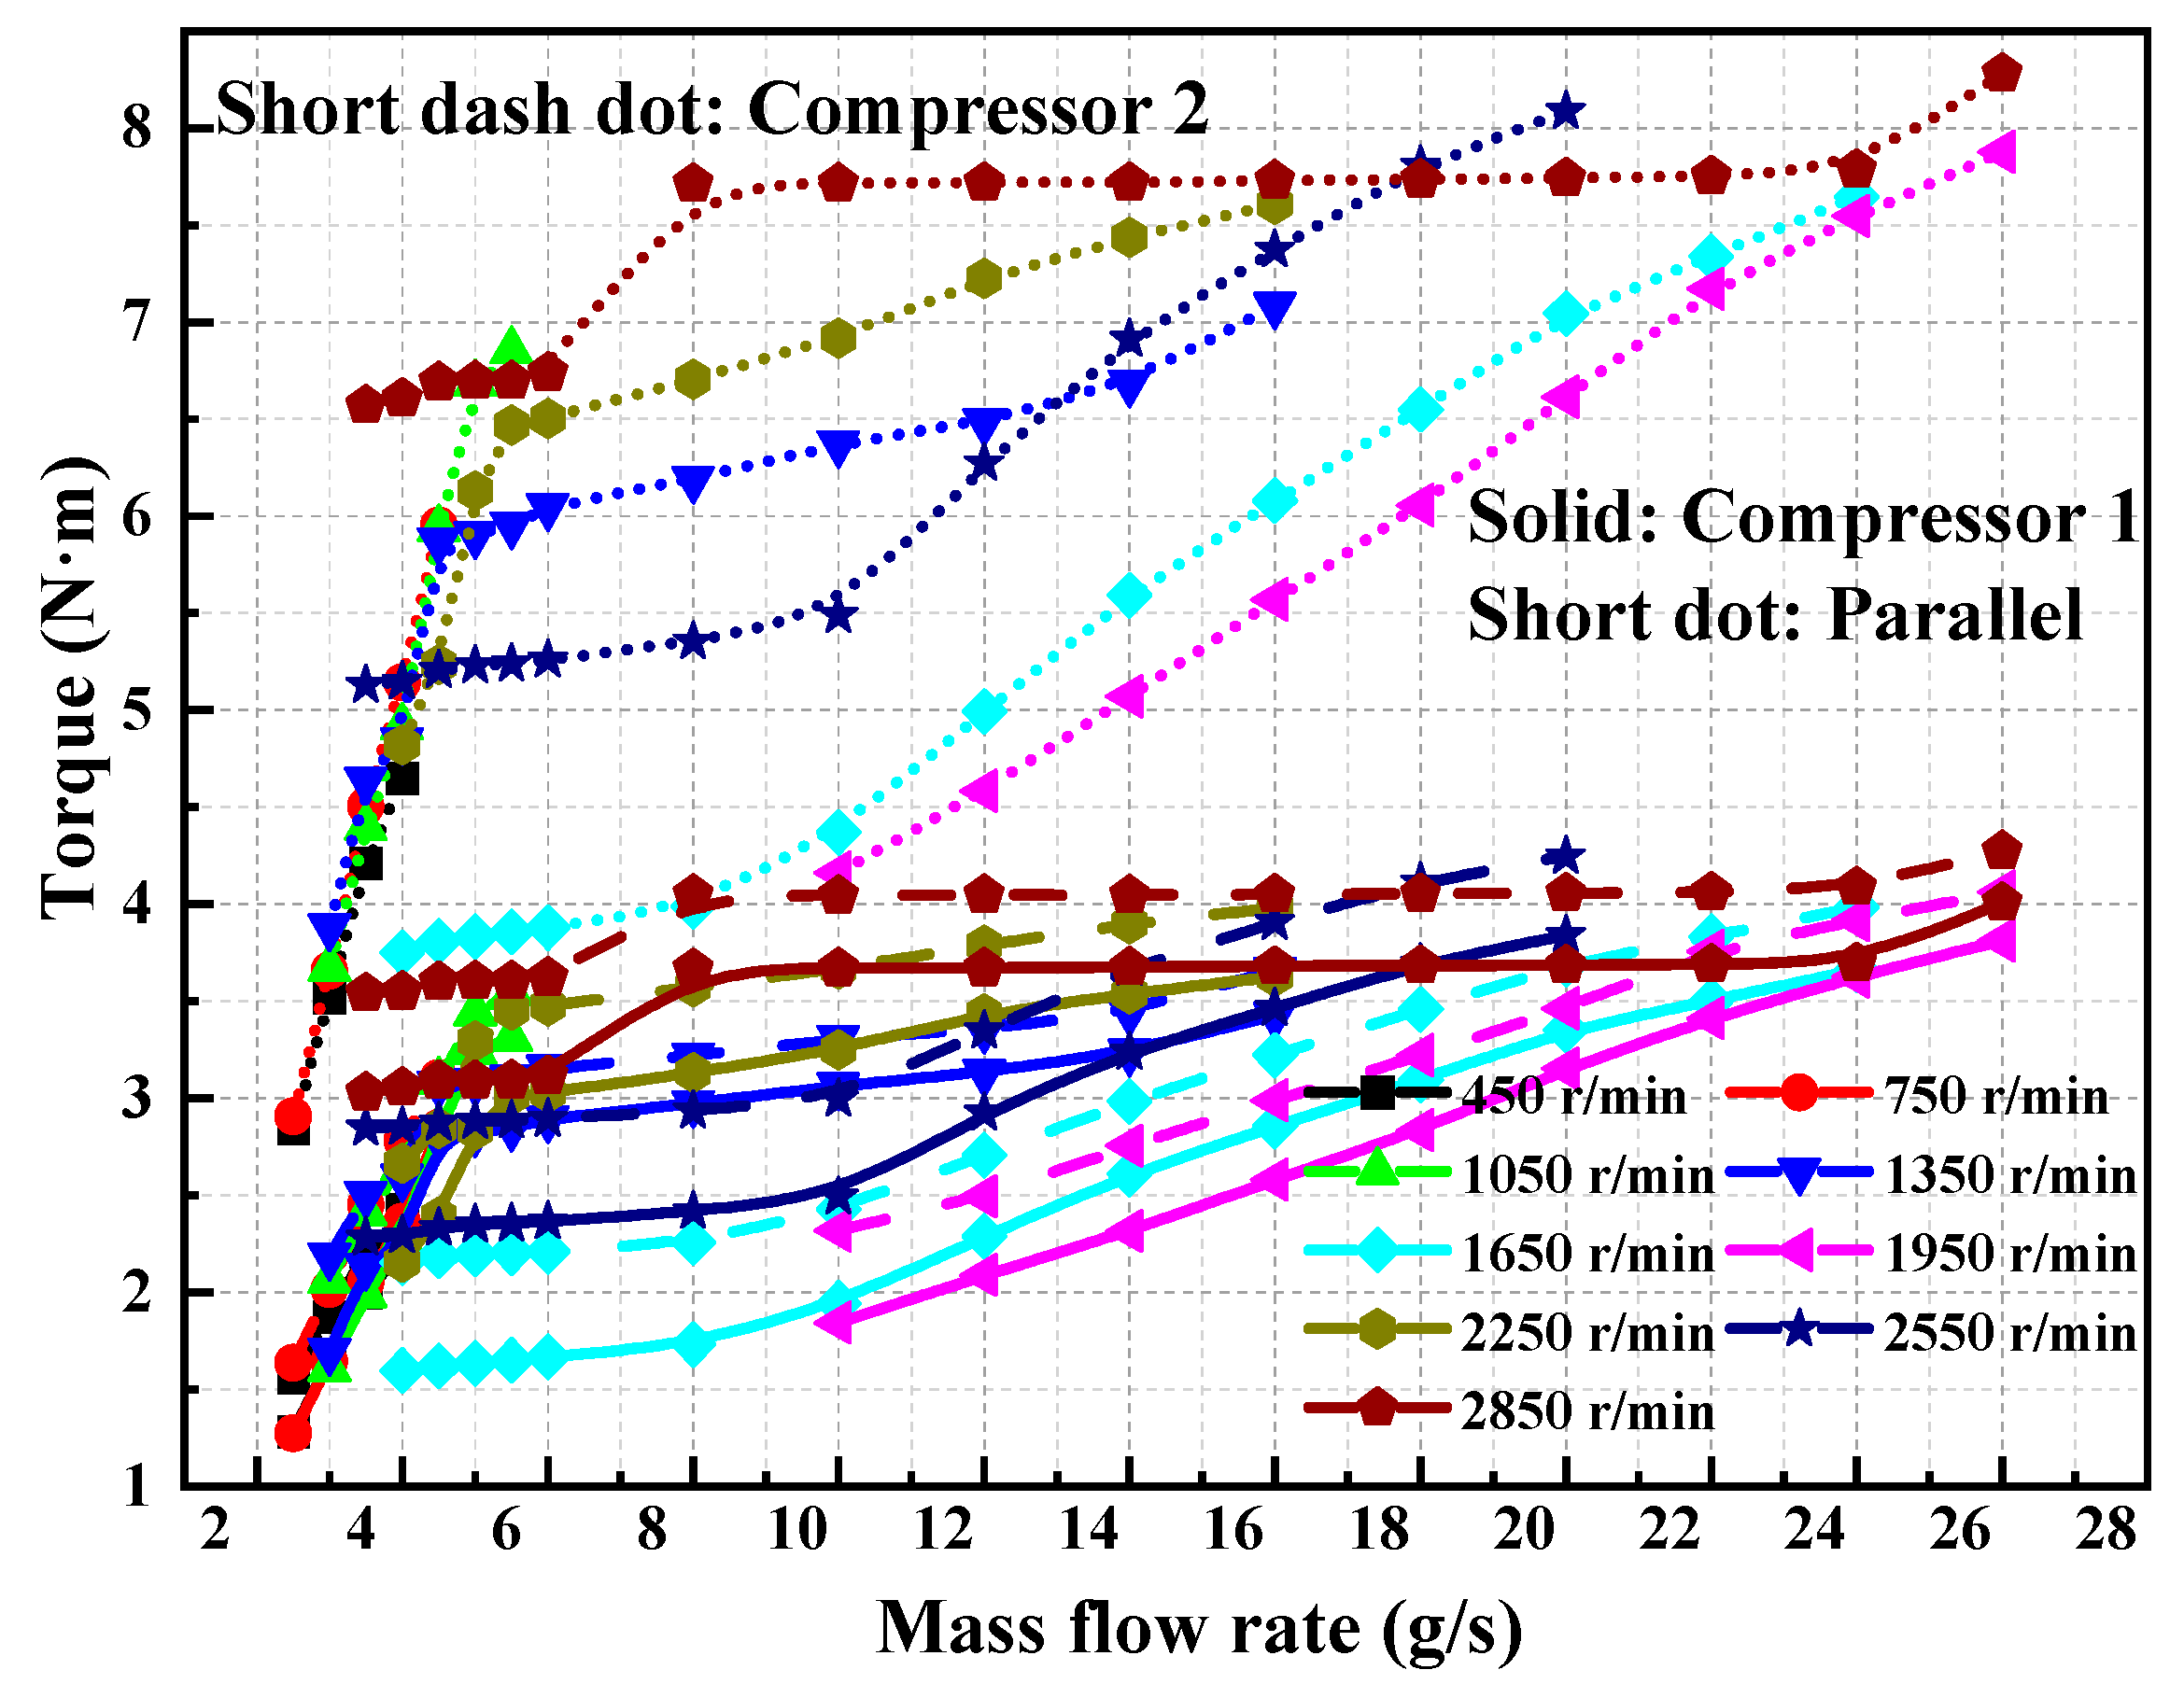
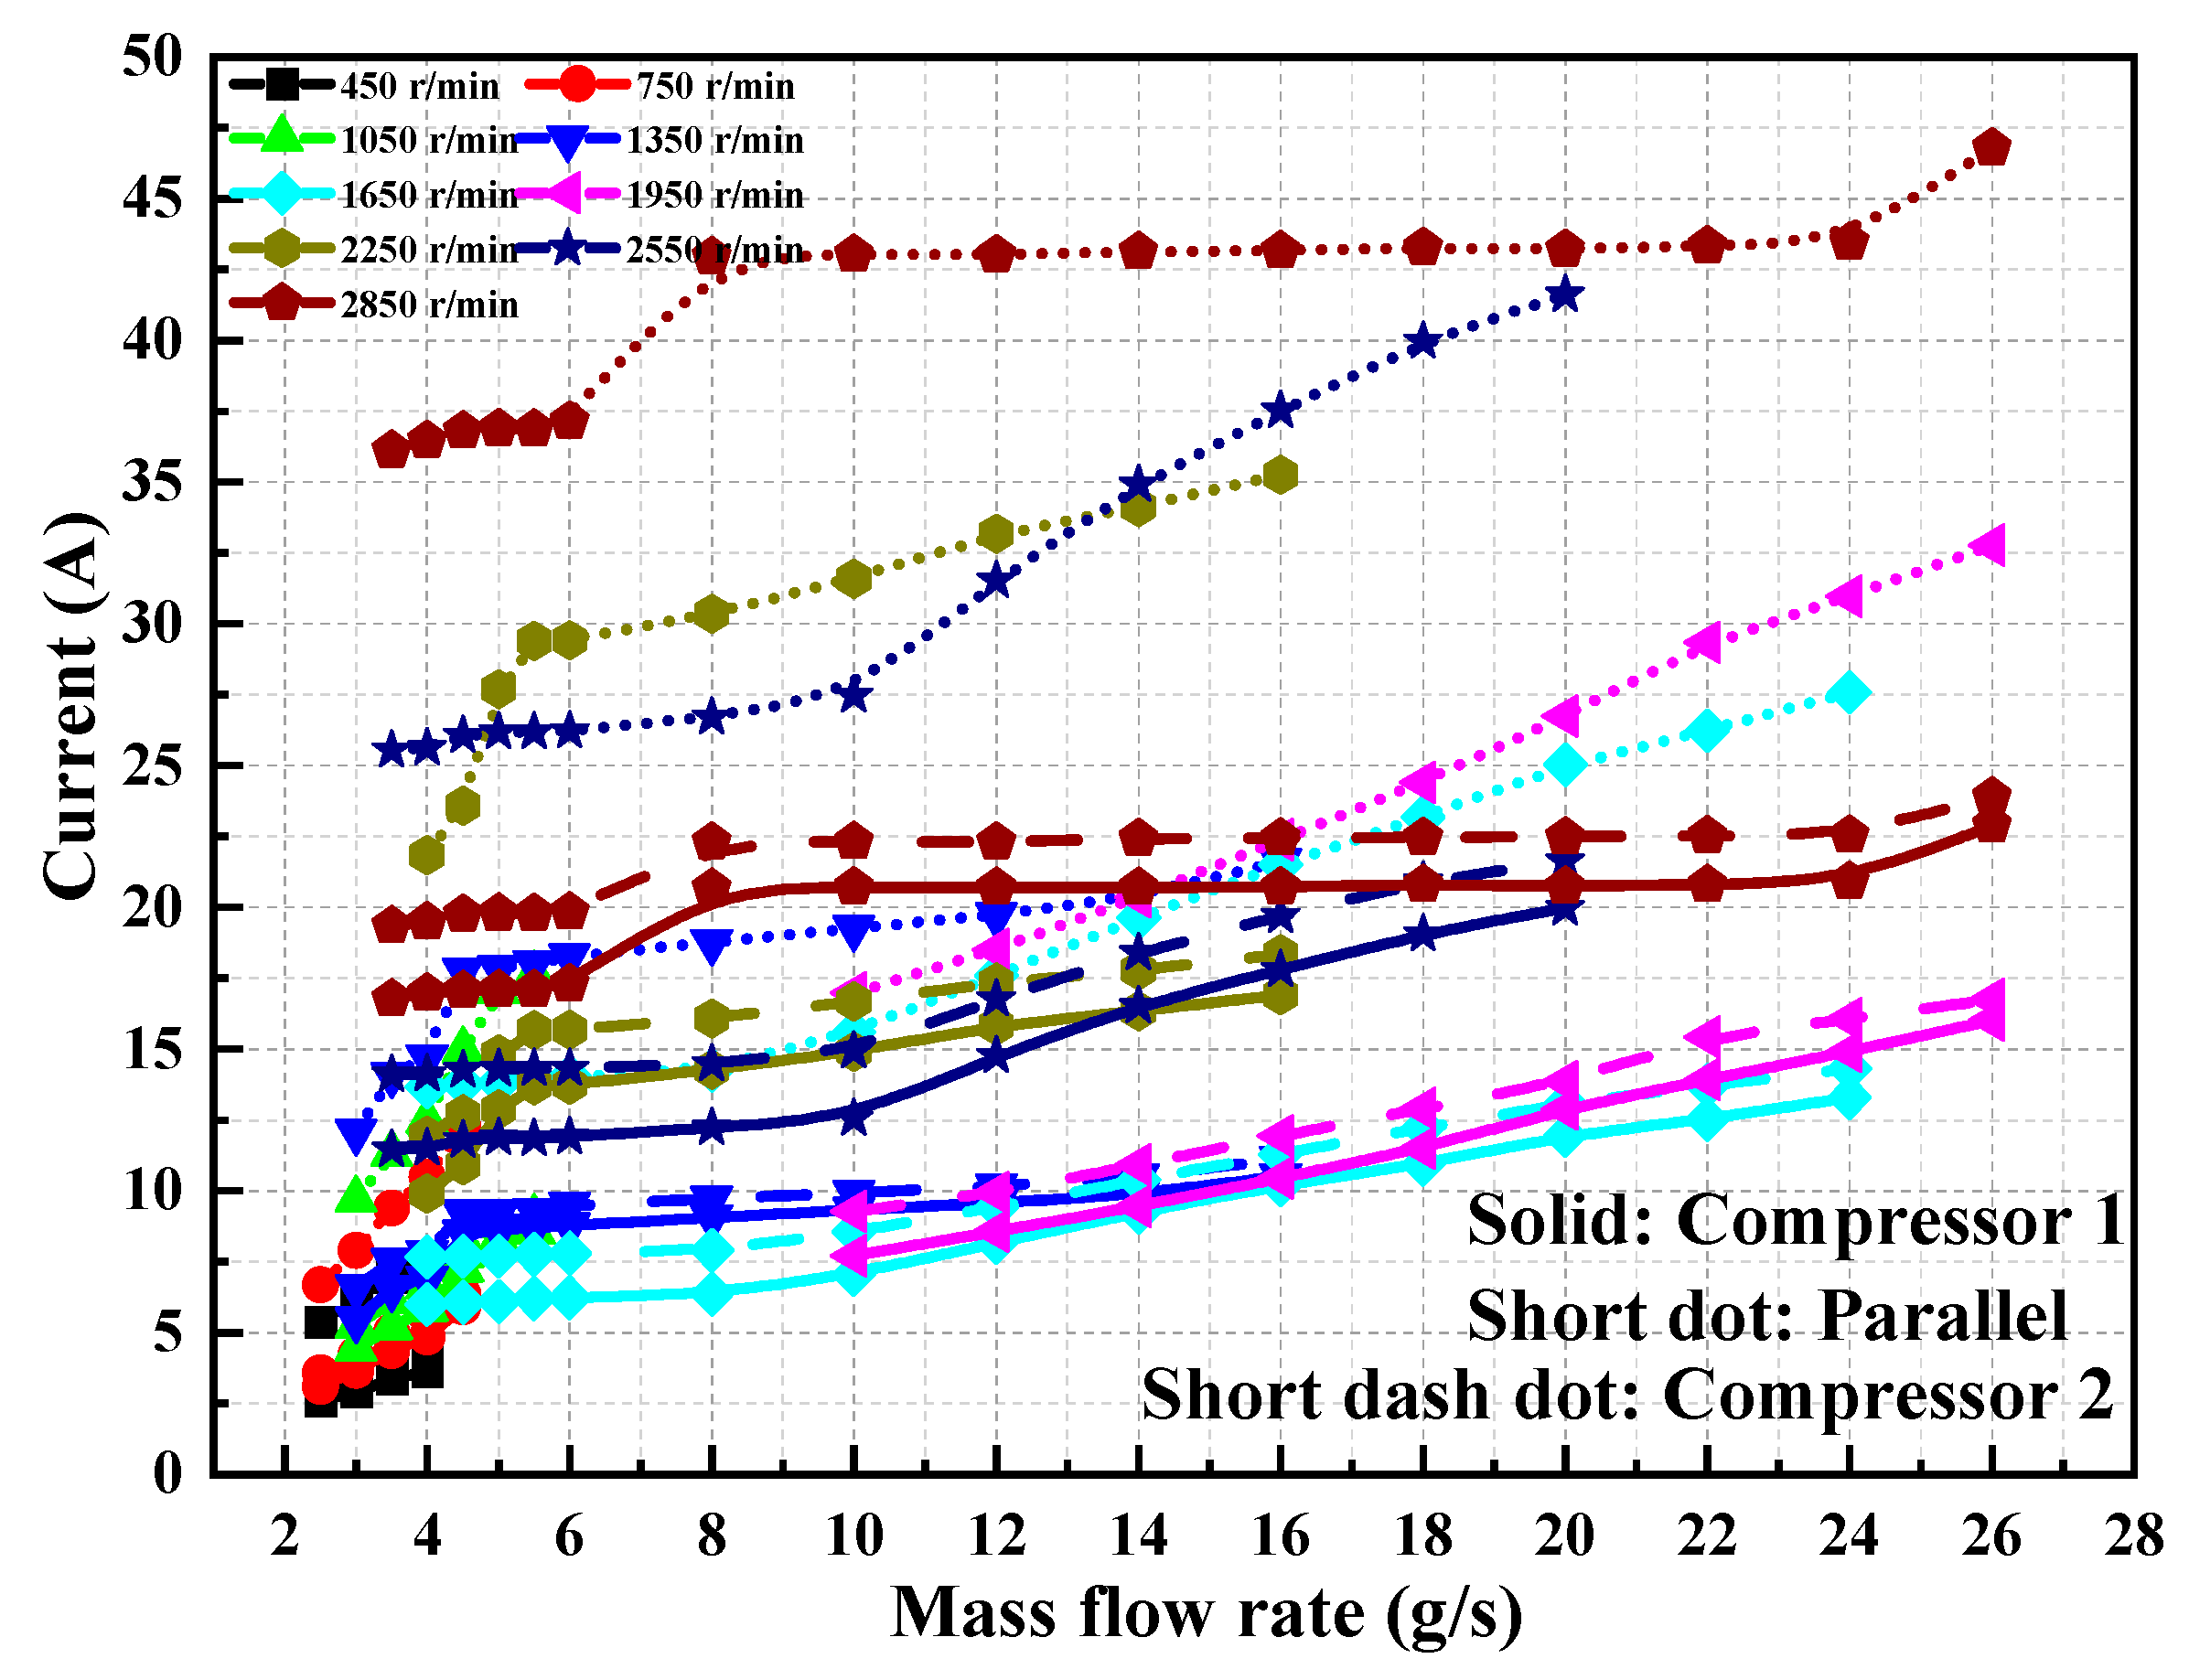
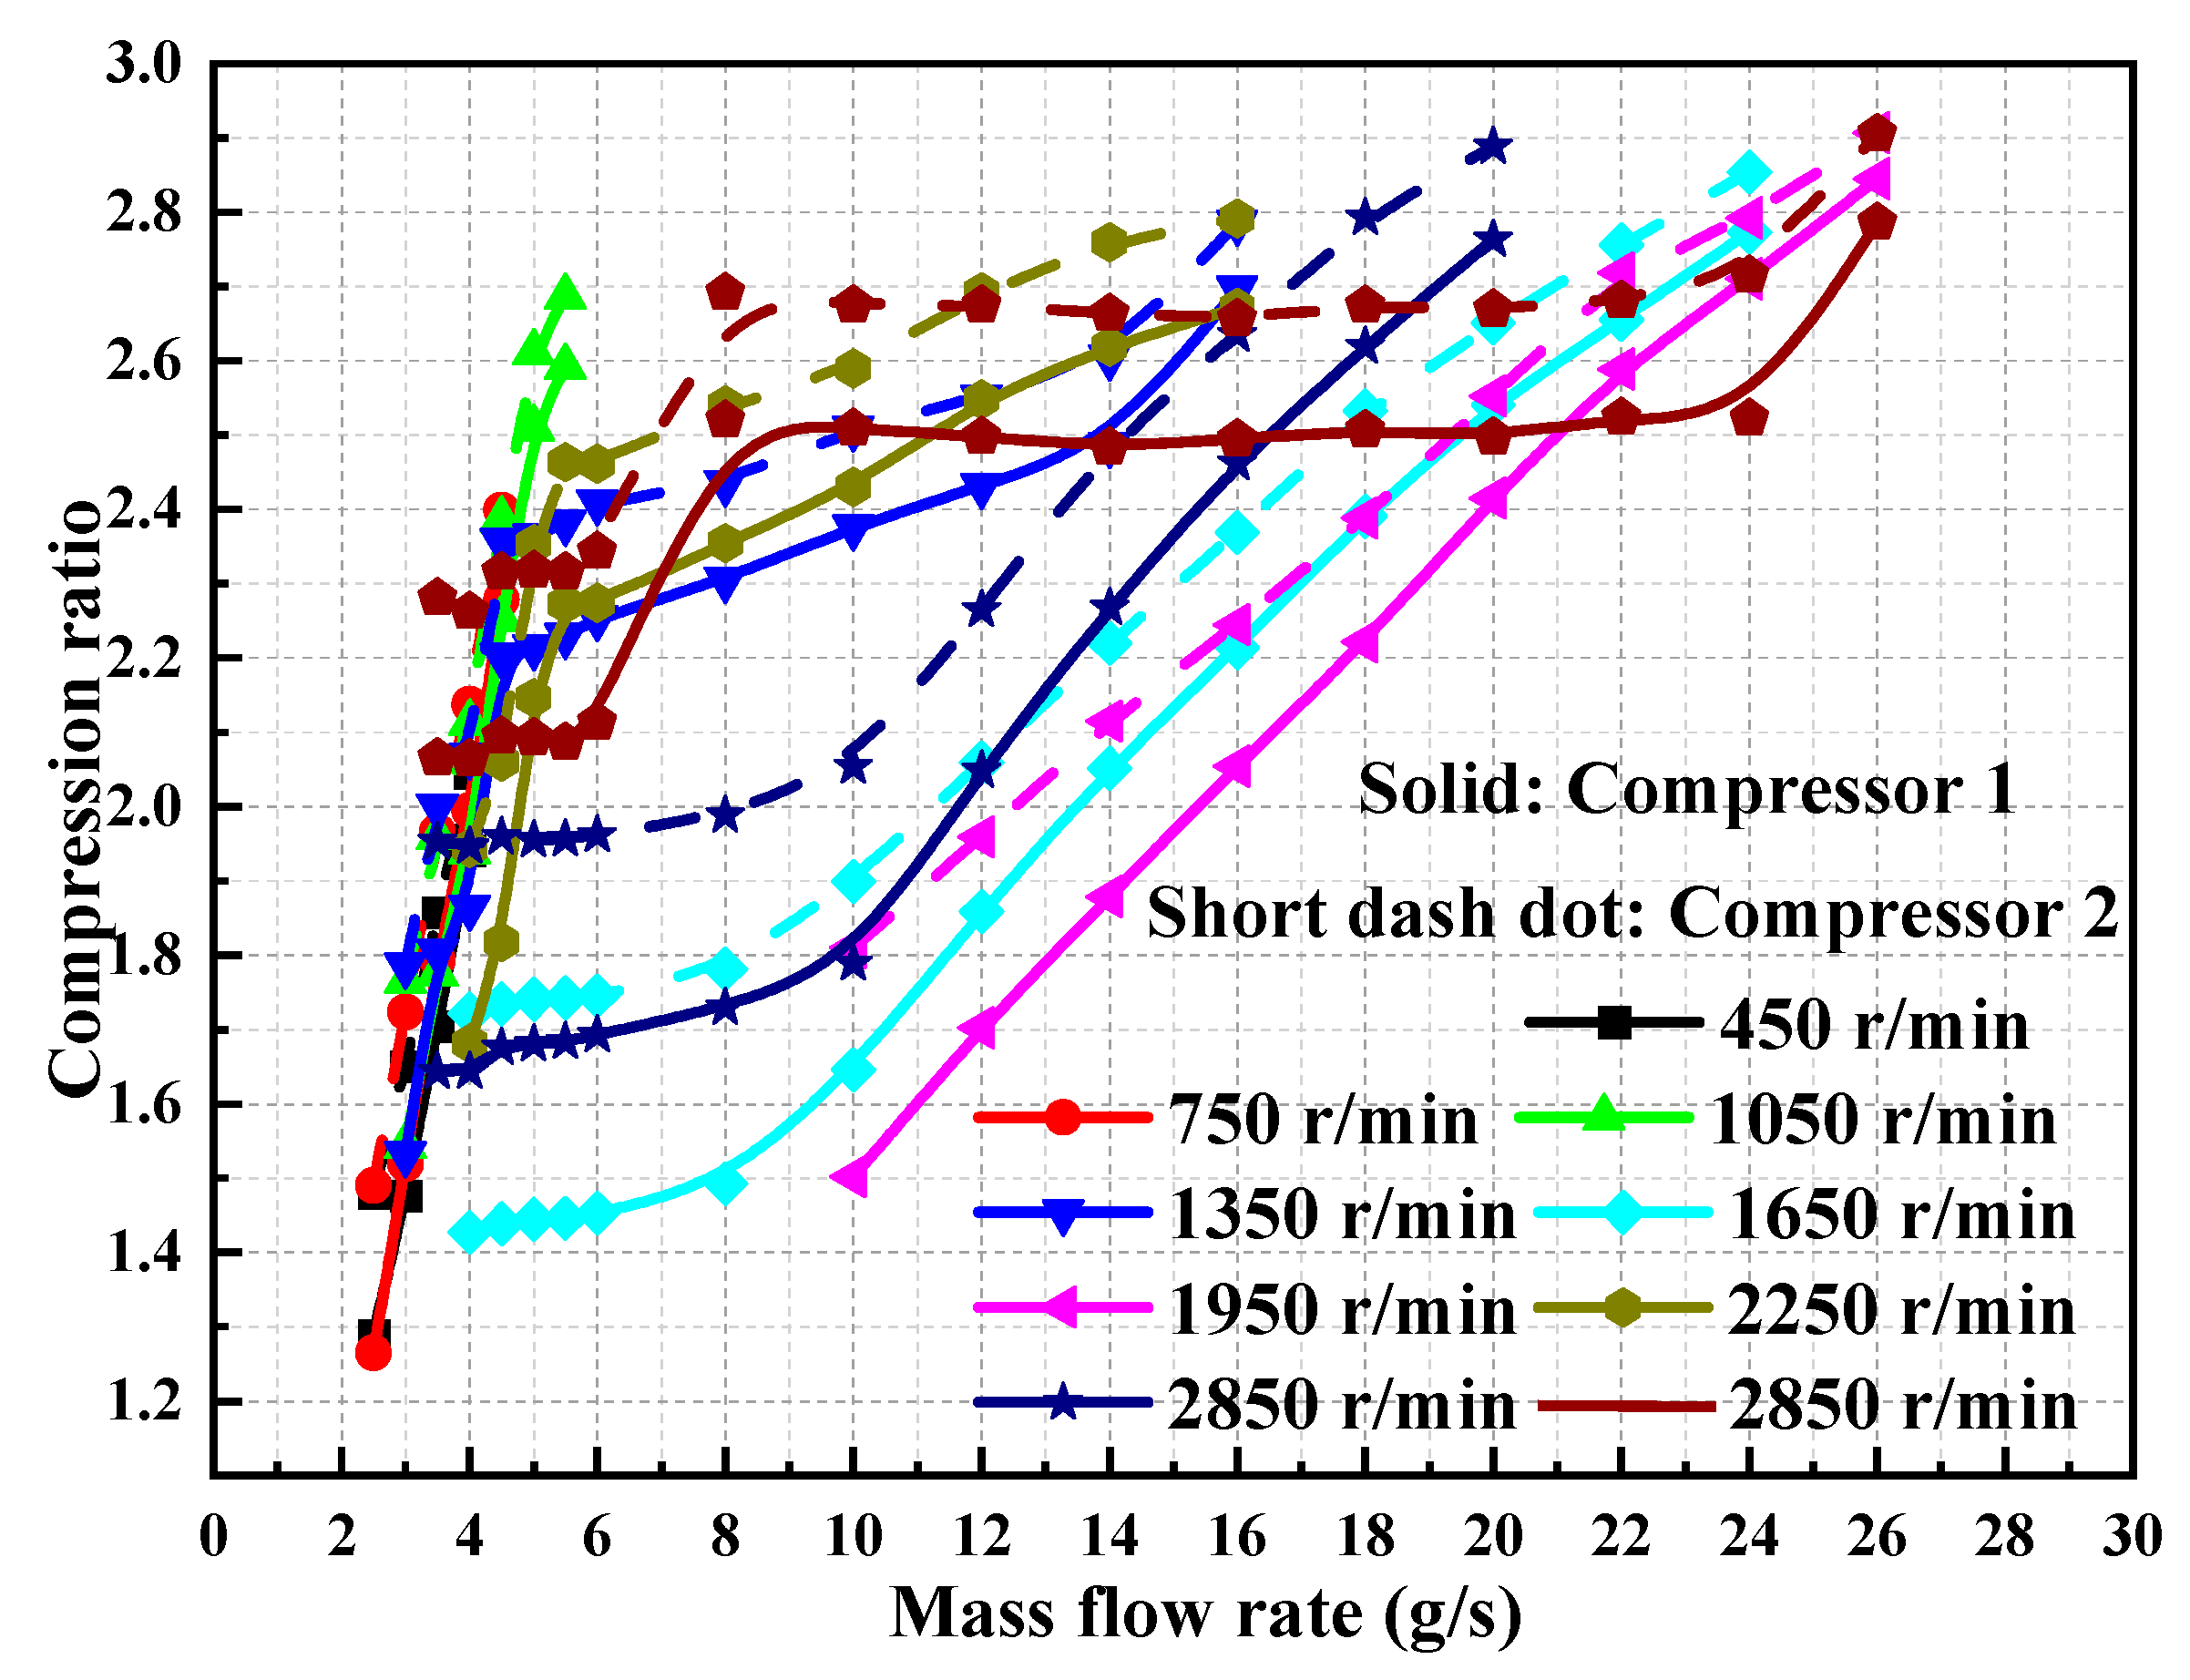
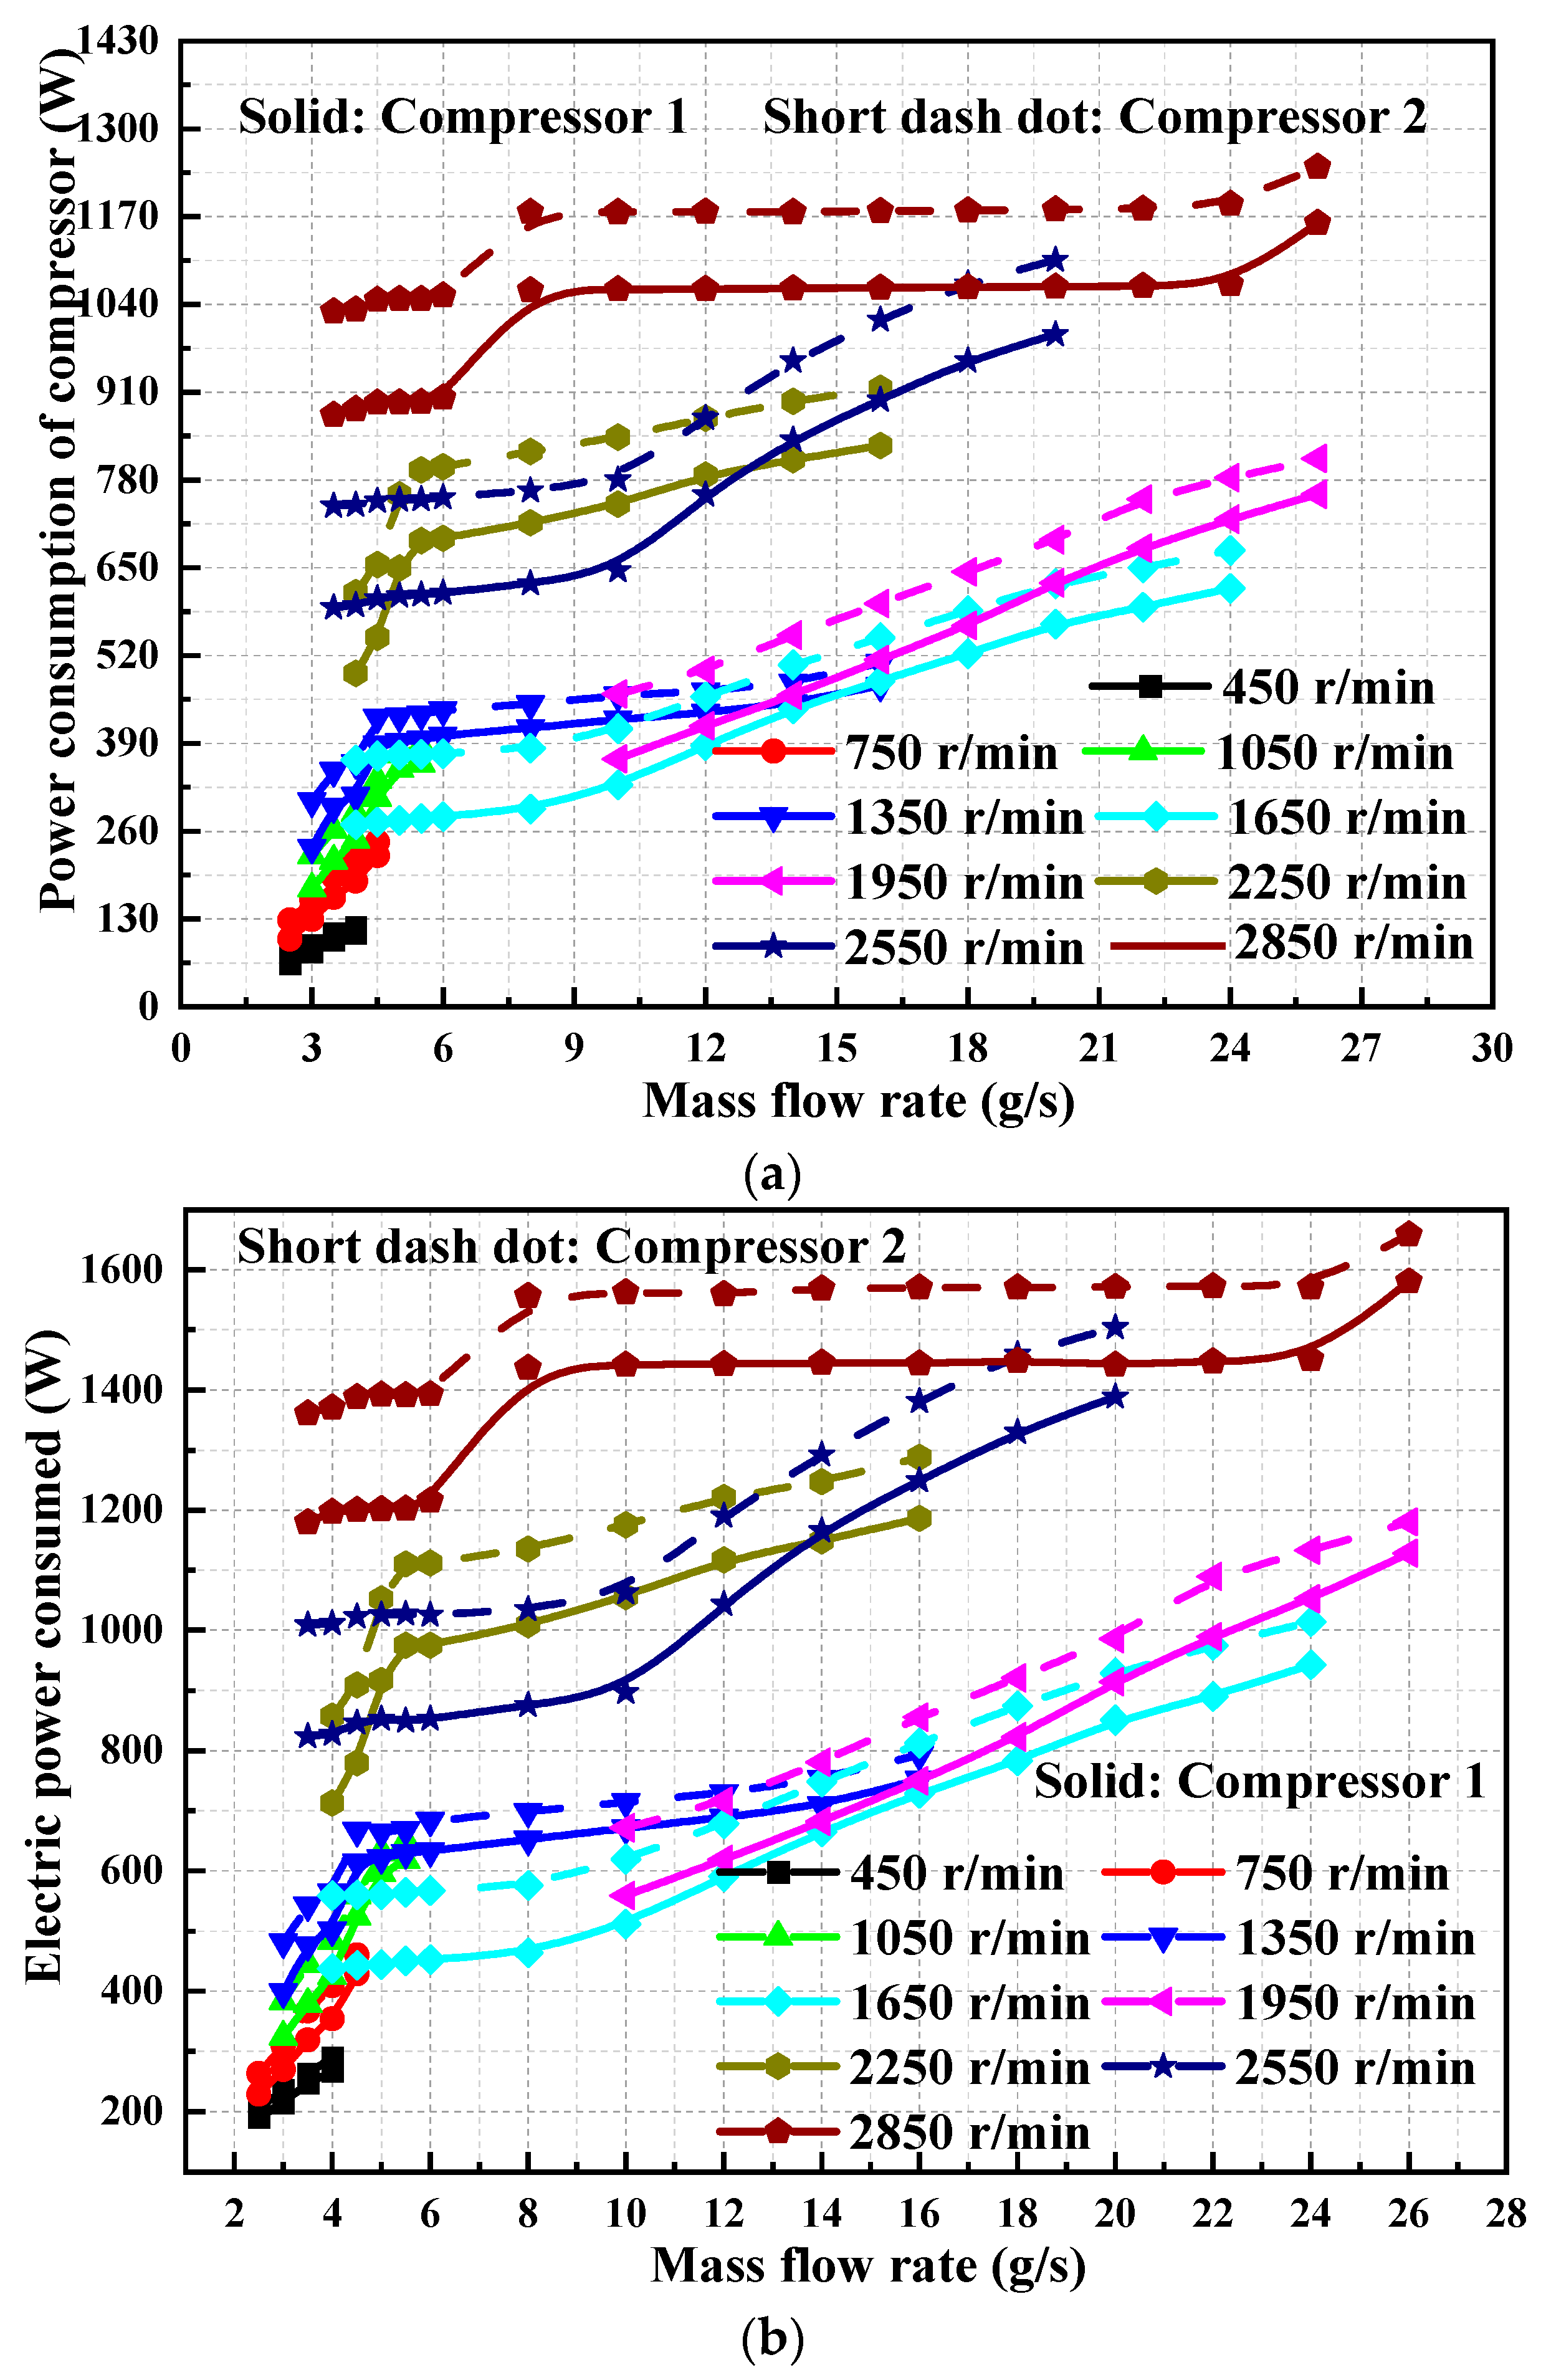
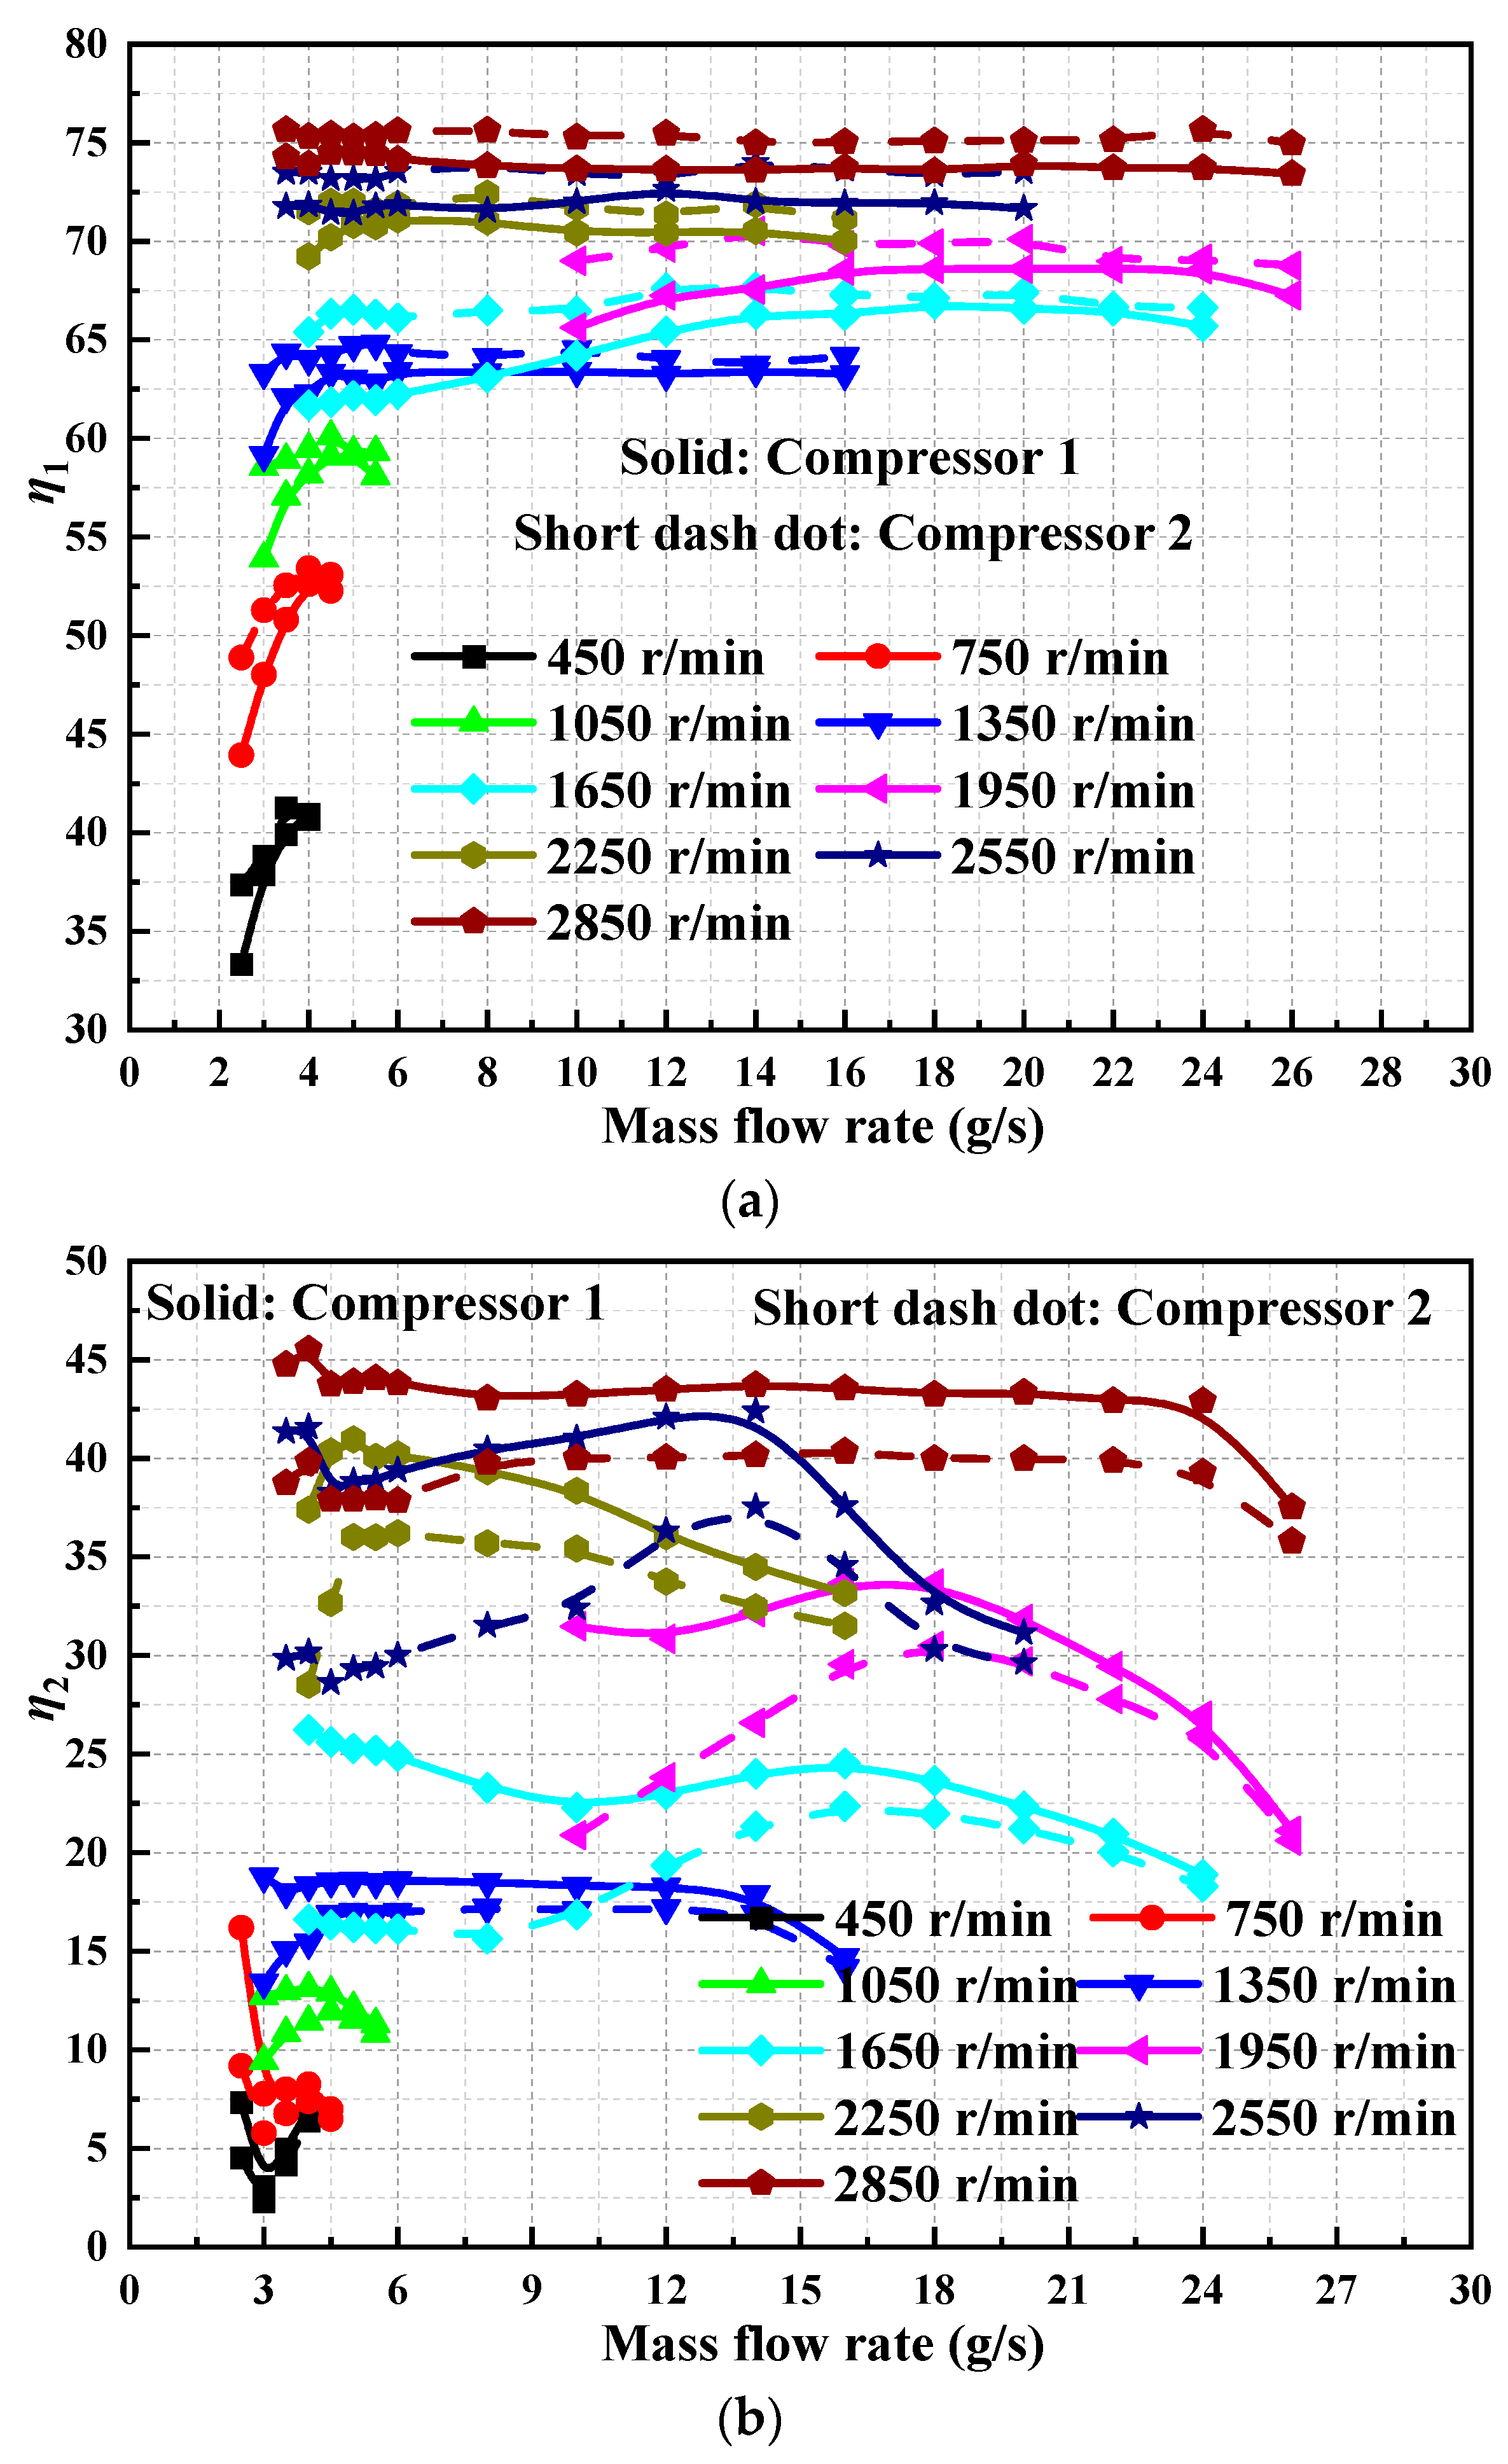
3.6. Influence of Mass Flow Rate on the Performance of the Compressor in Parallel Mode

In Figure 26, solid and dash-do lines display the changing of torque with a mass flow rate in parallel mode. It can be seen from the figure that torque increases with the increase in mass flow rate and rotational speeds. The torque value corresponding to compressor 2 is greater than that corresponding to compressor 1 at different rotational speeds and mass flow rates. In parallel mode, mass flow could affect apparently. The highest rotation speed reached the platform at a mass flow rate of 8 g/s, which means higher torque could obtain a smaller mass flow rate. In parallel mode, the operating range has changed outstanding in large rotation speed and vice versa. The parallel ranges are from 6.57 N·m to 8.28 N·m, from 5.12 N·m to 8.08 N·m, and from 4.81 N·m to 7.60 N·m, corresponding to 2850 r/min, 2550 r/min, 2250 r/min. However, single mode in all rotation speeds would be below 4.5 N·m, and high rotation could obtain greater mass flow rate.
Figure 27 exhibits the variation of power battery current with mass flow rate in parallel mode. When the rotational speed is low, the current increases linearly with the increase in mass flow rate and then tends to increase gently. When the rotational speed is high, the current first shows a gentle growth trend with the increase in mass flow rate, then shows a linear growth trend, and finally tends to slowly increase to the maximum value. In addition, the current value corresponding to compressor 2 is greater than that corresponding to compressor 1 at different rotational speeds and mass flow rates. In parallel mode, the current is higher than single mode and the tendency is inherited from single mode.
Figure 28 shows the variation trend of the pressure ratio with mass flow rate in parallel mode. When the rotational speed and mass flow rate are low, the pressure ratio increases linearly with the mass flow rate. In addition, the pressure ratio corresponding to compressor 2 is greater than that corresponding to compressor 1 at different rotational speeds and mass flow rates.
Figure 29a shows the variation of compressor power consumption with mass flow rate in parallel mode. It is not difficult to find that the variation trend of compressor power consumption with mass flow rate is basically consistent with that of current with mass flow. In parallel mode, the power consumption of compressor 2 is greater than that of compressor 1 at different rotational speeds and mass flow rates.
Figure 29b shows the variation of battery power output with mass flow rate in parallel mode. The variation trend of battery power output with mass flow rate is basically consistent with that of compressor power consumption with mass flow rate. Similarly, in parallel mode, the battery power output corresponding to compressor 2 is greater than that corresponding to compressor 1.
Figure 30a shows the variation of η1 with mass flow rate in parallel mode. When the rotational speed is low, η1 increases linearly with the increase in mass flow rate. When the rotational speed is high, the variation of η1 with mass flow rate is relatively gentle. In parallel mode, the η1 of compressor 2 is greater than that of compressor 1. In parallel mode, lower rotation speeds have great DC/AC conversion efficiency such as at 450 r/min, 750 r/min, and 1050 r/min.
Figure 30b displays the variation of η2 with a mass flow rate in parallel mode. With the increase in mass flow rate, η2 shows a gradual variation trend first and then a downward trend. At different rotational speeds and mass flow rates, the corresponding η2 of compressor 2 is greater than that of compressor 1. In parallel mode, isotropic efficiency is not a downtrend compared to single mode. This curve would reach a peak in large rotation speed, such as 1650 r/min, 1950 r/min, 2250 r/min, and 2550 r/min. It is better for the compressor to operate at high efficiency.
In parallel mode, the compressor operation range will be wider, with torque and current being able to increase twice as much than in single mode. It could be beneficial for the small-scale CAES system to choose an appropriate scheme. Meanwhile, isotropic efficiency has a significant improvement from a downtrend in single mode to a bell curve in parallel mode. It could make the CAES system work with high efficiency.

3.7. Uncertainty Analysis

In accordance with the theory of error propagation, the square root method is used to calculate the uncertainty [36], which can be written as
Δ Y = i n ( Y X i Δ X i ) 2
where ΔY is the absolute uncertainty of the variable Y and ΔXi is the absolute uncertainty of the measured variable.
The relative uncertainty of the variable can be written as [37]
δ Y = Δ Y Y
In order to estimate the error related to the experimental data, uncertainty analysis is required. Table 1 lists the estimated uncertainty of different instruments. Table 3 lists the absolute and relative uncertainties of power outputs and efficiencies of the compressor and generator.

4. Summary and Conclusions

Based on the pneumatic motor, this study designed an experimental bench of the CAES system, which integrates compression and expansion functions. The parallel operation mode of the compressor was proposed to improve the working condition range of the compressor. The main conclusions are as follows:
(1)
The torque, pressure ratio, and power consumption of the compressor increase linearly with the increase in the air tank pressure. The maximum value of power consumption is approximately 1233.1 W.
(2)
With the increase in mass flow rate, the pressure ratio and power consumption first present a linear increasing trend, then tends to be flat, and finally shows an increasing trend again.
(3)
Parallel mode could extend the current and torque working conditions almost twice as much as single mode.
(4)
In parallel mode, DC/AC conversion efficiency and isotropic efficiency have improved significantly. The isotropic efficiency curve has a bell shape with a wide peak.
We should focus on different compressor performances for the CAES system, such as the scroll compressor, wobble plate compressor, piston compressor, and rotary compressor, and try to reveal the most influential parameters for the CAES system.

Author Contributions

H.Y.: conceptualization, methodology, experiment, investigation, software, validation, writing—original draft. Y.X.: experiment, writing—review and editing. H.Z.: conceptualization, investigation, methodology, validation, supervision. J.Z.: conceptualization, methodology, software, validation, supervision. F.Y.: investigation, supervision. Y.W. (Yan Wang): investigation, validation. Y.W. (Yuting Wu): resources, methodology. All authors have read and agreed to the published version of the manuscript.

Funding

This work was sponsored by the Beijing Natural Science Foundation (Grant No. 3222024).

Data Availability Statement

The data presented in this study are available upon request from the corresponding author.

Conflicts of Interest

The authors declare that they have no known competing financial interest or personal relationship that could have appeared to influence the work reported in this paper.

Nomenclature

mMass (kg)
nRotation speed (r/min)
pinIntake pressure (bar)
poutExhaust back pressure (bar)
PcPower consumption of compressor (W)
PtPower output of battery (W)
TrTorque (N·m)
Greek letters
εExpansion ratio
ηEfficiency
Acronyms
CAESCompressed air energy storage

References

  1. Wang, W.; Yuan, B.Q.; Sun, Q.; Ronald, W. Application of energy storage in integrated energy systems—A solution to fluctuation and uncertainty of renewable energy. J. Energy Storage 2022, 52, 104812. [Google Scholar] [CrossRef]
  2. Yu, X.L.; Jiang, R.C.; Li, Z.; Qian, G.; Wang, B.Z.; Wang, L.; Huang, R. Synergistic improvement of melting rate and heat storage capacity by a rotation-based method for shell-and-tube latent thermal energy storage. Appl. Therm. Eng. 2023, 219, 11948. [Google Scholar] [CrossRef]
  3. Zhou, Q.; Du, D.M.; Lu, C.; He, Q.; Liu, W.Y. A review of thermal energy storage in compressed air energy storage system. Energy 2019, 188, 115993. [Google Scholar] [CrossRef]
  4. Taleb, A.L.; Barfuß, C.; Sapin, P.; White, A.J.; Fabris, D.; Markides, C.N. Simulation of thermally induced thermodynamic losses in reciprocating compressors and expanders: Influence of real-gas effects. Appl. Therm. Eng. 2022, 217, 118738. [Google Scholar] [CrossRef]
  5. El, M.G.; Thibault, N.; Mustapha, B.; Fan, Y.L.; Albert, S. Experimental and numerical investigation on the flow and heat transfer behaviors during a compression–cooling–expansion cycle using a liquid piston for compressed air energy storage. Energy 2023, 277, 127622. [Google Scholar]
  6. Chen, H.; Peng, Y.H.; Wang, Y.L.; Zhang, J. Thermodynamic analysis of an open type isothermal compressed air energy storage system based on hydraulic pump/turbine and spray cooling. Energy Convers. Manag. 2020, 204, 112293. [Google Scholar] [CrossRef]
  7. Li, P. Isothermal Compressed Air Energy Storage (i-CAES) System. Encycl. Energy Storage 2022, 2, 204–217. [Google Scholar]
  8. Chen, L.X.; Zhang, L.G.; Yang, H.P.; Xie, M.N.; Ye, K. Dynamic simulation of a Re-compressed adiabatic compressed air energy storage (RA-CAES) system. Energy 2022, 261, 125351. [Google Scholar] [CrossRef]
  9. Liu, Z.; Li, Z.; Xie, D.S.; Wu, H.W. Unsteady characteristic and flow mechanism of a scroll compressor in small-scale compressed air energy storage system. J. Energy Storage 2022, 51, 104368. [Google Scholar] [CrossRef]
  10. Ma, X.; Zhang, C.H.; Li, K. Hybrid modeling and efficiency analysis of the scroll compressor used in micro compressed air energy storage system. Appl. Therm. Eng. 2019, 161, 114139. [Google Scholar] [CrossRef]
  11. Song, X.F.; Wu, Y.T.; Shen, L.L.; Wang, W.; Lei, B.; Zhi, R.P.; Ma, C.F. Comparative experimental analysis of the effect of lubricant viscosity on the performance of a single-screw expander with different structures. J. Energy Storage 2022, 52, 10495. [Google Scholar] [CrossRef]
  12. Mahbod, H.; David, P.; Martin, K.P. Physical design, techno-economic analysis and optimization of distributed compressed air energy storage for renewable energy integration. J. Energy Storage 2021, 35, 10226. [Google Scholar]
  13. Guo, W.B.; Zuo, Z.T.; Sun, J.T.; Hou, H.C.; Liang, Q.; Chen, H.S. Experimental investigation on off-design performance and adjustment strategies of the centrifugal compressor in compressed air energy storage system. J. Energy Storage 2021, 38, 10251. [Google Scholar] [CrossRef]
  14. Lin, Z.H.; Zuo, Z.T.; Guo, W.B.; Sun, J.T.; Liang, Q.; Chen, H.S. Experimental study on effects of adjustable vaned diffusers on impeller backside cavity of centrifugal compressor in CAES. Energies 2021, 14, 6187. [Google Scholar] [CrossRef]
  15. Lin, Z.H.; Zuo, Z.T.; Sun, J.T.; Zhou, X.; Zhang, D.; Chen, H.S. Flow characteristics of impeller backside cavity and its effects on the centrifugal compressor for compressed air energy storage. J. Energy Storage 2022, 49, 104024. [Google Scholar] [CrossRef]
  16. Lin, Z.; Zuo, Z.; Li, W.; Sun, J.; Zhou, X.; Chen, H.; Zhou, X. Experimental and Numerical Analysis of the Impeller Backside Cavity in a Centrifugal Compressor for CAES. Energies 2022, 15, 420. [Google Scholar] [CrossRef]
  17. Meng, C.; Zuo, Z.; Guo, W.; Sun, J.T.; Zhou, X.; Chen, H.S. Experimental and numerical investigation on off-design performance of a high-pressure centrifugal compressor in compressed air energy storage system. J. Energy Storage 2022, 53, 105081. [Google Scholar] [CrossRef]
  18. Xue, X.; Wang, T. Experimental study on inducement and development of flow instabilities in a centrifugal compressor with different diffuser types. J. Therm. Sci. 2020, 29, 435–444. [Google Scholar] [CrossRef]
  19. He, Y.; Chen, H.S.; Xu, Y.J.; Deng, J.Q. Compression performance optimization considering variable charge pressure in an adiabatic compressed air energy storage system. Energy 2018, 165, 349–359. [Google Scholar] [CrossRef]
  20. Cao, Z.; Zhou, S.H.; He, Y.; Xu, Y.J.; Chen, H.S.; Deng, J.Q. Numerical study on adiabatic compressed air energy storage system with only one ejector alongside final stage compression. Appl. Therm. Eng. 2022, 216, 119071. [Google Scholar] [CrossRef]
  21. Patil, V.C.; Ro, P.I. Experimental study of heat transfer enhancement in liquid piston compressor using aqueous foam. Appl. Therm. Eng. 2020, 164, 114441. [Google Scholar] [CrossRef]
  22. Zhang, L.; Liu, L.X.; Zhang, C.; He, X.B.; Zhang, Y.P.; Yang, T. Performance analysis of an adiabatic compressed air energy storage system with a pressure regulation inverter-driven compressor. J. Energy Storage 2021, 43, 103197. [Google Scholar] [CrossRef]
  23. Khaljani, M.; Harrison, J.; Surplus, D.; Murphy, A.; Sapin, P.; Markides, C.N.; Mahmoudi, Y. A combined experimental and modelling investigation of an overground compressed-air energy storage system with a reversible liquid-piston gas compressor/expander. Energy Convers. Manag. 2021, 245, 114536. [Google Scholar] [CrossRef]
  24. Khaljani, M.; Vennard, A.; Harrison, J.; Surplus, D.; Murphy, A.; Mahmoudi, Y. Experimental and modelling analysis of efficiency enhancement in a liquid piston gas compressor using metal plate inserts for compressed air energy storage application. J. Energy Storage 2021, 43, 10324. [Google Scholar] [CrossRef]
  25. Rice, A.T.; Li, P.Y.; Sanckens, C.J. Optimal efficiency-power tradeoff for an air compressor/expander. J. Dyn. Syst. Meas. Control 2018, 140, 021011. [Google Scholar] [CrossRef]
  26. Li, R.X.; Tao, R.; Yao, E.T.; Zhang, H.R.; Niu, Y.L.; Ling, L.N.; Yan, A.; Wang, H.R. Decoupling heat-pressure potential energy of compressed air energy storage system: Using near-isothermal compressing and thermal energy storage. J. Energy Storage 2023, 63, 10701. [Google Scholar] [CrossRef]
  27. Wieberdink, J.; Li, P.Y.; Simon, T.W.; Van de Ven, J.D. Effects of porous media insert on the efficiency and power density of a high pressure (210 bar) liquid piston air compressor/expander—An experimental study. Appl. Energy 2018, 212, 1025–1037. [Google Scholar] [CrossRef]
  28. Li, P.Y.; Saadat, M. An approach to reduce the flow requirement for a liquid piston near-isothermal air compressor/expander in a compressed air energy storage system. IET Renew. Power Gener. 2016, 10, 1506–1514. [Google Scholar] [CrossRef]
  29. Hu, S.W.; Xu, W.Q.; Cai, M.L.; Jia, G.W. Energy efficiency and power density analysis of a tube array liquid piston air compressor/expander for compressed air energy storage. J. Energy Storage 2022, 55, 105674. [Google Scholar] [CrossRef]
  30. He, Q.; Li, G.Q.; Lu, C.; Du, D.M.; Liu, W.Y. A compressed air energy storage system with variable pressure ratio and its operation control. Energy 2019, 169, 881–894. [Google Scholar] [CrossRef]
  31. Srivatsa, A.; Li, P.Y. How moisture content affects the performance of a liquid piston air compressor/expander. J. Energy Storage 2018, 18, 121–132. [Google Scholar] [CrossRef]
  32. Patil, V.C.; Liu, J.; Ro, P.I. Efficiency improvement of liquid piston compressor using metal wire mesh for near-isothermal compressed air energy storage application. J. Energy Storage 2020, 28, 101226. [Google Scholar] [CrossRef]
  33. Xu, Y.H.; Zhang, H.G.; Yang, F.B.; Tong, L.; Yang, Y.F.; Yan, D.; Wang, C.Y.; Ren, J.; Wu, Y.T. Experimental study on small power generation energy storage device based on pneumatic motor and compressed air. Energy Convers. Manag. 2021, 234, 113949. [Google Scholar] [CrossRef]
  34. Xu, Y.H.; Zhang, H.G.; Yang, F.B.; Tong, L.; Yan, D.; Yang, Y.F.; Wang, Y.; Wu, Y.T. Experimental investigation of pneumatic motor for transport application. Renew. Energy 2021, 179, 517–527. [Google Scholar] [CrossRef]
  35. Huang, X.; Li, K.; Xie, Y.; Liu, B.; Liu, J.Y.; Liu, Z.M.; Mou, L.J. A novel multistage constant compressor speed control strategy of electric vehicle air conditioning system based on genetic algorithm. Energy 2022, 241, 122903. [Google Scholar] [CrossRef]
  36. Abadeh, A.; Sardarabadi, M.; Abedi, M.; Pourramezan, M.; Passandideh-Fard, M.; Maghrebi, M.J. Experimental characterization of magnetic field effects on heat transfer coefficient and pressure drop for a ferrofluid flow in a circular tube. J. Mol. Liq. 2020, 299, 112206. [Google Scholar] [CrossRef]
  37. Wang, Z.; Shen, Y.F.; Wang, Z.B.; Wang, J.; Jiang, W.C.; Li, Q. Theoretical research and optimization analysis for the injection process of the single screw refrigeration compressor. Int. J. Refrig. 2018, 88, 91–101. [Google Scholar] [CrossRef]
Figure 1. Test bench for parallel compressor mode of CAES system.
Sustainability 15 13164 g001
Figure 2. Schematic diagram for parallel compressor mode.
Sustainability 15 13164 g002
Figure 3. Variation of torque with air tank pressure.
Sustainability 15 13164 g003
Figure 4. Variation of current with air tank pressure.
Sustainability 15 13164 g004
Figure 5. Variation of compression ratio with air tank pressure.
Sustainability 15 13164 g005
Figure 6. Consumption of CAES with air tank pressure. (a) Compressor power. (b) Battery power.
Sustainability 15 13164 g006
Figure 7. Efficiency of CAES with air tank pressure. (a) DC/AC conversion efficiency. (b) Isotropic efficiency.
Sustainability 15 13164 g007aSustainability 15 13164 g007b
Figure 8. Variation of current with torque.
Sustainability 15 13164 g008
Figure 9. Variation of compression ratio with torque.
Sustainability 15 13164 g009
Figure 10. Consumption of CAES with air tank with torque. (a) Compressor power. (b) Battery power.
Sustainability 15 13164 g010
Figure 11. Efficiency of CAES with torque. (a) DC/AC conversion efficiency. (b) Isotropic efficiency.
Sustainability 15 13164 g011
Figure 12. Variation of torque with mass flow rate.
Sustainability 15 13164 g012
Figure 13. Variation of current with mass flow rate.
Sustainability 15 13164 g013
Figure 14. Variation of compression ratio with mass flow rate.
Sustainability 15 13164 g014
Figure 15. Consumption of CAES with mass flow rate. (a) Compressor power. (b) Battery power.
Sustainability 15 13164 g015aSustainability 15 13164 g015b
Figure 16. Efficiency of CAES with mass flow rate. (a) DC/AC conversion efficiency. (b) Isotropic efficiency.
Sustainability 15 13164 g016aSustainability 15 13164 g016b
Figure 17. Variation of torque with air tank pressure in parallel mode.
Sustainability 15 13164 g017
Figure 18. Variation of current with air tank pressure in parallel mode.
Sustainability 15 13164 g018
Figure 19. Variation of compression ratio with air tank pressure in parallel mode.
Sustainability 15 13164 g019
Figure 20. Consumption of CAES with air tank pressure in parallel mode. (a) Compressor power. (b) Battery power.
Sustainability 15 13164 g020aSustainability 15 13164 g020b
Figure 21. Efficiency of CAES with air tank pressure in parallel mode. (a) DC/AC conversion efficiency. (b) Isotropic efficiency.
Sustainability 15 13164 g021aSustainability 15 13164 g021b
Figure 22. Variation of current with torque in parallel mode.
Sustainability 15 13164 g022
Figure 23. Variation of compression ratio with torque in parallel mode.
Sustainability 15 13164 g023
Figure 24. Consumption of CAES with torque in parallel mode. (a) Compressor power. (b) Battery power.
Sustainability 15 13164 g024
Figure 25. Efficiency of CAES with torque in parallel mode. (a) DC/AC conversion efficiency. (b) Isotropic efficiency.
Sustainability 15 13164 g025
Figure 26. Variation of torque with mass flow rate in parallel mode.
Sustainability 15 13164 g026
Figure 27. Variation of current with mass flow rate in parallel mode.
Sustainability 15 13164 g027
Figure 28. Variation of compression ratio with mass flow rate in parallel mode.
Sustainability 15 13164 g028
Figure 29. Consumption of CAES with mass flow rate in parallel mode. (a) Compressor power. (b) Battery power.
Sustainability 15 13164 g029
Figure 30. Efficiency of CAES with mass flow rate in parallel mode. (a) DC/AC conversion efficiency. (b) Isotropic efficiency.
Sustainability 15 13164 g030
Table 1. Parameters of pneumatic and servo motors.
TypeRated Rotation SpeedRated PowerRated Torque
QMH050A2000 r/min485 W7.0 N·m
80ST-M024303000 r/min750 W2.39 N·m
Table 2. Main parameters of various sensors.
NameMeasuring RangeTolerances
Pressure sensors0~15 bar ±0.2% FS
Temperature sensor−20~100 °C±0.5% FS
Torque sensor0~20 N·m±0.5% FS
Speed sensor0~6000 r/min±0.5% FS
Flowmeter0~5000 L/min±0.5% FS
Voltage sensor0~250 V±0.5% FS
Current sensor0~30 A±0.5% FS
Table 3. List of the absolute and relative uncertainties.
ParametersMeasuring RangeAccuracyRelative Uncertainty
pin, pout0–15 bar±0.2% FS0.4%
Tin, Tout−20–100 °C±0.5% FS2.5%
Torque0–20 N·m±0.5% FS1.67%
Rotation speed0–6000 r/min±0.5% FS1.5%
Volume flow rate0–5000 L/min±0.5% FS1.56%
Current0–30 A±0.5% FS1.67%
Disclaimer/Publisher’s Note: The statements, opinions and data contained in all publications are solely those of the individual author(s) and contributor(s) and not of MDPI and/or the editor(s). MDPI and/or the editor(s) disclaim responsibility for any injury to people or property resulting from any ideas, methods, instructions or products referred to in the content.

