
Comparison of Performance of Micro-Computed Tomography (Micro-CT) and Synchrotron Radiation CT in Assessing Coronary Stenosis Caused by Calcified Plaques in Coronary Artery Phantoms


Abstract
:1. Introduction
2. Materials and Methods
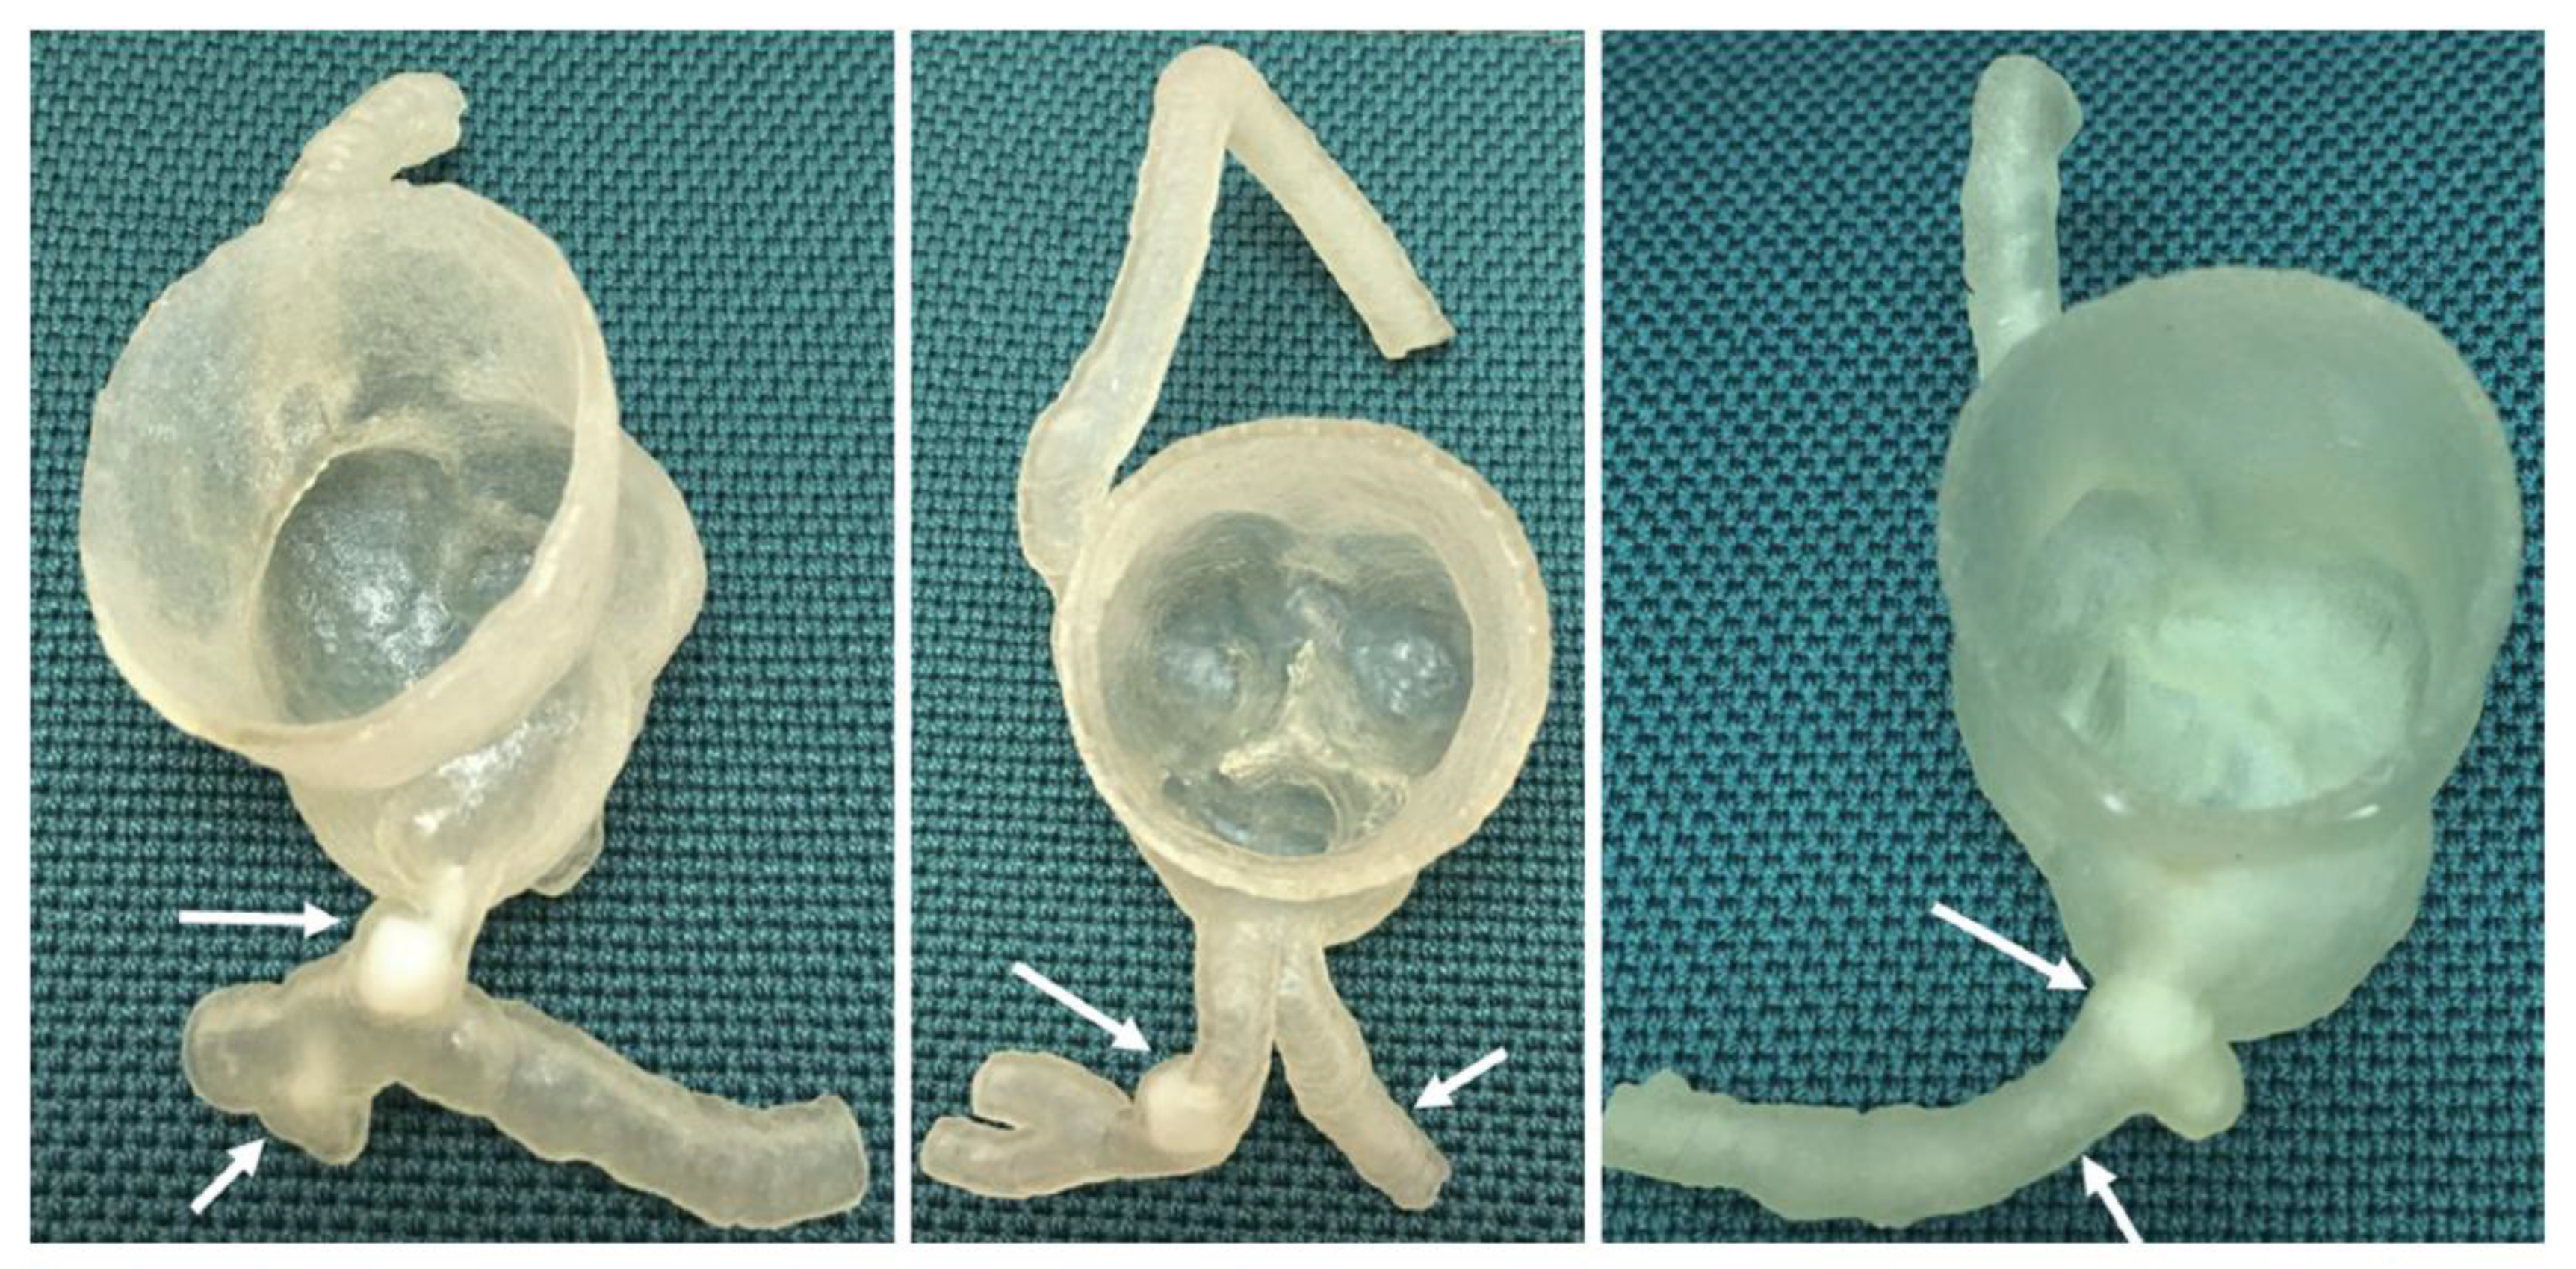
- Model 1: >90% and <50% stenosis in left main stem (LM) and left anterior descending (LAD) coronary artery, respectively.
- Model 2: >90% and 70% stenosis in LAD and left circumflex (LCx), respectively.
- Model 3: >90% and 70% stenosis in proximal LCx and middle LCx, respectively.
3. Results
4. Discussion
5. Future Directions and Perspectives
6. Conclusions
Author Contributions
Funding
Institutional Review Board Statement
Informed Consent Statement
Data Availability Statement
Conflicts of Interest
References
- Sun, Z.; Lin, C. Diagnostic value of 320-slice coronary CT angiography in coronary artery disease: A systematic review and meta-analysis. Curr. Med. Imaging 2014, 10, 272–280. [Google Scholar] [CrossRef]
- Xu, L.; Sun, Z.; Fan, Z. Non-invasive physiologic assessment of coronary stenoses using cardiac CT. Biomed. Res. Int. 2014, 2014, 435737. [Google Scholar] [CrossRef]
- Sun, Z.; Choo, G.H.; Ng, K.H. Coronary CT angiography: Current status and continuing challenges. Br. J. Radiol. 2012, 85, 495–510. [Google Scholar] [CrossRef] [PubMed]
- Lee, S.P.; Jang, E.J.; Kim, Y.J.; Cha, M.J.; Park, S.Y.; Song, H.J.; Choi, J.E.; Shim, J.I.; Ahn, J.; Lee, H.J. Cost-effectiveness of coronary CT angiography in patients with chest pain: Comparison with myocardial single photon emission tomography. J. Cardiovasc. Comput. Tomogr. 2015, 9, 428–437. [Google Scholar] [CrossRef]
- Park, M.J.; Jung, J.I.; Choi, Y.S.; Ann, S.H.; Youn, H.J.; Jeoon, G.N.; Choi, H.C. Coronary CT angiography in patients with high calcium score: Evaluation of plaque characteristics and diagnostic accuracy. Int. J. Cardiovasc. Imaging 2011, 27, 43–51. [Google Scholar] [CrossRef]
- Sun, Z.; Ng, C.K.C. High calcium scores in coronary CT angiography: Effects of image post-processing on visualization and measurement of coronary lumen diameter. J. Med. Imaging Health Inf. 2015, 5, 110–116. [Google Scholar] [CrossRef]
- Knuuti, J.; Wijns, W.; Saraste, A.; Capodanno, D.; Barbato, E.; Funck-Brentano, C.; Prescott, E.; Storey, R.F.; Deaton, C.; Cuisset, T.; et al. ESC Scientific Document Group. 2019 ESC guidelines for the diagnosis and management of chronic coronary syndromes. Eur. Heart J. 2020, 41, 407–477. [Google Scholar] [CrossRef]
- Sun, Z.; Ng, C.K.C.; Xu, L.; Fan, Z.; Lei, J. Coronary CT angiography in heavily calcified coronary arteries: Improvement of coronary lumen visualization and coronary stenosis assessment with image postprocessing methods. Medicine 2015, 94, e2148. [Google Scholar] [CrossRef] [PubMed]
- Sun, Z.; Ng, C.K.C. Artificial intelligence (enhanced super-resolution generative adversarial network) for calcium deblooming in coronary computed tomography angiography: A feasibility study. Diagnostics 2022, 12, 991. [Google Scholar] [CrossRef]
- Sun, Z.; Ng, C.K.C. Finetuned super-resolution generative adversarial network (artificial intelligence) model for calcium deblooming in coronary computed tomography angiography. J. Pers. Med. 2022, 12, 1354. [Google Scholar] [CrossRef]
- Sun, Z.; Xu, L.; Fan, Z. Coronary CT angiography in calcified coronary plaques: Comparison of diagnostic accuracy between bifurcation angle measurement and coronary lumen assessment for diagnosing significant coronary stenosis. Int. J. Cardiol. 2016, 203, 78–86. [Google Scholar] [CrossRef]
- Sun, Z. Coronary CT angiography in coronary artery disease: Correlation between virtual intravascular endoscopic appearances and left bifurcation angulation and coronary plaques. Biomed. Res. Int. 2013, 2013, 732059. [Google Scholar] [CrossRef] [PubMed]
- Xu, L.; Sun, Z. Coronary CT angiography evaluation of calcified coronary plaques by measurement of left coronary bifurcation angle. Int. J. Cardiol. 2015, 182, 229–231. [Google Scholar] [CrossRef] [PubMed]
- Andreini, D.; Pontone, G.; Mushtaq, S.; Conte, E.; Perchinunno, M.; Guglielmo, M.; Volpato, V.; Annoni, A.; Baggiano, A.; Formenti, A.; et al. Atrial fibrillation: Diagnostic accuracy of coronary CT angiography performed with a whole-heart 230-μm spatial resolution CT scanner. Radiology. 2017, 284, 676–684. [Google Scholar] [CrossRef] [PubMed]
- Naoum, C.; Blanke, P.; Leipsic, J. Iterative reconstruction in cardiac CT. J. Cardiovasc. Comput. Tomogr. 2015, 9, 255–263. [Google Scholar] [CrossRef]
- Shen, J.; Du, X.; Guo, D.; Cao, L.; Gao, Y.; Bai, M.; Li, P.; Liu, J.; Li, K. Noise-based tube current reduction method with iterative reconstruction for reduction of radiation exposure in coronary CT angiography. Eur. J. Radiol. 2013, 82, 349–355. [Google Scholar] [CrossRef]
- Yin, W.H.; Lu, B.; Gao, J.B.; Li, P.L.; Sun, K.; Wu, Z.F.; Yang, W.J.; Zhang, X.Q.; Zheng, M.W.; McQuiston, A.D.; et al. Effect of reduced x-ray tube voltage, low iodine concentration contrast medium, and sonogram-affirmed iterative reconstruction on image quality and radiation dose at coronary CT angiography: Results of the prospective multicentre REALISE trial. J. Cardiovasc. Comput. Tomogr. 2015, 9, 215–224. [Google Scholar] [CrossRef] [PubMed]
- Funabashi, N.; Irie, R.; Aiba, M.; Morimoto, R.; Kabashima, T.; Fujii, S.; Uehara, M.; Ozawa, K.; Takaoka, H.; Kobayashi, Y. Adaptive-iterative-dosereduction 3D with multisector-reconstruction method in 320-slice CT may maintain accurate-measurement of the Agatston-calcium-score of severe-calcification even at higher pulsating-beats and low tube-current in vitro. Int. J. Cardiol. 2013, 168, 601–603. [Google Scholar] [CrossRef]
- van Osch, J.A.C.; Mouden, M.; van Dalen, J.A.; Timmer, J.R.; Reiffers, S.; Knollema, S.; Greuter, M.W.; Ottervanger, J.P.; Jager, P.L. Influence of iterative image reconstruction on CT-based calcium score measurements. Int. J. Cardiovasc. Imaging 2014, 30, 961–967. [Google Scholar] [CrossRef]
- Renker, M.; Nance, J.W., Jr.; Schoepf, U.J.; O’Brien, T.X.; Zwerner, P.L.; Meyer, M.; Kerl, J.M.; Bauer, R.W.; Fink, C.F.; Vogl, T.J.; et al. Evaluation of heavily calcified vessel with coronary CT angiography: Comparison of iterative and filtered back projection image reconstruction. Radiology 2011, 260, 390–399. [Google Scholar] [CrossRef]
- Tanaka, R.; Yoshioka, K.; Muranaka, K.; Chiba, T.; Ueda, T.; Sasaki, T.; Fusazaki, T.; Ehara, S. Improved evaluation of calcified segments on coronary CT angiography: A feasibility study of coronary calcium subtraction. Int. J. Cardiovasc. Imaging 2013, 29, 75–81. [Google Scholar] [CrossRef] [PubMed]
- Pontone, G.; Bertella, E.; Mushtaq, S.; Loguercio, M.; Cortinovis, S.; Baggiano, A.; Conte, E.; Annoni, A.; Formenti, A.; Beltrama, V.; et al. Coronary artery disease: Diagnostic accuracy of CT coronary angiography-A comparison of high and standard spatial resolution scanning. Radiology 2014, 271, 688–694. [Google Scholar] [CrossRef] [PubMed]
- Sun, Z. The promise of synchrotron radiation in medical science. Australas. Med. J. 2009, 1, 1–5. [Google Scholar] [CrossRef]
- Sun, Z.; Ng, C.K.C.; Squelch, A. Synchrotron radiation computed tomography assessment of calcified plaques and coronary stenosis with different slice thicknesses and beam energies on 3D printed coronary models. Quant. Imaging Med. Surg. 2019, 9, 6–22. [Google Scholar] [CrossRef]
- du Plessis, A.; Broeckhoven, C.; Guelpa, A.; le Roux, S.G. Laboratory x-ray micro-computed tomography: A user guideline for biological samples. Gigascience 2017, 6, gix027. [Google Scholar] [CrossRef]
- Sun, Z.; Ng, C.K.C.; Wong, Y.H.; Yeong, C.H. 3D-printed coronary plaques to simulate high calcification in the coronary arteries for investigation of blooming artifacts. Biomolecules 2021, 11, 1307. [Google Scholar] [CrossRef]
- Giannopoulos, A.A.; Steigner, M.L.; George, E.; Barile, M.; Hunsaker, A.R.; Rybicki, F.J.; Mitsouras, D. Cardiothoracic applications of 3-dimensional printing. J. Thorac. Imaging 2016, 31, 253–272. [Google Scholar] [CrossRef]
- Lau, I.; Sun, Z. Dimensional accuracy and clinical value of 3D printed models in congenital heart disease: A systematic review and meta-analysis. J. Clin. Med. 2019, 8, 1483. [Google Scholar] [CrossRef]
- Lee, S.; Squelch, A.; Sun, Z. Quantitative assessment of 3D printed model accuracy in delineating congenital heart disease. Biomolecules 2021, 11, 270. [Google Scholar] [CrossRef]
- Valverde, I.; Gomez-Ciriza, G.; Hussain, T.; Suarez-Mejias, C.; Velasco-Forte, M.N.; Byrne, N.; Ordoñez, A.; Gonzalez-Calle, A.; Anderson, D.; Hazekamp, M.G.; et al. Three-dimensional printed models for surgical planning of complex congenital heart defects: An international multicentre study. Eur. J. Cardio-Thorac. Surg. 2017, 52, 1139–1148. [Google Scholar] [CrossRef]
- Lau, I.W.W.; Liu, D.; Xu, L.; Fan, Z.; Sun, Z. Clinical value of patient-specific three-dimensional printing of congenital heart disease: Quantitative and qualitative assessments. PLoS ONE 2018, 13, e0194333. [Google Scholar] [CrossRef]
- Sun, Z.; Wee, C. 3D printed models in cardiovascular disease: An exciting future to deliver personalized medicine. Micromachines 2022, 13, 1575. [Google Scholar] [CrossRef] [PubMed]
- Sun, Z. Clinical applications of patient-specific 3D printed models in cardiovascular disease: Current status and future directions. Biomolecules 2020, 10, 1577. [Google Scholar] [CrossRef] [PubMed]
- Sun, Z.; Wong, Y.H.; Yeong, C.H. Patient-specific 3D-printed low-cost models in medical education and clinical practice. Micromachines 2023, 14, 464. [Google Scholar] [CrossRef] [PubMed]
- Mayer, R.; Liacouras, P.; Thomas, A.; Kang, M.; Lin, L.; Simonet, C.B., 2nd. 3D printer generated thorax phantom with mobile tumor for radiation dosimetry. Rev. Sci. Instrum. 2015, 86, 074301. [Google Scholar] [CrossRef] [PubMed]
- Hou, K.Y.; Tsujioka, K.; Yang, C.C. Optimization of HU threshold for coronary artery calcium scans reconstructed at 0.5-mm slice thickness using iterative reconstruction. J. Appl. Clin. Med. Phys. 2020, 21, 111–120. [Google Scholar] [CrossRef]
- Yang, Q.; Liu, J.; Barnes, S.R.; Wu, Z.; Li, K.; Neelavalli, J.; Hu, J.; Haacke, E.M. Imaging the vessel wall in major peripheral arteries using susceptibility-weighted Imaging. J. Magn. Reason. Imaging 2009, 30, 357–365. [Google Scholar] [CrossRef]
- Suzuki, S.; Machida, H.; Tanaka, I.; Ueno, E. Vascular diameter measurement in CT angiography: Comparison of model-based iterative reconstruction and standard filtered back projection algorithms in vitro. AJR Am. J. Roentgenol. 2013, 200, 652–657. [Google Scholar] [CrossRef]
- Sun, Z.; Ng, C.K.C. Synchrotron radiation imaging of aortic stent grafting: An in vitro phantom study. J. Med. Imaging Health Inform. 2017, 7, 890–896. [Google Scholar] [CrossRef]
- Sun, Z.; Ng, C.K.C. Use of synchrotron radiation to accurately assess cross-sectional area reduction of the aortic branch ostia caused by suprarenal stent wires. J. Endovasc. Ther. 2017, 24, 870–879. [Google Scholar] [CrossRef]
- Sun, Z.; Ng, C.K.C.; Sa Dos Reis, C. Synchrotron radiation computed tomography versus conventional computed tomography for assessment of four types of stent grafts used for endovascular treatment of thoracic and abdominal aortic aneurysms. Quant. Imaging Med. Surg. 2018, 8, 609–620. [Google Scholar] [CrossRef]
- Kalisz, K.; Buethe, J.; Saboo, S.S.; Abbara, S.; Halliburton, S.; Rajiah, P. Artifacts at cardiac CT: Physics and solutions. Radiographics 2016, 36, 2064–2083. [Google Scholar] [CrossRef]
- Xu, L.; Sun, Z. Virtual intravascular endoscopy visualization of calcified coronary plaques: A novel approach of identifying plaque features for more accurate assessment of coronary lumen stenosis. Medicine 2015, 94, e805. [Google Scholar] [CrossRef] [PubMed]
- Sun, Z.; Dosari, S.A.; Ng, C.; al-Muntashari, A.; Almaliky, S. Multislice CT virtual intravascular endoscopy for assessing pulmonary embolisms: A pictorial review. Korean J. Radiol. 2010, 11, 222–230. [Google Scholar] [CrossRef]
- Sun, Z.; Dimpudus, F.J.; Nugroho, J.; Adipranoto, J.D. CT virtual intravascular endoscopy assessment of coronary artery plaques: A preliminary study. Eur. J. Radiol. 2010, 75, e112–e119. [Google Scholar] [CrossRef] [PubMed]
- Li, P.; Xu, L.; Yang, L.; Wang, R.; Hsieh, J.; Sun, Z.; Fan, Z.; Leipsic, J.A. Blooming artifact reduction in coronary artery calcification by a new de-blooming algorithm: Initial study. Sci. Rep. 2018, 8, 6945. [Google Scholar] [CrossRef] [PubMed]
- Weir-McCall, J.R.; Wang, R.; Halankar, J.; Hsieh, J.; Hague, C.J.; Rosenblatt, S.; Fan, Z.; Sellers, S.L.; Murphy, D.T.; Blanke, P.; et al. Effect of a calcium deblooming algorithm on accuracy of coronary computed tomography angiography. J. Cardiovasc. Comput. Tomogr. 2020, 14, 131–136. [Google Scholar] [CrossRef] [PubMed]
- Nikon Corporation. XT H 225 ST 2x. Available online: https://industry.nikon.com/en-aom//wp-content/uploads/sites/20/2022/12/xth-225-st-2x-en.pdf (accessed on 19 June 2023).
- Leipsic, J.; Heilbron, B.G.; Hague, C. Iterative reconstruction for coronary CT angiography: Finding its way. Int. J. Cardiovasc. Imaging 2012, 28, 613–620. [Google Scholar] [CrossRef]
- Wang, J.; Fleischmann, D. Improving spatial resolution at CT: Development, benefits, and pitfalls. Radiology 2018, 289, 261–262. [Google Scholar] [CrossRef]
- Wu, S. The potential value of 320-row computed tomography angiography in digital subtraction angiography-Negative spontaneous subarachnoid hemorrhage patients. J. Comput. Assist. Tomogr. 2022, 46, 244–250. [Google Scholar] [CrossRef]
- Trost, J.; Ferraro, R.; Sharma, G.; Hays, A.G.; Boden, W.E.; Blumenthal, R.S.; Arbab-Zadeh, A. CCTA should be the new diagnostic gateway for evaluating intermediate-risk stable angina patients. JACC Adv. 2022, 1, 100116. [Google Scholar] [CrossRef]
- Kim, C.; Hong, S.J.; Ahn, C.M.; Kim, J.S.; Kim, B.K.; Ko, Y.G.; Choi, B.W.; Choi, D.; Jang, Y.; Hong, M.K. Clinical implications of moderate coronary stenosis on coronary computed tomography angiography in patients with stable angina. Yonsei Med. J. 2018, 59, 937–944. [Google Scholar] [CrossRef] [PubMed]
- Koons, E.; VanMeter, P.; Rajendran, K.; Yu, L.; McCollough, C.; Leng, S. Improved quantification of coronary artery luminal stenosis in the presence of heavy calcifications using photon-counting detector CT. Proc. SPIE Int. Soc. Opt. Eng. 2022, 12031, 120311A. [Google Scholar] [CrossRef] [PubMed]
- Zsarnoczay, E.; Fink, N.; Schoepf, U.J.; O’Doherty, J.; Allmendinger, T.; Hagenauer, J.; Wolf, E.V.; Griffith, J.P., 3rd; Maurovich-Horvat, P.; Varga-Szemes, A.; et al. Ultra-high resolution photon-counting coronary CT angiography improves coronary stenosis quantification over a wide range of heart rates-A dynamic phantom study. Eur. J. Radiol. 2023, 161, 110746. [Google Scholar] [CrossRef]
- Si-Mohamed, S.A.; Boccalini, S.; Lacombe, H.; Diaw, A.; Varasteh, M.; Rodesch, P.A.; Dessouky, R.; Villien, M.; Tatard-Leitman, V.; Bochaton, T.; et al. Coronary CT angiography with photon-counting CT: First-in-human results. Radiology 2022, 303, 303–313. [Google Scholar] [CrossRef]
- Hagar, M.T.; Soschynski, M.; Saffar, R.; Ran, A.; Taron, J.; Weiss, J.; Stein, T.; Faby, S.; von zur Mueblen, C.; Ruile, P.; et al. Accuracy of ultrahigh-resolution photon-counting CT for detecting coronary artery disease in a high-risk population. Radiology 2023, 307, e223305. [Google Scholar] [CrossRef]
- Soschynski, M.; Hagen, F.; Baumann, S.; Hagar, M.T.; Weiss, J.; Krauss, T.; Schlett, C.L.; von zur Muhlen, C.; Nikolaou, K.; Greulich, S.; et al. High temporal resolution dual-source photon-counting CT for coronary artery disease: Initial multicenter clinical experience. J. Clin. Med. 2022, 11, 6003. [Google Scholar] [CrossRef]
- Yang, J.; Shan, D.; Wang, X.; Sun, X.; Shao, M.; Wang, K.; Pan, Y.; Wang, Z.; Schoepf, U.J.; Savage, R.H.; et al. On-site computed tomography-derived fractional flow reserve to guide management of patients with stable coronary artery disease: The TARGET randomized trial. Circulation 2023, 147, 1369–1381. [Google Scholar] [CrossRef]
- Douglas, P.S.; De Bruyne, B.; Pontone, G.; Patel, M.R.; Norgaard, B.L.; Byrne, R.A.; Curzen, N.; Purcell, I.; Gutberlet, M.; Rioufol, G.; et al. 1-year outcomes of FFRCT-guided care in patients with suspected coronary artery disease: The PLATFORM Study. J. Am. Coll. Cardiol. 2016, 68, 435–445. [Google Scholar] [CrossRef]
- Curzen, N.; Nicholas, Z.; Stuart, B.; Wilding, S.; Hill, K.; Shambrook, J.; Eminton, Z.; Ball, D.; Barrett, C.; Johnson, L.; et al. Fractional flow reserve derived from computed tomography coronary angiography in the assessment and management of stable chest pain: The FORECAST randomized trial. Eur. Heart J. 2021, 42, 3844–3852. [Google Scholar] [CrossRef]
- Gao, X.; Wang, R.; Sun, Z.; Zhang, H.; Bo, K.; Xue, X.; Yang, J.; Xu, L. A novel CT perfusion-based fractional flow reserve algorithms for detecting coronary artery disease. J. Clin. Med. 2023, 12, 2154. [Google Scholar] [CrossRef] [PubMed]


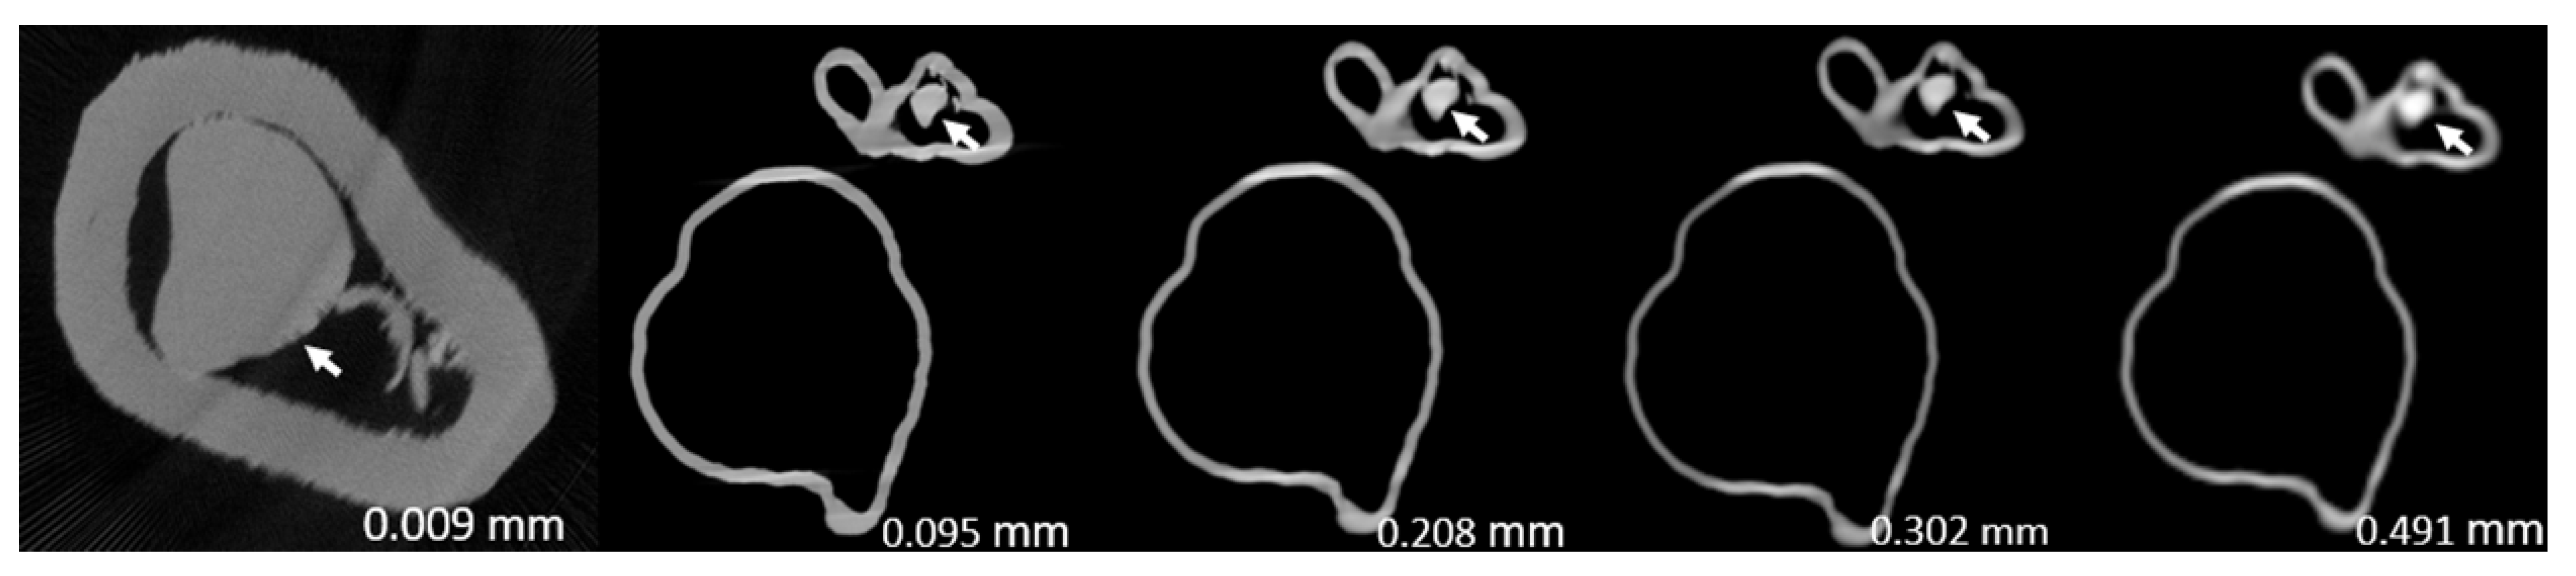
| Model | Degree of Lumen Stenosis (%) | p-Value | ||||
|---|---|---|---|---|---|---|
| Micro CT | SRCT | |||||
| 0.009 mm ST | 0.095 mm ST | 0.208 mm ST | 0.302 mm ST | 0.491 mm ST | ||
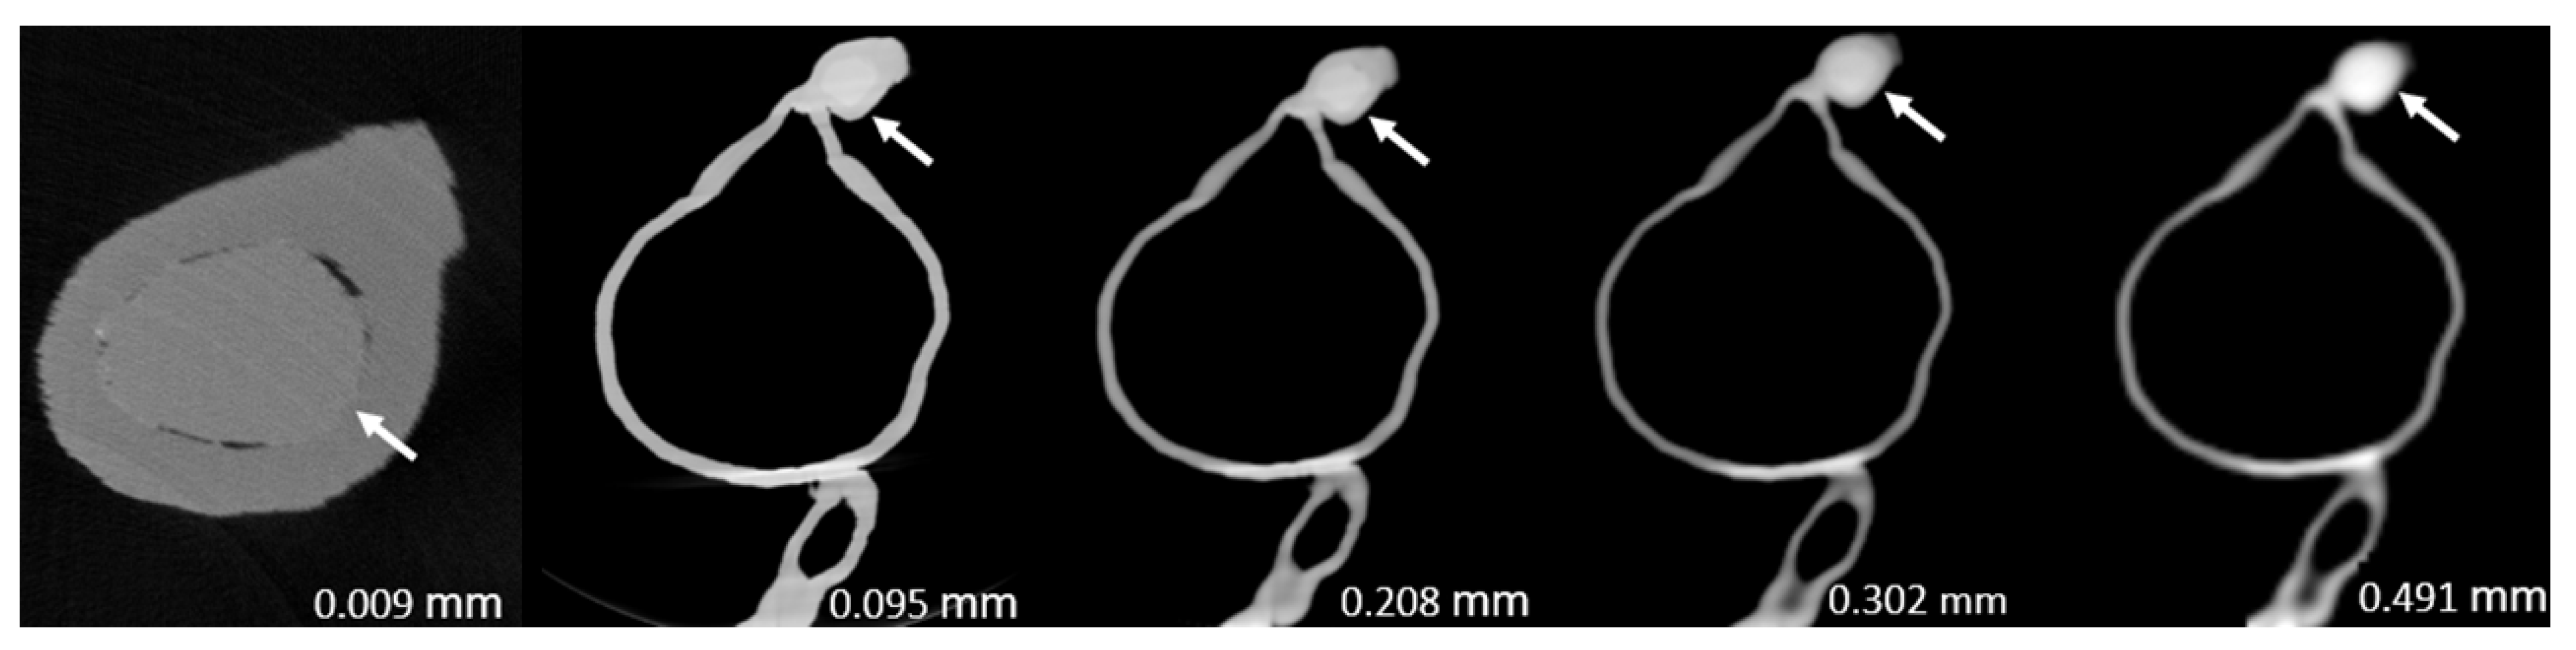
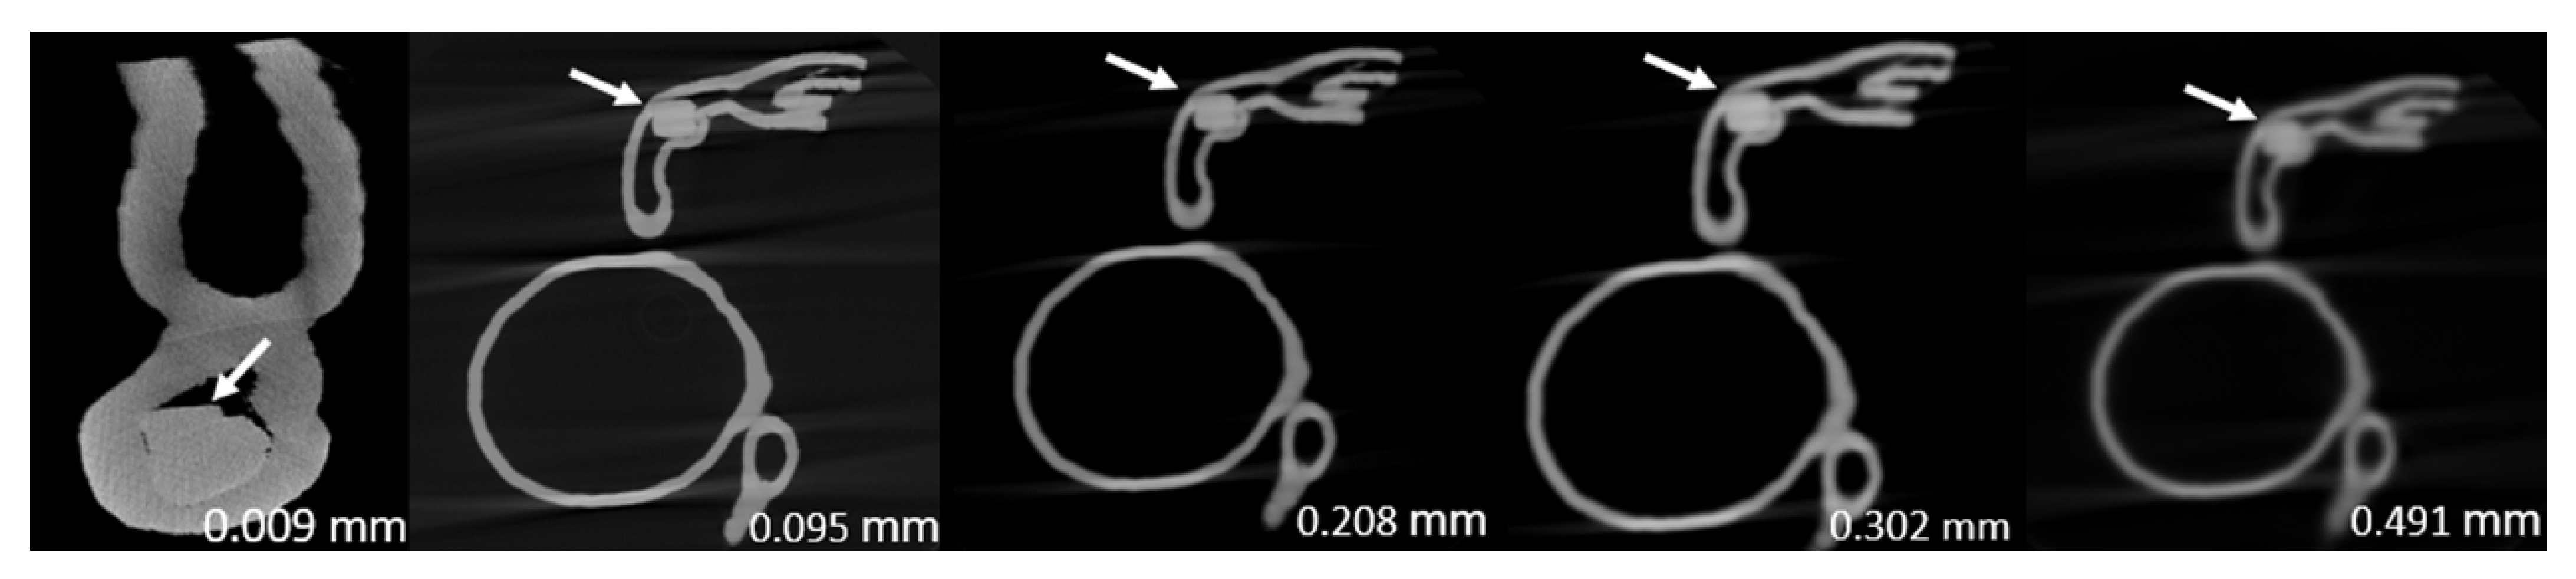
| 1 | 86.2 ± 0.033 | 99.1 ± 0.004 | 98.8 ± 0.003 | 99.1 ± 0.004 | 100 ± 0.000 | <0.005 |
| 2 | 80.0 ± 0.044 | 97.2 ± 0.025 | 97.8 ± 0.022 | 96.4 ± 0.012 | 96.4 ± 0.010 | <0.0005 |
| 3 | 94.4 ± 0.000 | 99.2 ± 0.005 | 97.2 ± 0.009 | 97.8 ± 0.005 | 100 ± 0.000 | <0.0005 |
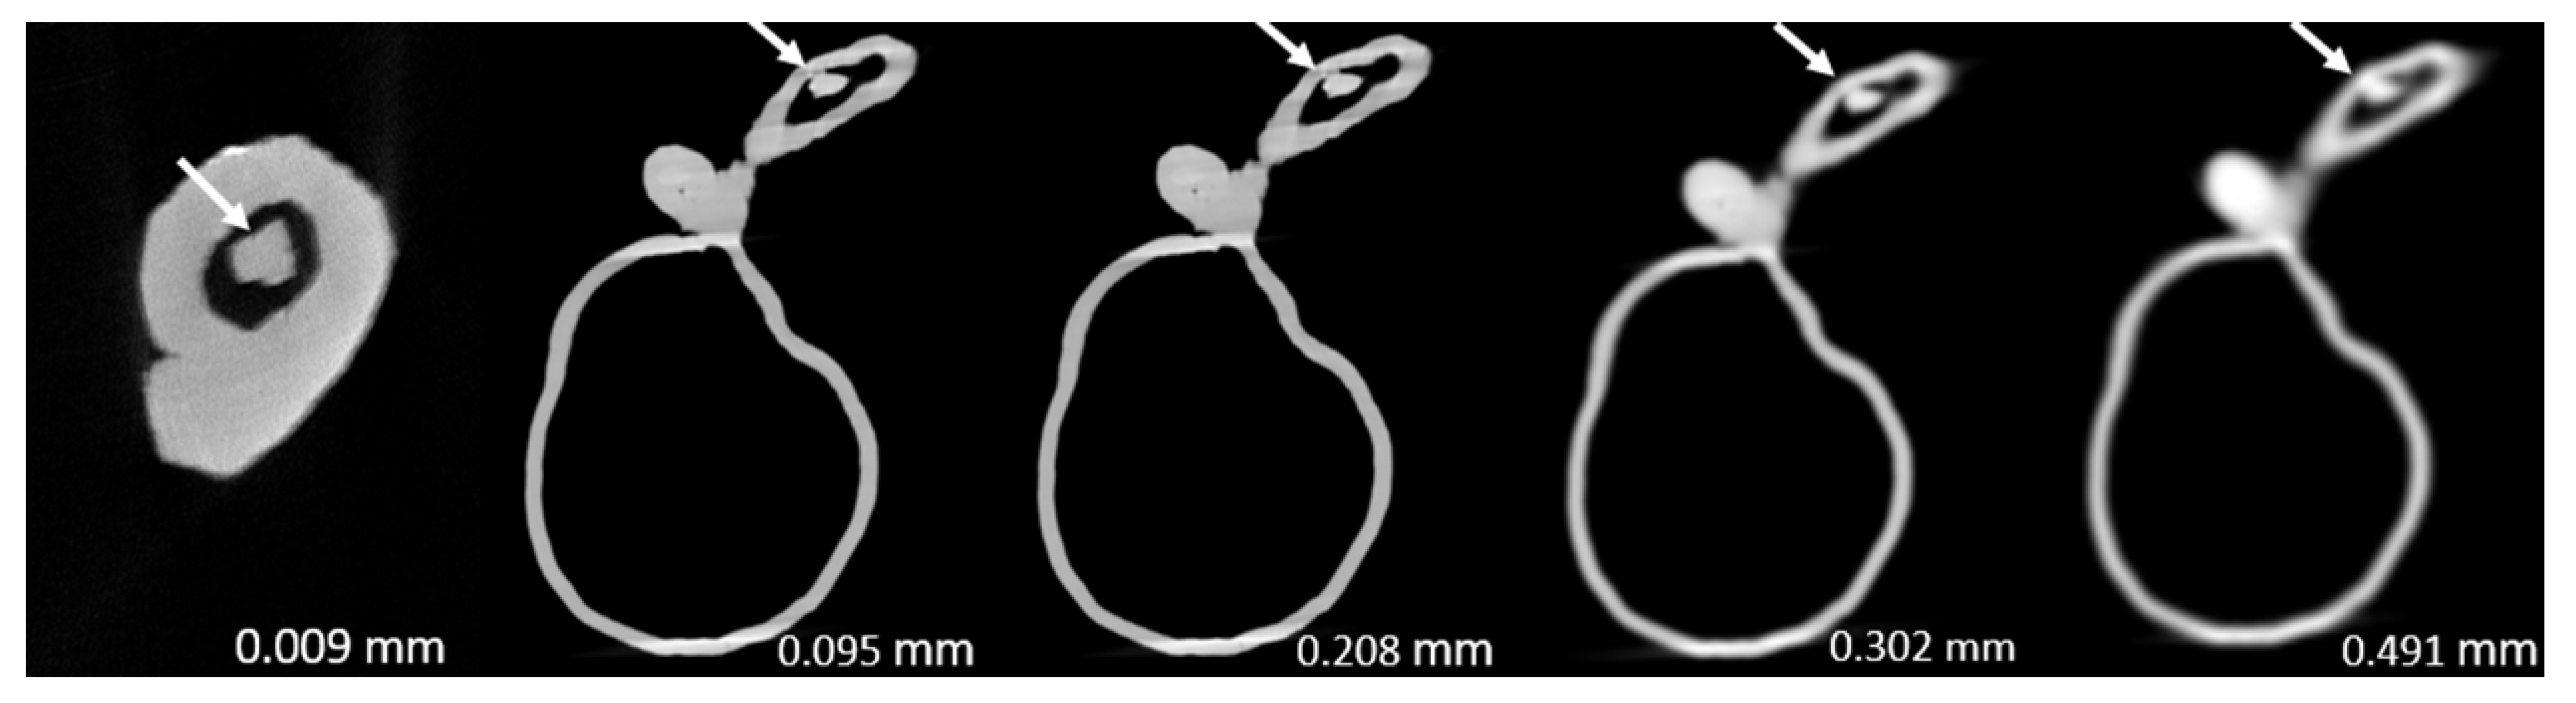
| Model | Degree of Lumen Stenosis (%) | p-Value | ||||
|---|---|---|---|---|---|---|
| Micro CT | SRCT | |||||
| 0.009 mm ST | 0.095 mm ST | 0.208 mm ST | 0.302 mm ST | 0.491 mm ST | ||
| 1 | 46.4 ± 0.035 | 47.4 ± 0.007 | 47.3 ± 0.001 | 48.6 ± 0.022 | 55.1 ± 0.036 | <0.05 |
| 2 | 60.0 ± 0.031 | 70.0 ± 0.003 | 71.7 ± 0.022 | 77.8 ± 0.011 | 84.8 ± 0.008 | <0.0005 |
| 3 | 75.0 ± 0.000 | 71.5 ± 0.011 | 75.2 ± 0.017 | 74.7 ± 0.021 | 85.1 ± 0.078 | 0.091 |
Disclaimer/Publisher’s Note: The statements, opinions and data contained in all publications are solely those of the individual author(s) and contributor(s) and not of MDPI and/or the editor(s). MDPI and/or the editor(s) disclaim responsibility for any injury to people or property resulting from any ideas, methods, instructions or products referred to in the content. |
© 2023 by the authors. Licensee MDPI, Basel, Switzerland. This article is an open access article distributed under the terms and conditions of the Creative Commons Attribution (CC BY) license (https://creativecommons.org/licenses/by/4.0/).
Share and Cite
Ng, C.K.C.; Sun, Z.; Jansen, S. Comparison of Performance of Micro-Computed Tomography (Micro-CT) and Synchrotron Radiation CT in Assessing Coronary Stenosis Caused by Calcified Plaques in Coronary Artery Phantoms. J. Vasc. Dis. 2023, 2, 338-350. https://doi.org/10.3390/jvd2030026
Ng CKC, Sun Z, Jansen S. Comparison of Performance of Micro-Computed Tomography (Micro-CT) and Synchrotron Radiation CT in Assessing Coronary Stenosis Caused by Calcified Plaques in Coronary Artery Phantoms. Journal of Vascular Diseases. 2023; 2(3):338-350. https://doi.org/10.3390/jvd2030026
Chicago/Turabian StyleNg, Curtise K. C., Zhonghua Sun, and Shirley Jansen. 2023. "Comparison of Performance of Micro-Computed Tomography (Micro-CT) and Synchrotron Radiation CT in Assessing Coronary Stenosis Caused by Calcified Plaques in Coronary Artery Phantoms" Journal of Vascular Diseases 2, no. 3: 338-350. https://doi.org/10.3390/jvd2030026