Previous Article in Journal
The Impact Mechanism of Climate and Vegetation Changes on the Blue and Green Water Flow in the Main Ecosystems of the Hanjiang River Basin, China
Previous Article in Special Issue
Assimilating FY-3D MWHS2 Radiance Data to Predict Typhoon Muifa Based on Different Initial Background Conditions and Fast Radiative Transfer Models
 
 
Order Article Reprints
Article

Direct Assimilation of Ground-Based Microwave Radiometer Clear-Sky Radiance Data and Its Impact on the Forecast of Heavy Rainfall

1
Laboratory of Meteorological Disaster, Joint International Research Laboratory of Climate and Environment Change (ILCEC), Collaborative Innovation Center on Forecast and Evaluation of Meteorological Disasters (CIC-FEMD), Ministry of Education (KLME), Nanjing University of Information Science and Technology, Nanjing 210044, China
2
CMA Institute for Development and Programmer Design, Beijing 100081, China
3
Key Laboratory of Agrometeorological Support and Application Technology of Henan Province, CMA, Zhengzhou 450003, China
4
Henan Climate Center, Zhengzhou 450003, China
*
Author to whom correspondence should be addressed.
Remote Sens. 2023, 15(17), 4314; https://doi.org/10.3390/rs15174314 (registering DOI)
Received: 13 July 2023 / Revised: 20 August 2023 / Accepted: 23 August 2023 / Published: 1 September 2023

Abstract

:
Ground-based microwave radiometer (GMWR) data with high spatial and temporal resolution can improve the accuracy of weather forecasts when effectively assimilated into numerical weather prediction. Nowadays, the major method to assimilate these data is via indirect assimilation by assimilating the retrieved profiles, which introduces large retrieval errors and cannot easily be represented by an error covariance matrix. Direct assimilation, on the other hand, can avoid this issue. In this study, the ground-based version of the Radiative Transfer for the TIROS Operational Vertical Sounder (RTTOV-gb) was selected as the observation operator, and a direct assimilation module for GMWR radiance data was established in the Weather Research and Forecasting Model Data Assimilation (WRFDA). Then, this direct assimilation module was applied to assimilate GMWR data. The results were compared to the indirect assimilation experiment and demonstrated that direct assimilation can more effectively improve the model’s initial fields in terms of temperature and humidity than indirect assimilation while avoiding the influence of retrieval errors. In addition, direct assimilation performed better in the precipitation forecast than indirect assimilation, making the main precipitation center closer to the observation. In particular, the improvement in the precipitation forecast with a threshold of 60 mm/6 h was obvious, and the corresponding TS score was significantly enhanced.

1. Introduction

Despite the importance of the planetary boundary layer (PBL) in the atmosphere, its observation remains poor. The statement of guidance for global numerical weather prediction (NWP) published by the World Meteorological Organization highlights four critical atmospheric variables in the PBL that are inadequately measured: the wind profile, temperature and humidity profile, precipitation, and snow equivalent water content [1]. Ground-based microwave radiometers (GMWRs) can continuously monitor temperature and humidity profiles from 0 to 10 km above the observation station and provide valuable information from the PBL regardless of weather conditions [2]. Hence, GMWRs can effectively complement sounding observations in the PBL [3,4].
Current studies indicate that GMWR products are used for a variety of applications, such as site climatology characterization [5], monitoring and warning severe convective systems [6,7], observing the microwave radiation of the sun [8], observing liquid water clouds [9], and analyzing haze processes [10,11]. Moreover, attempts have been made to assimilate GMWR data into NWP models to improve forecasts [12,13].
As with satellite radiance data assimilation, the assimilation methods for GMWR radiance data can be categorized into indirect and direct assimilation. For indirect assimilation, the method of indirect assimilation converts radiance data into atmospheric variables before assimilating them into the model, introducing complicated retrieval errors that cannot be easily represented by an error covariance matrix [14,15]. Moreover, quality control can directly affect forecast results during the indirect assimilation process [16]. Direct assimilation, on the other hand, uses a radiative transfer model as an observation operator to directly assimilate radiance data, which can effectively avoid retrieval errors and extract more atmospheric information because of the more optimal utilization of radiance data [17,18]. Despite these advantages, the current application of GMWR data assimilation remains limited to indirect methods [19,20]. This limitation was previously attributed to the absence of suitable radiative transfer models (RTMs) that could serve as observation operators. However, based on the Radiative Transfer for the TIROS Operational Vertical Sounder (RTTOV) v11.2, Angelis et al., (2016) developed the RTTOV-gb, a ground-based version of the RTTOV to simulate GMWR brightness temperatures (BTs). Although there has been no research on applying the RTTOV-gb to direct assimilation, it has tangent linear, adjoint, and K-modules like the RTTOV, which are essential for direct assimilation during the assimilation process [21]. Therefore, the RTTOV-gb has the potential to serve as an observation operator for the direct assimilation of GMWR radiance data [22].
In this study, the direct assimilation module of GMWR radiance data with the RTTOV-gb was configured in the WRFDA system. The impact of direct assimilation was evaluated by comparing its forecasts with the indirect assimilation experiment. The rest of the paper is organized as follows: Section 2 details the GMWR radiance data and the RTMs. In Section 3, the performance of the RTTOV-gb for GMWR radiance data is assessed, and the direct assimilation module for the GMWR data utilized in this study is described. Section 4 presents a case of heavy rainfall and the experiment designs. The results based on this case study are analyzed in Section 5, followed by the conclusion and discussion in Section 6.

2. Data and RTM

2.1. Data Description

The Level-1 (BT) and Level-2 data (retrieved products) output data of the GMWRs were used in this study. The data were derived from the GMWR network of seven Radiometer Physics GmbH—Humidity and Temperature PROfiler (RPG-HATPRO) GMWRs over the Beijing region from May to September 2019. Figure 1 shows the distribution of these GMWRs.
There are 14 channels in the RPG-HATPRO GMWR, including channels 1–7 in the K-band (water vapor band) and channels 8–14 in the V-band (oxygen band). The details of each channel are listed in Table 1. The Level-1 products indicate the downwelling radiance at a specified frequency coming from the atmosphere, which is usually expressed in terms of BT. The Level-2 products used in this study were obtained using a BP neural network inverse method, including the relative humidity and temperature profiles [23,24]. The Level-2 products have 47 levels from 0 km to 10 km above ground level (AGL) with a time resolution of 2 min. The vertical resolution is 100 m below 1 km and 250 m above 1 km AGL, respectively. The National Centers for Environmental Prediction (NCEP) FNL (Final) Operational Global Analysis data with a horizontal resolution of 0.25° × 0.25° were used to provide the initial and boundary conditions for the model simulation. The observed rainfall data used in this study are the 0.1° × 0.1° hourly precipitation products from the Chinese Meteorological Data Sharing Service System (The website address is: http://data.cma.cn/), which were obtained by combining CMORPH (CPC MORPHing technique) retrieved satellite data with automatic weather station observations.

2.2. RTM

The monochromatic radiative transfer model (MonoRTM) is the RTM developed for the ARM (tmospheric Radiation Measurement) Program to compute monochromatic radiative transfer, especially in the microwave and millimeter-wave spectral regions. It employs identical physical mechanisms as the line-by-line radiative transfer model (LBLRTM) for its functioning. The MonoRTM employs a Voigt line shape with all of the parameters provided in the HITRAN line database and the continuum model Mlawer–Tobin–Clough–Kneizys–Davis (MT_CKD), which includes foreign- and self-broadened water vapor absorption continua as well as continua for oxygen, nitrogen, carbon dioxide, and ozone. Additionally, line coupling parameters for oxygen in the microwave region are also included. Many studies have been conducted worldwide to compare its simulation ability with other RTMs and to verify the simulated results of various instruments, including GMWRs [25,26,27]. These studies indicate that the MonoRTM has a good ability to calculate BTs for GMWRs.
The RTTOV-gb is a version of the RTTOV developed at the Center of Excellence in Telesensing of Environment and Model Prediction of Severe Events (CETEMPS). It is designed to simulate the radiances of atmospheric downwelling natural radiation in the frequency range from 22 to 150 GHz for upward-looking GMWR observations. The same as the RTTOV, the RTTOV-gb is also a parameterized atmospheric radiative transfer model. And it also has the tangent linear, adjoint, and K-modules like the RTTOV to provide Jacobians. Therefore, it can serve as an observation operator to assimilate the GMWRs.
Under clear-sky conditions in the microwave region, the optical depth of each layer is only determined by the absorption of atmospheric gases, primarily nitrogen, water vapor, and oxygen. Thus, instead of using a complicated line-by-line (LBL) absorption model to calculate the layer optical depth, the parameterization uses a simplified parameterized model to compute it in the RTTOV-gb [28]. This simplified model involves a linear regression approach and connects the layer’s optical depth with the predictors achieved from the humidity, temperature, and pressure profiles of the atmosphere. The regression coefficients are calculated offline using a diverse training dataset consisting of atmospheric thermodynamical profiles and their corresponding optical depths computed with an LBL model. Therefore, the RTTOV-gb utilizes a fast parameterization of the modified LBL model to train the regression coefficients. In the RTTOV-gb, a later version of the millimeter-wave propagation model (MPM) is utilized to train the regression coefficients from 10 to 200 GHz as described by Rosenkranz (1998, hereafter R98) [29]. Later, this model was revised (Rosenkranz, 2017, hereafter R17) [30]. Therefore, the RTTOV-gb v1.0 can now have coefficients for both the R98 and R17 models.

3. Direct Assimilation Module Construction and Verification in WRFDA

3.1. Performance of RTTOV-gb

Since the MonoRTM has a strong capability of simulating BTs from GMWRs, a validation was conducted using both the MonoRTM and the RTTOV-gb to test whether the RTTOV-gb could serve as an effective observation operator for GMWR direct assimilation. The simulated BTs from the two RTMs were compared with real GMWR observations at the corresponding location and time.
The temperature and water vapor data from ECMWF Reanalysis version 5 (ERA5) data were used as the input profiles to simulate the BTs for both the MonoRTM and the RTTOV-gb. The ERA5 data were interpolated to the seven locations shown in Figure 1 using bilinear interpolation. As neither model contains precipitation-related parameters for the simulations, only observation samples without rain detected by the GMWR rain sensor were selected for analysis. The simulation experiments were conducted from 0000 UTC 1 July 2019 to 0000 UTC 30 September 2019 with simulations performed every 6 h.

3.2. Comparison with Line-by-Line Model Computed Radiance and Real Observations

In order to quantitatively evaluate the difference between the simulated and the observed BTs of the two models, the mean bias (BIAS), root mean square error (RMSE), and correlation coefficient (COR) were used:
B I A S = i = 1 n ( x i O B S x M N ¯ ) n
R M S E = i = 1 n ( x i O B S x i M N ) 2 n
C O R = i n ( x i O B S x O B S ¯ ) ( x i M N x M N ¯ ) i = 1 n ( x i O B S x O B S ¯ ) 2 i = 1 n ( x i M N x M N ¯ ) 2
x i O B S and x i M N (with i being the label of the sample) represent the observed and simulated BTs of the GMWRs, respectively. n is the size of the samples used for analysis.
Because of the similitude of each station, the simulations and observations from Station 54399 were chosen as an analysis example. As shown in Figure 2, for both models from all 14 channels, most scatter points are concentrated near the diagonal, indicating the simulations are consistent with observations. This also implies a similar performance in simulating the BTs for the GMWRs of both models. However, for temperature channels 6 and 7 and oxygen channels 8 and 9, there is a larger degree of dispersion in the scatterplots (Figure 2f–i) compared to the other channels, indicating larger simulation errors from these four channels.
The mean bias can reflect the overall difference between the simulated and observed BTs for all samples. Figure 3a demonstrates that the simulated BTs from the RTTOV-gb (red line) and MonoRTM (green line) for most channels have a positive bias from the observed ones. However, the mean biases from all 14 channels for both models are within 3.0 K, which is smaller than the systematic bias of 3.5 K given by the instrument, indicating that the error is within a normal range.
Considering the mean bias may be erroneously close to zero due to positive biases offsetting the negative ones, the RMSE better reflects the simulation difference from the observation. As shown in Figure 3b, the RTTOV-gb (red line) and MonoRTM (green line) exhibit consistent behavior in terms of the RMSE, with large RMSEs from water vapor channels 1–7 and small RMSEs from the last four oxygen channels. However, the MonoRTM reaches its maximum at channel 8, while the RTTOV-gb reaches its maximum at channel 9. This implies that both models have larger simulation errors at the edge channels. Additionally, for the CORs between the RTTOV-gb-simulated BTs and the observed ones from channels 1–14 in Figure 3c, the CORs are all above 0.9. This demonstrates that the RTTOV-gb has a good capability to simulate the brightness temperatures for GMWRs.
Since the RTTOV-gb has a good performance in simulating the BTs for GMWRs, it can serve as an observation operator for the direct assimilation of GMWR radiance data. Because the RTTOV-gb was developed based on the RTTOV v11.2 code, the RTTOV v11.2 interface in the WRFDA v3.9 was modified to enable the WRFDA system to call the RTTOV-gb.

3.3. The Direct Assimilation Module Build

To build a direct assimilation module for GMWR radiance data, the information about the HATPRO GMWR sensor and its channels (Table 2) was first included in the WRFDA’s radiance data assimilation module. Next, a data reading program for this sensor was added to the WRFDA system. Additionally, a quality control program was developed based on the characteristics of GMWR radiance data. The quality control schemes in this study are as follows:
① Rejecting the observations of the unused 1–4 and 7–10 channels;
② Removing rainy pixels in both the background and observation fields;
③ Dismissing observations with an innovation greater than 10 K;
④ Eliminating data with an innovation exceeding 3 times the observation error.
Finally, the radiance_info file for the HATPRO sensor containing its observation errors and channel selection information named ground_1_hatpro.info was added. The observation errors for the 14 channels were estimated based on the RMSEs between the simulated and observed BTs from the previous statistical analysis (Figure 3b). After establishing the direct assimilation module for the GMWR radiance data, a single-observation experiment was conducted to verify the accuracy of the module.

3.4. Single-Observation Experiment

The single-observation experiment is commonly used to test the accuracy of assimilation systems and the effectiveness of assimilation algorithms [31]. Therefore, a single-observation experiment at Station 54399 was conducted using radiance data from water vapor channel 5 and oxygen channel 12. The background error covariance matrix was calculated by the National Meteorological Center (NMC) method with a number of 24 h and 12 h forecasts launched at 0000UTC and 1200UTC over August 2019 [32]. The initial and boundary conditions used for the forecasts were provided by the FNL data. Control variable option 7 (CV7) with a UV wind control variable was applied in this study [33]; it includes u, v, temperature, pseudo-relative humidity (RHs), and surface pressure (Ps). The variance scale and length scale factor of the control variables were set to 0.75 and 0.25, respectively, to achieve more reasonable increment values and ranges. Additionally, the data assimilation method used in this study was the 3DVAR method.
The vertical cross-section of water vapor (Figure 4a) and temperature increments (Figure 4b) along 40°N show that the water vapor and temperature increments are mainly located in the lower levels, with the influence of water vapor reaching up to 400 hPa. The GMWR temperature and water vapor channels’ weight functions are mainly below 400 hPa [34,35]. Therefore, the water vapor and temperature increments are consistent with the peak heights of the channels’ weight functions. As a result, the horizontal increment maps for temperature (Figure 4c) and water vapor (Figure 4d) at 925 hPa were plotted for further analysis. Figure 4c,d demonstrates that the increments distribute concentrically around the observation and reflect the isotropic structural characteristics of the background error covariance, which is consistent with the features of the 3DVar method. Additionally, the maximums of the water vapor and temperature increments are both at the observation center, and their values are 0.035 g/kg and 0.3 °C, respectively. This was verified by the observations.
The results of the single-observation experiment demonstrate that the newly constructed assimilation module in the WRFDA can directly assimilate radiance data from GMWRs.

4. Direct Assimilation Experiment

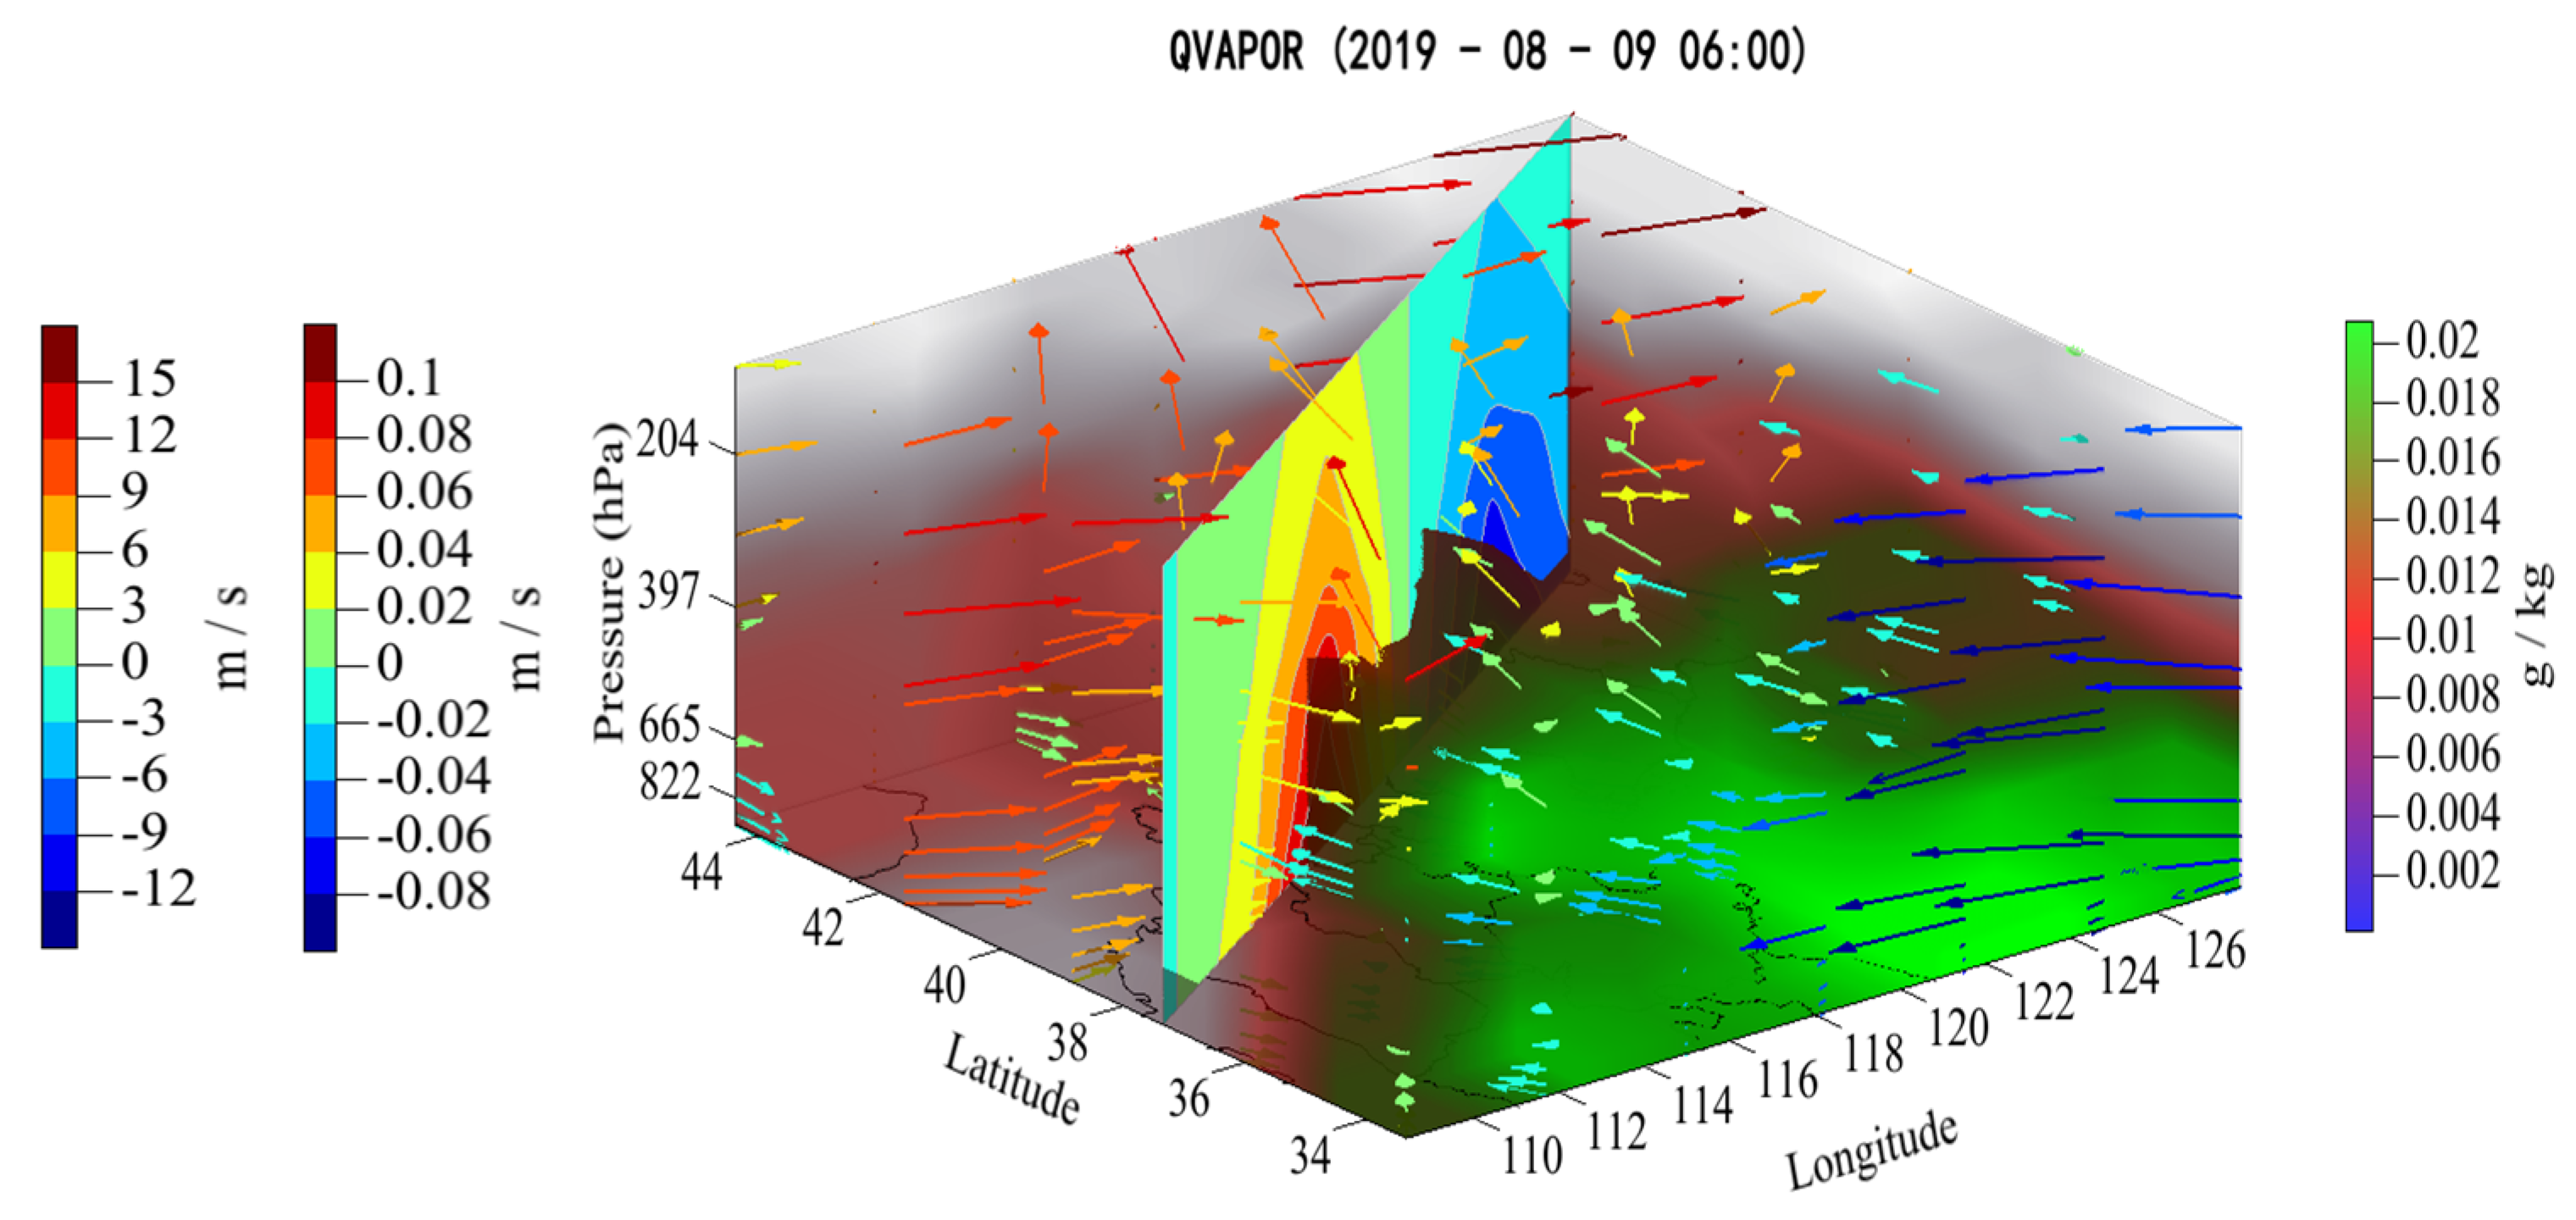
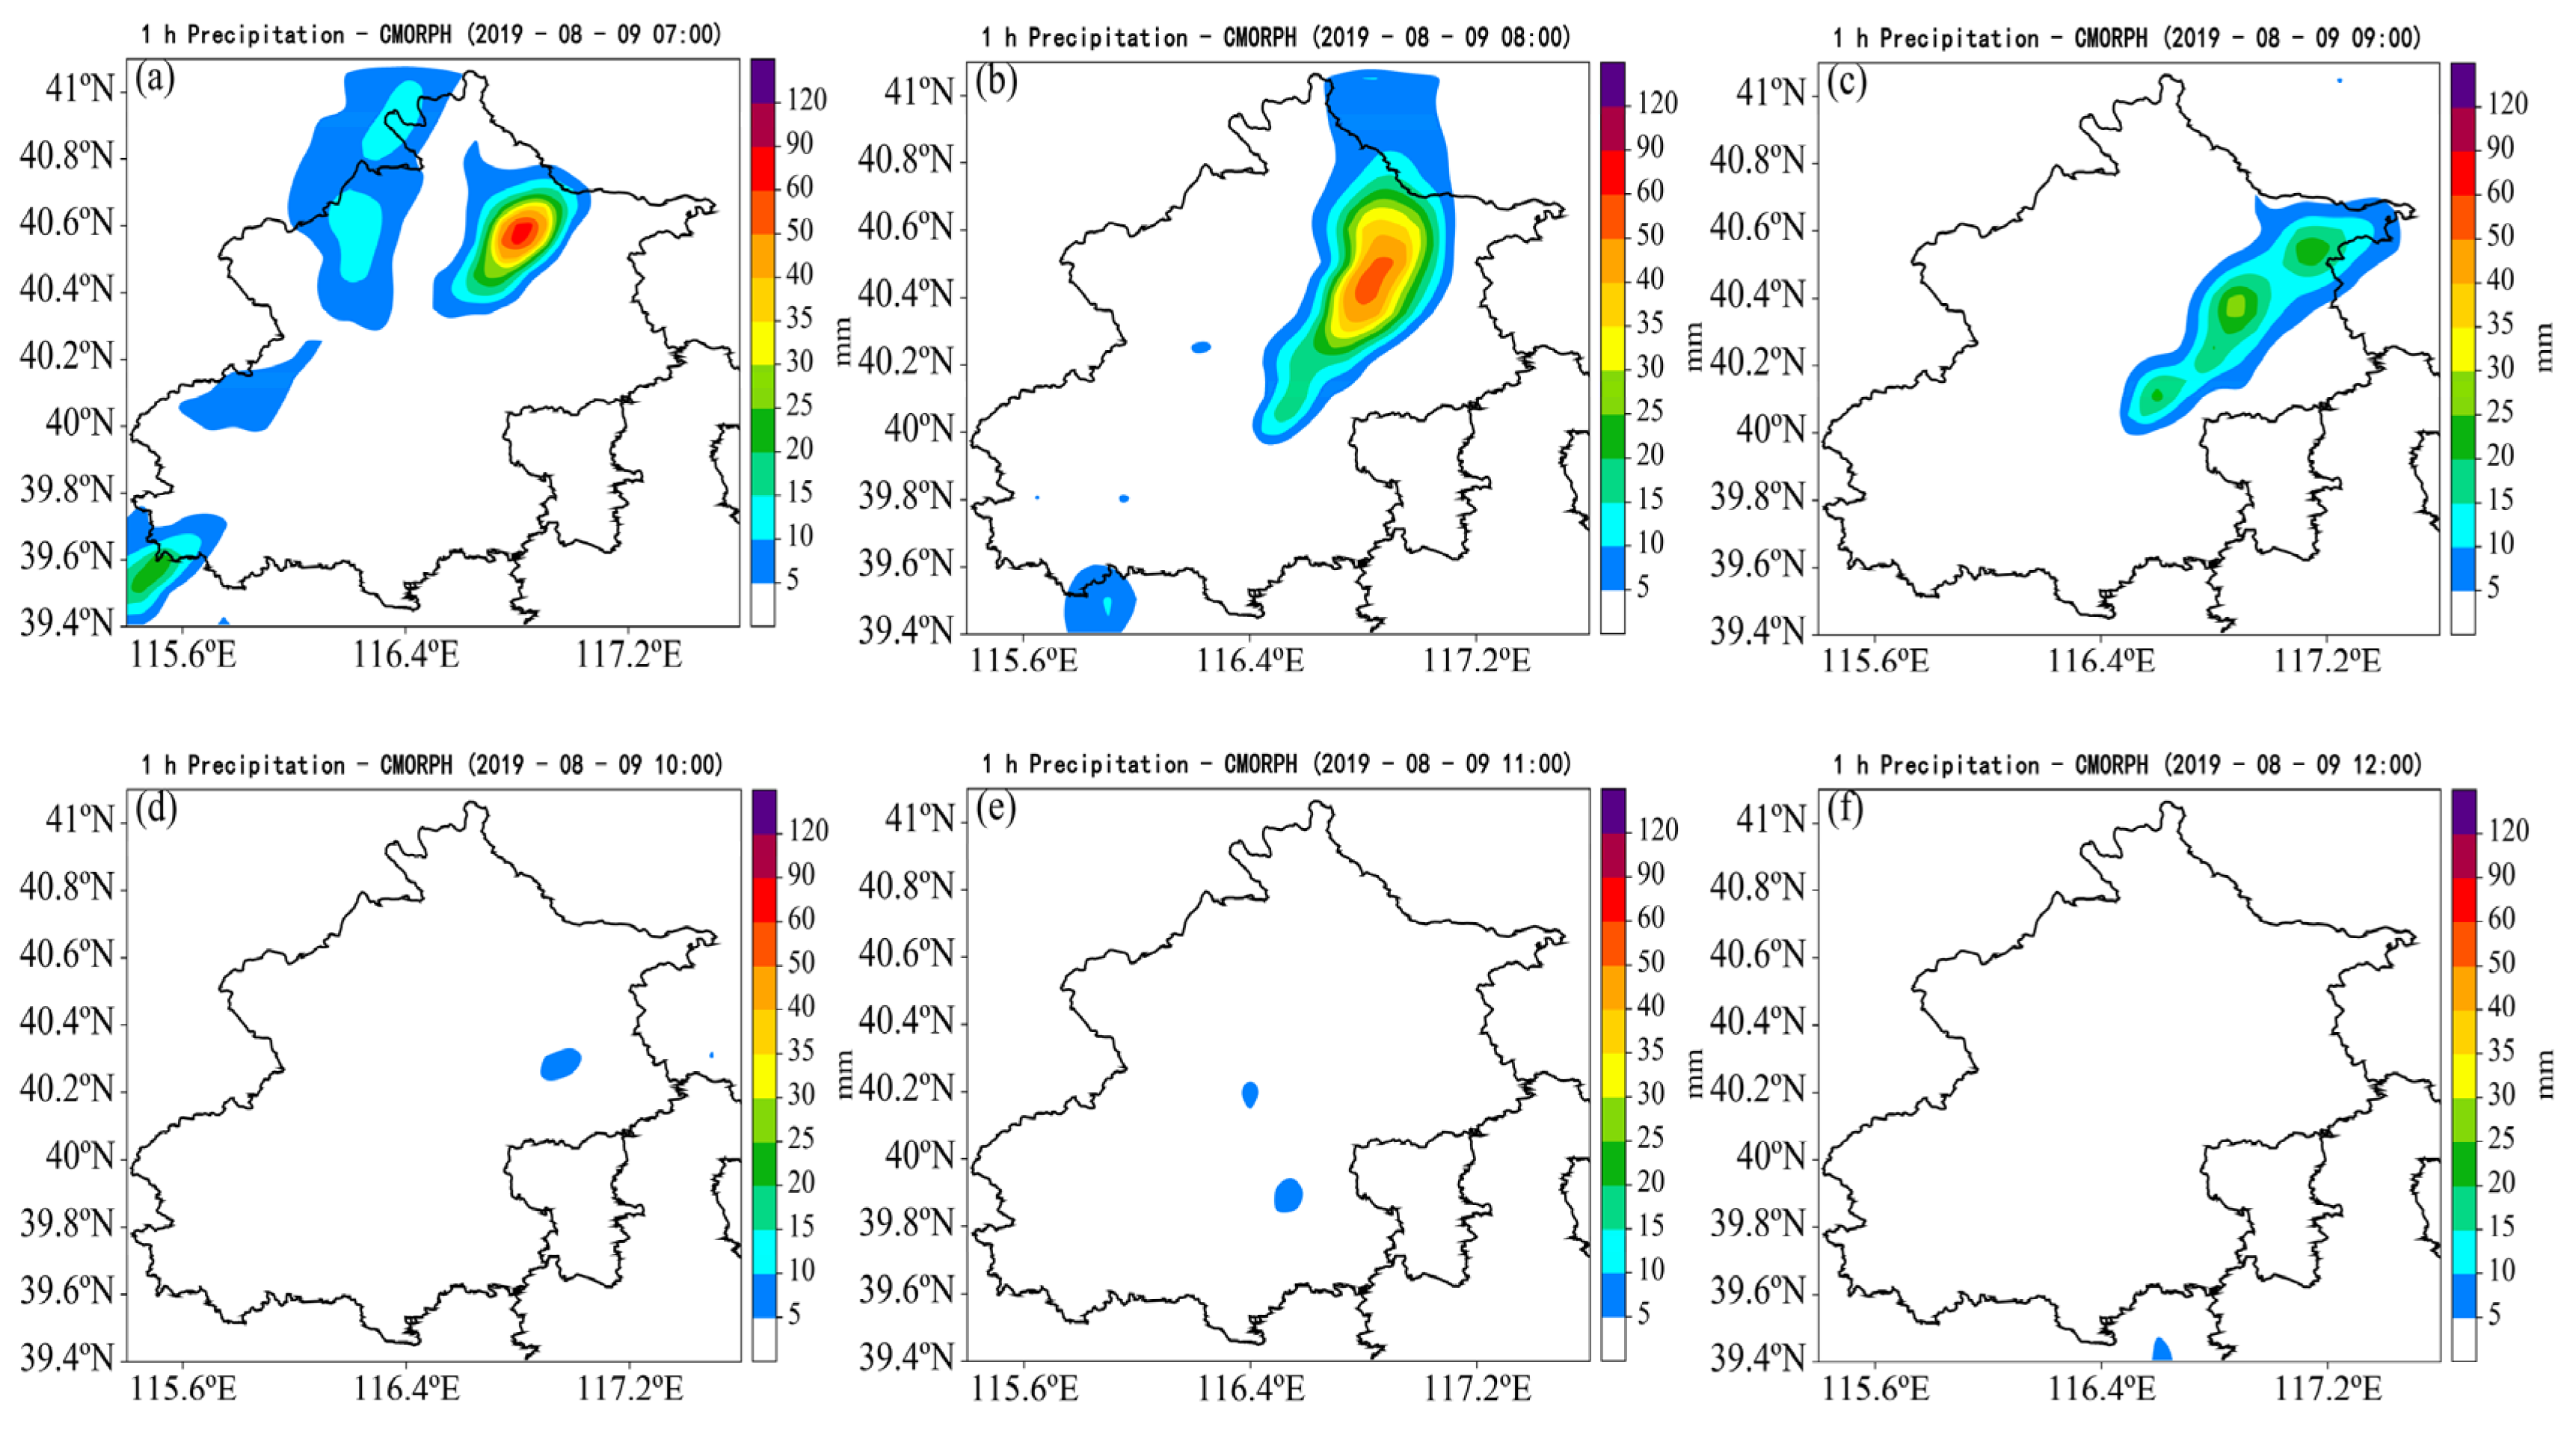
4.1. The Heavy Rainfall Case

Considering the location of the GMWR network, the extremely heavy precipitation that occurred from 0600 UTC to 1200 UTC on 9 August 2019 in Beijing was selected as the case. This precipitation event happened during the landfall of Typhoon Lekima (2019), which was located ahead and left of the typhoon’s moving track. As shown in Figure 5, there was a high concentration of water vapor in the southeast of Beijing. Because of the large amount of water vapor carried by the typhoon’s peripheral cloud clusters and the strong southeasterly airflow in its peripheral circulation, a significant amount of water vapor was transported to Beijing, making a positive impact on the heavy rainfall. Additionally, the vertical velocity in Beijing’s precipitation area showed a strong upward motion in the middle and low levels with the vertical velocity value exceeding 0.1 m/s below 850 hPa, which makes for a dynamic contribution for the precipitation. Therefore, the ample water vapor combined with the strong upward movement resulted in this extreme precipitation.
The hourly rainfall distributions (Figure 6) demonstrate that the centers of the heavy rainfall were primarily located in northeastern Beijing. The maximum hourly precipitation occurred during the period of 0700 UTC–0800 UTC on 9 August (Figure 6b) with a maximum exceeding 60 mm and reaching the level of a particularly heavy rainstorm. Furthermore, the precipitation was mainly produced from 0700 UTC to 0900 UTC (Figure 6b,c). This indicates that the precipitation event had a high intensity and short duration, representing a typical rainfall process over north China.

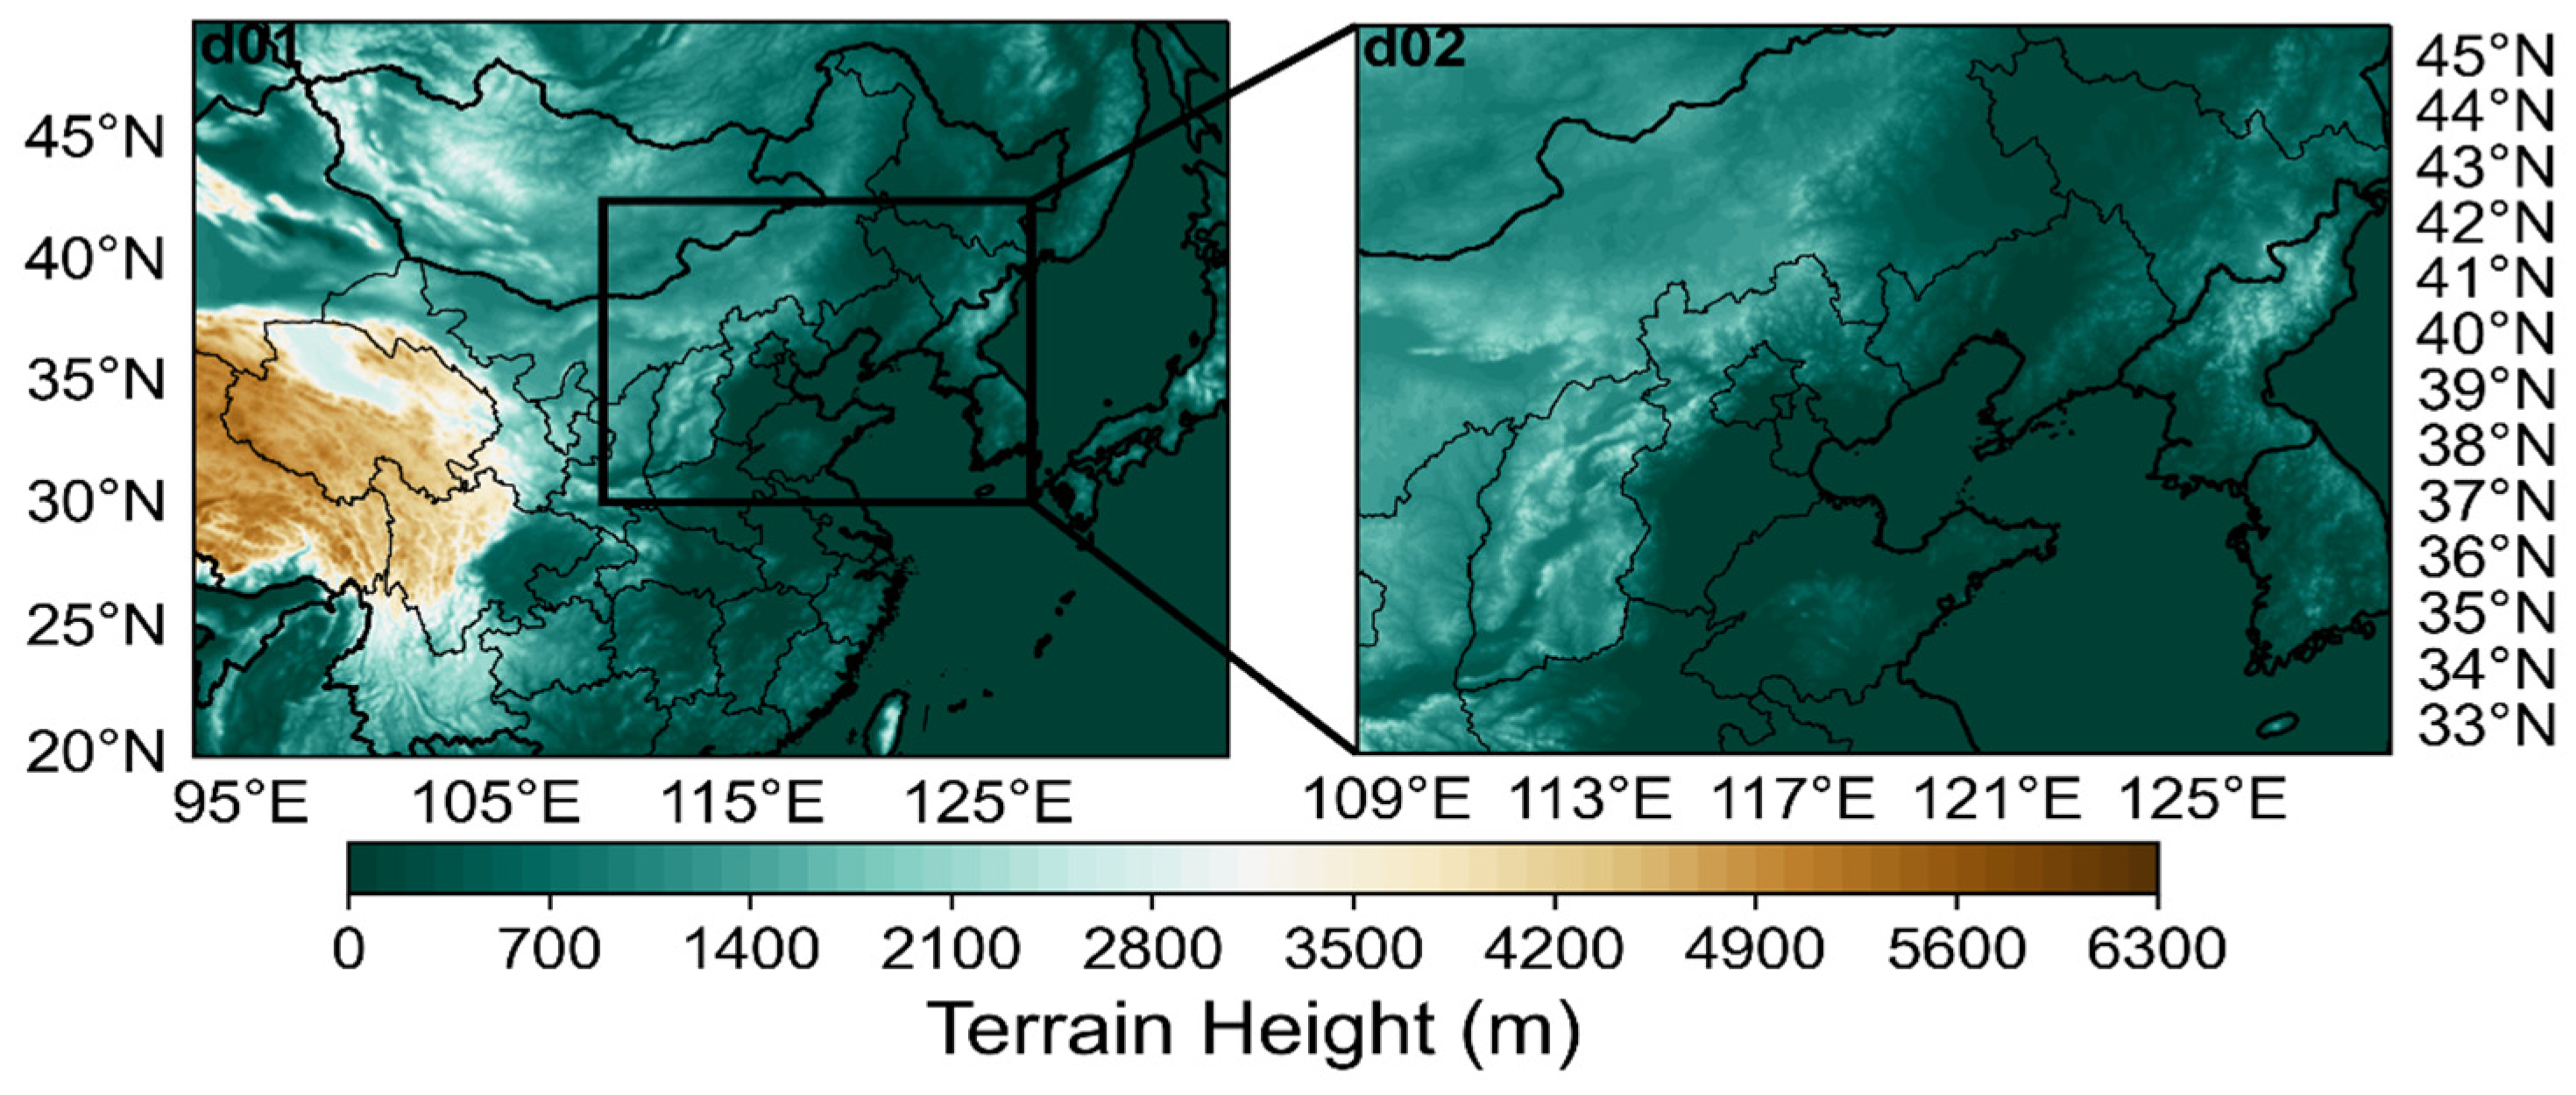
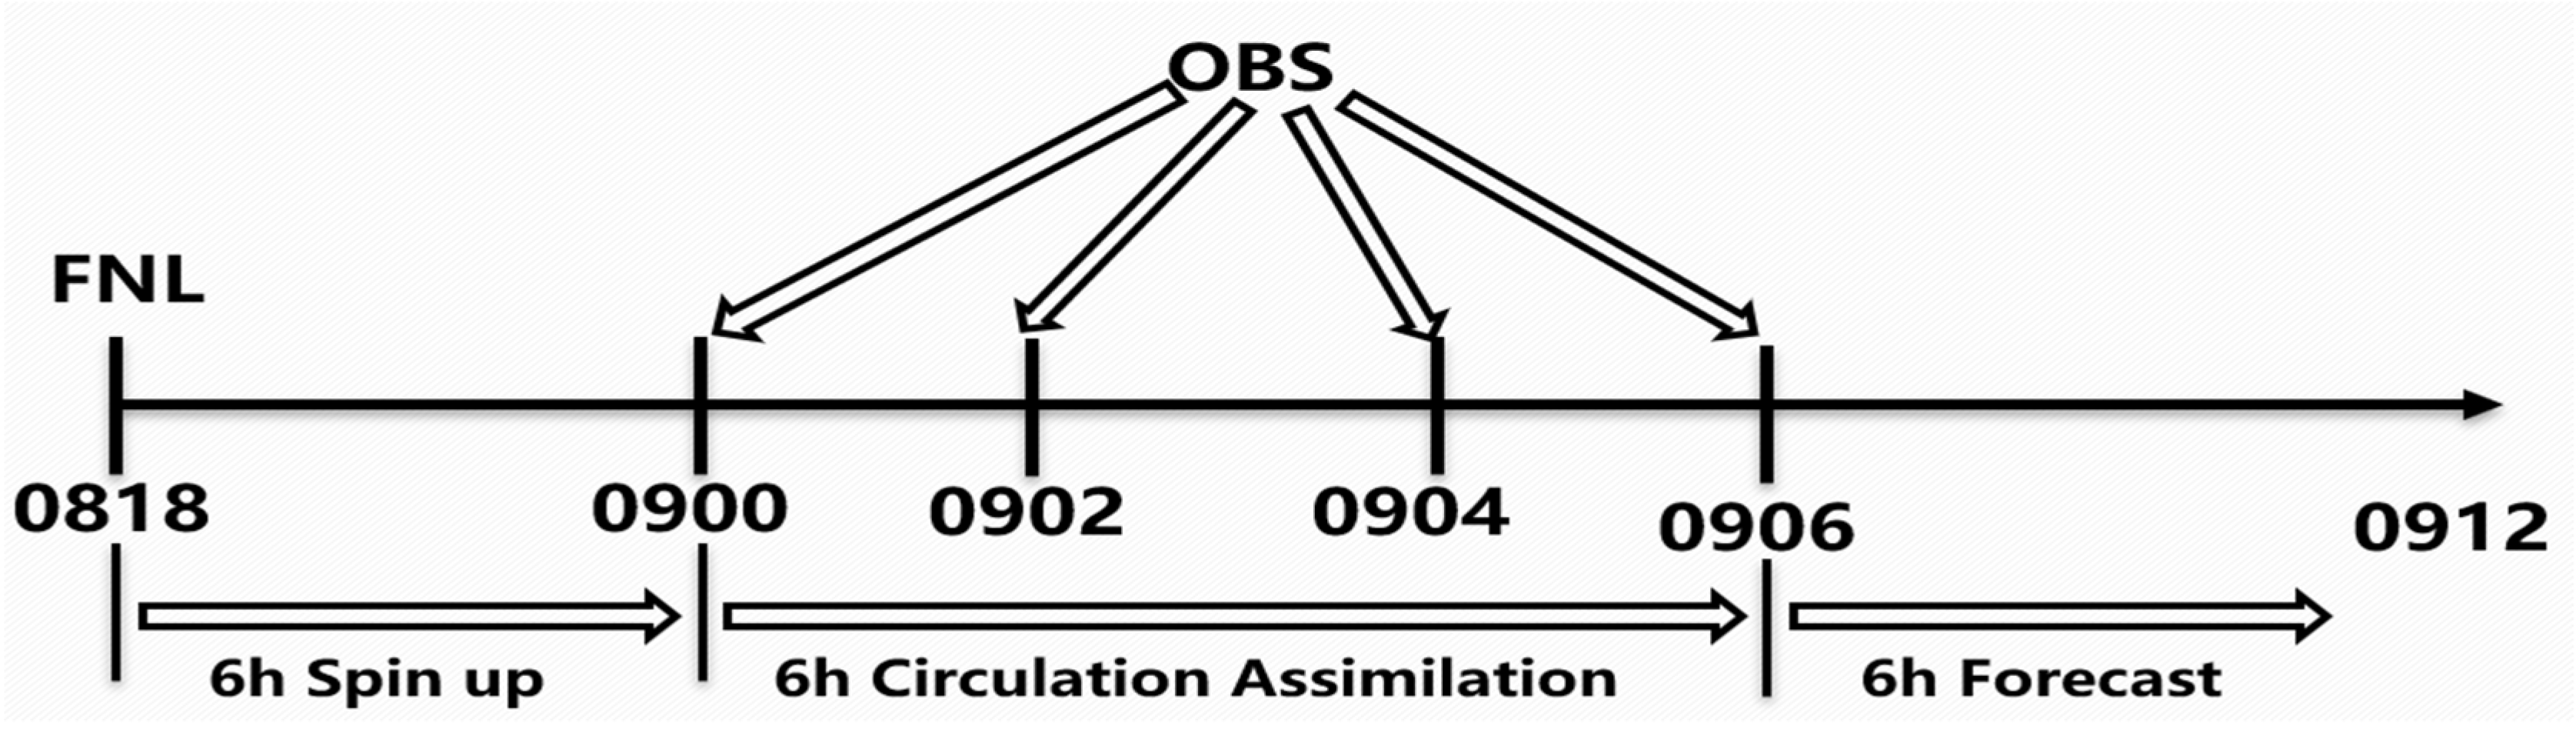
4.2. Model Configurations and Experimental Design

In this study, WRFv3.9 and the associated WRFDA-3DVAR system were used to carry out the experiment. The two nested domains for the simulation are shown in Figure 7. Domain 1 (d01) had 501 × 391 grid points (9 km), while domain 2 (d02) had 622 × 481 grid points (3 km). Both domains had 51 vertical levels and a model top of 50 hPa. The following parameterization schemes were set: the WSM6 microphysics scheme, Yonsei University (YSU) planetary boundary layer scheme, Noah land–surface model, rapid radiative transfer model (RRTM) longwave radiance scheme, and Goddard shortwave radiance scheme. The d01 cumulus scheme uses Kain–Fritsch, but in the d02, cumulus parameterization is switched off.
The experiment started at 1800 UTC on 8 August 2019. A 6 h spin-up run was conducted before the data assimilation. To evaluate the influences of the direct assimilation of GMWR radiance data on the analysis and forecast, three different experiments were performed (as shown in Table 3): the control experiment without data assimilation (CTRL), the indirect assimilation experiment with temperature and humidity profiles data from 7 GMWRs (MWR_DA), and the direct assimilation experiment with radiance data from 7 GMWRs (DIR_DA). As depicted in Figure 8, the assimilations were performed with 2 h data assimilation cycling (DA cycling) during 0000–0006 UTC on 9 August 2019. Finally, a 6 h forecast was carried out from 0006 UTC on 9 August 2019 onwards.

5. Results

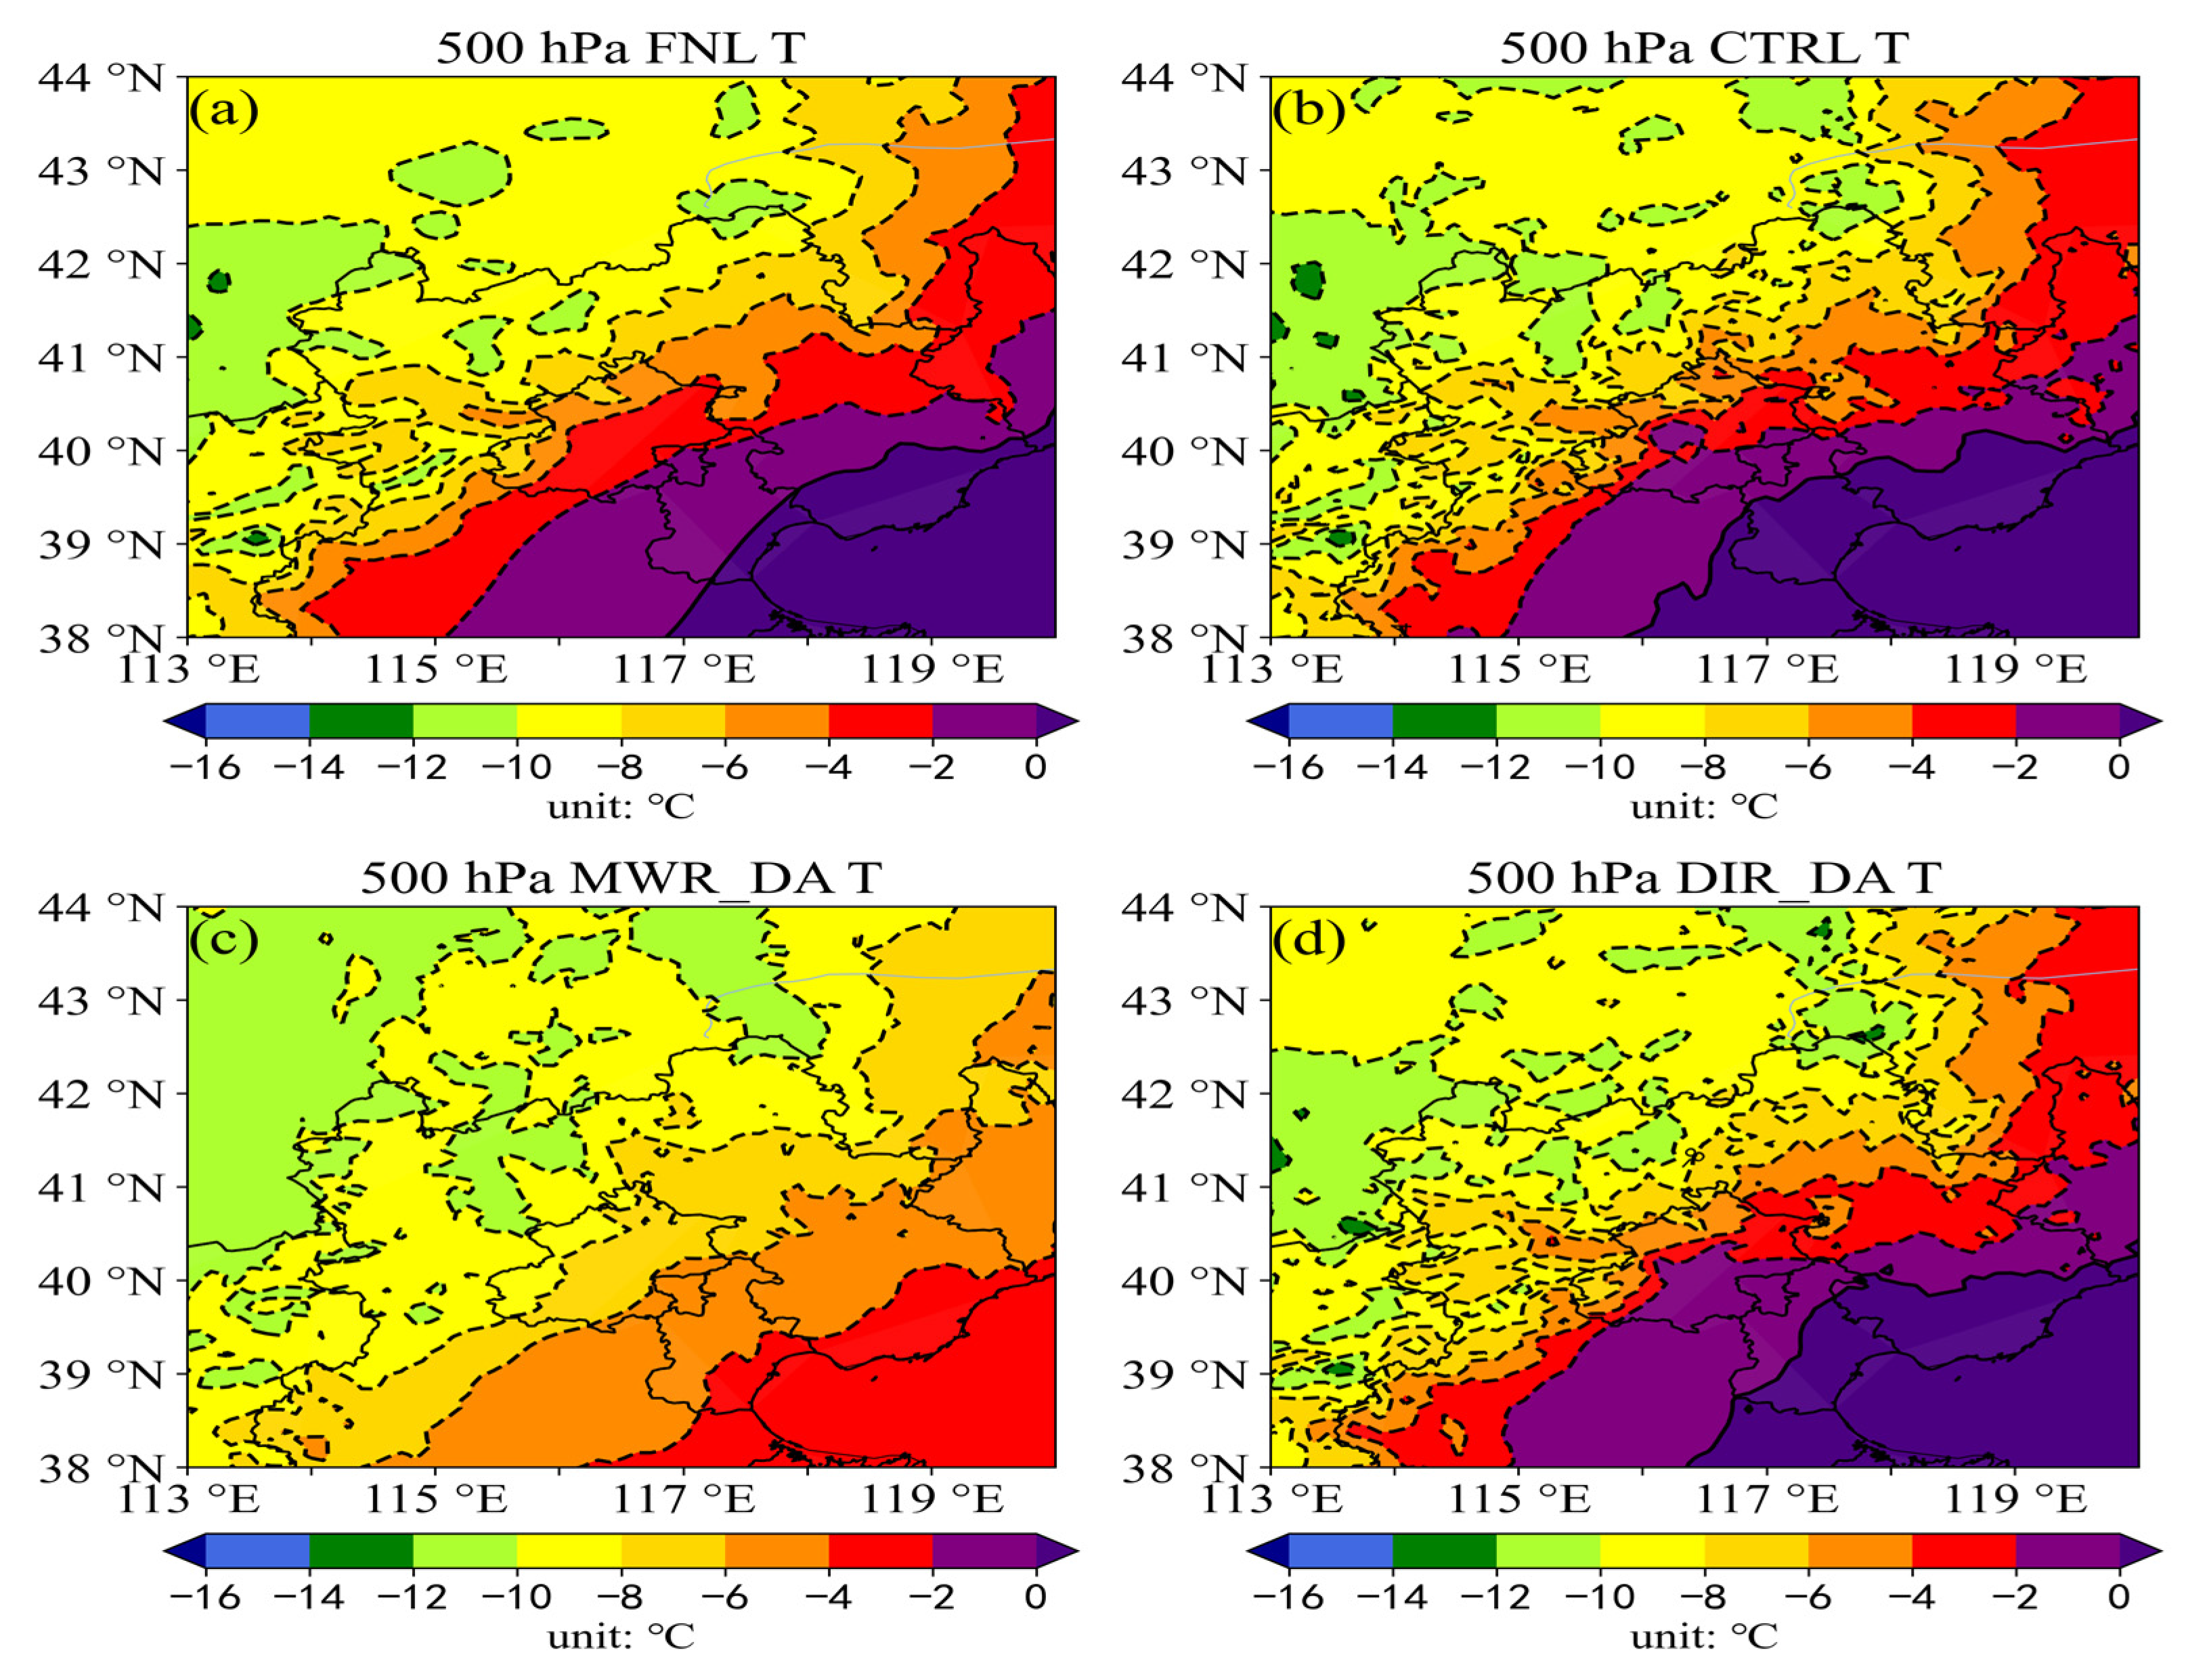
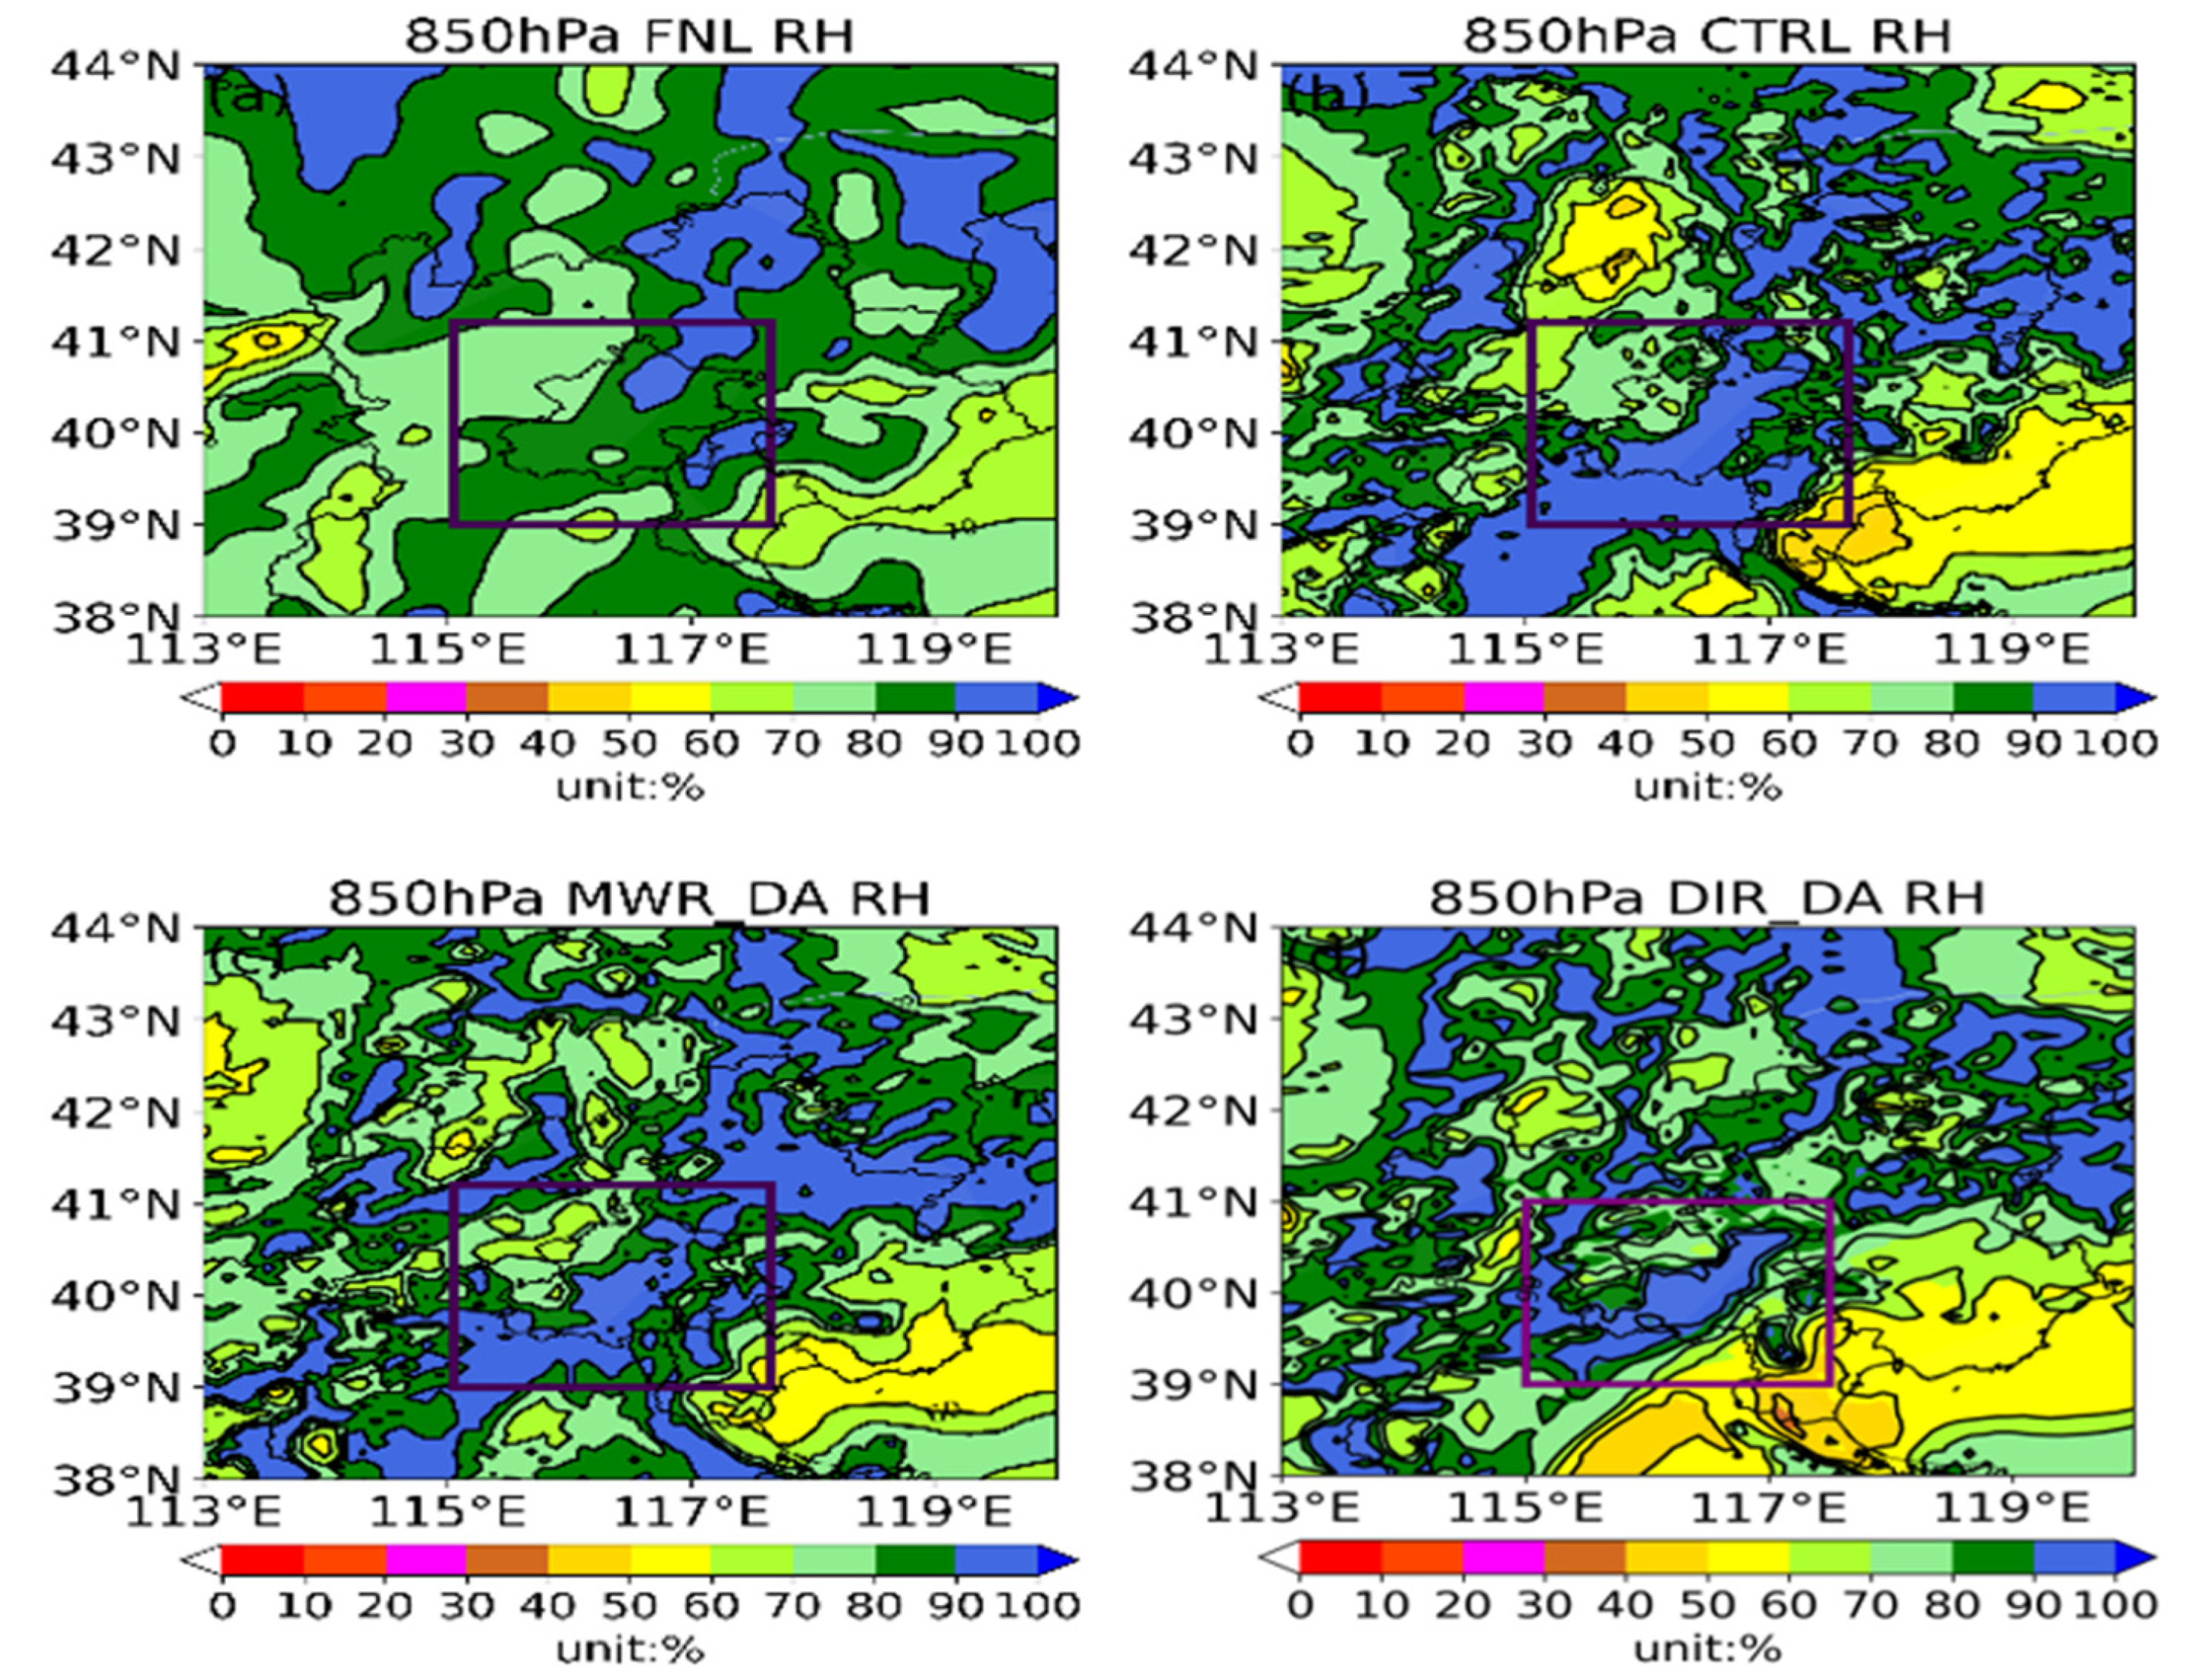
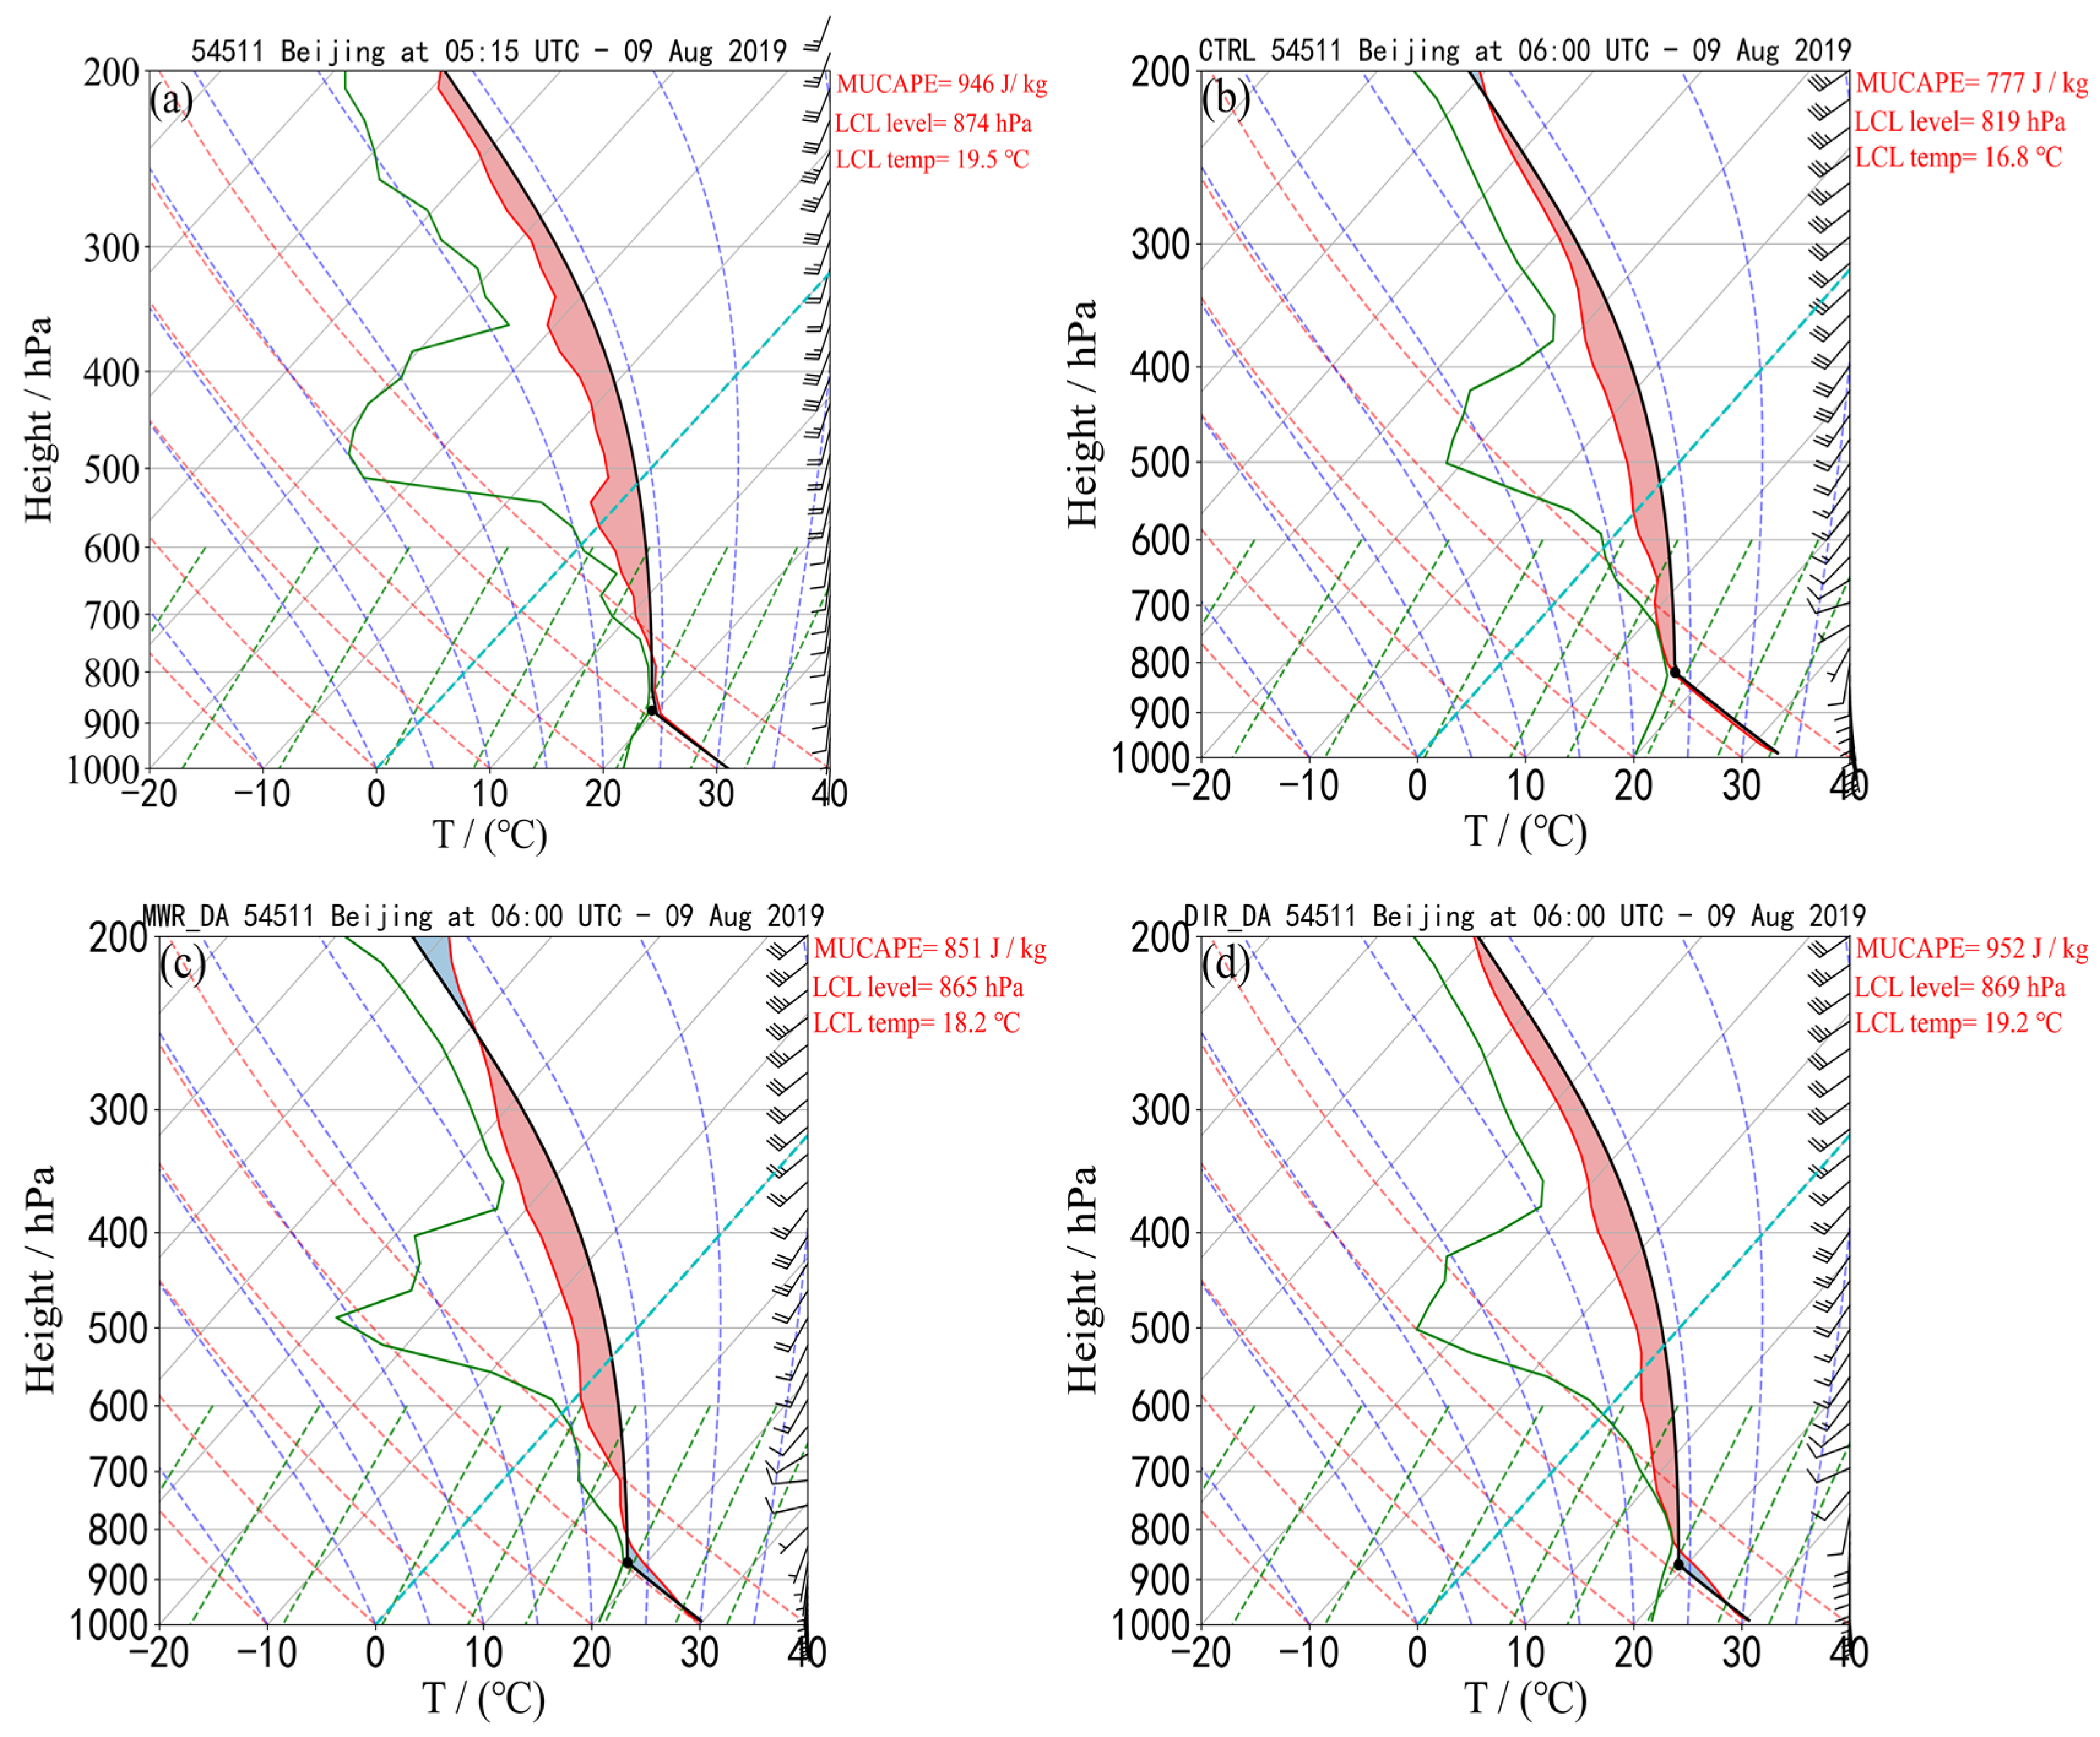
5.1. The Impact on the Temperature and Humidity Analysis Fields

To study the impact of indirect assimilation and direct assimilation of GMWR data on the simulation of this heavy rainfall event, the temperature field at 500 hPa (Figure 9) and relative humidity field at 850 hPa (Figure 10) after the last analysis time at 0006 UTC on 9 August was selected. From the FNL analysis field at 0006 UTC on 9 August (Figure 9a), it can be seen that the temperature isotherms decreased from southeast to northwest with a relatively uniform distribution that is basically parallel. Figure 9b shows the temperature field for the CTRL experiment. Its temperature isotherms are consistent with those of the FNL analysis field except in the southeastern region of Beijing where temperatures were slightly higher. At the same time, in the southwestern region of Beijing, the CTRL experiment’s isotherms were denser than those in the FNL analysis field. This led to instability at 500 hPa in the CTRL experiment, which is conducive to precipitation [36]. Figure 9c,d includes both assimilation experiments. Compared to the CTRL experiment, their isotherm positions and sparsity were more consistent than in the FNL analysis field. However, after indirectly assimilating the GMWR data into the MWR_DA experiment, the initial temperature field was lower than the FNL analysis field by 4 °C (Figure 9c), resulting in larger errors in the model initial temperature fields and making the whole layer structure more stable than in the CTRL experiment due to lower temperatures since the CTRL experiment’s initial temperature field was closer to the FNL analysis field, and the DIR_DA experiment had smaller changes in the temperature fields after assimilation but was also closer to the FNL analysis field. Although the DIR_DA experiment had a slight improvement in temperature fields, it was better at simulating the T fields.
Water vapor conditions are one of the key factors in the formation of heavy rain [37,38]. An accurate initial water vapor field in weather models is crucial for making correct heavy rain forecasts. From the relative humidity field at 850 hPa in the FNL data at 0006 UTC on 9 August (Figure 10a), it can be seen that the area with a high relative humidity was mainly located in the northeast region of Beijing, which was where this heavy rain occurred. However, in the CTRL experiment (Figure 10b), the initial relative humidity field at this time was obviously too large in scope, causing precipitation forecasts to be significantly overestimated and high relative humidity areas to coincide with precipitation areas. Although the MWR_DA experiment (Figure 10c) slightly improves the initial relative humidity field at 850 hPa after assimilating the GMWR temperature and humidity profile data, the changes are small, and the high relative humidity area is still too large. In contrast, the DIR_DA experiment (Figure 10d) greatly improves the original CTRL experiment’s relative humidity field after directly assimilating the GMWR BT data and effectively reduces the problem of an excessively large high relative humidity area. This shows that direct assimilation can more effectively improve the model’s initial relative humidity field compared to indirect assimilation.
A T-lnP diagram (temperature–logarithmic pressure diagram), also known as a sounding diagram, can intuitively reflect the vertical distribution of temperature and humidity elements above a meteorological station. It is often used to analyze strong convection and serves as a tool for assessing atmospheric stability. To comparatively and more intuitively observe the impact of the assimilation experiments on the temperature and humidity elements throughout the entire layer, we selected sounding data from Beijing Station 54511 at 0006 UTC on 9 August 2019 for a comparative analysis of the impact of the assimilation experiments on the temperature and humidity fields throughout the entire layer. From the actual sounding data at Station 54511 on 9 August (Figure 11a), it can be observed that the atmosphere above the station exhibited a typical convective unstable stratification. At 500 hPa, there was a significant temperature–dew point difference, indicating relatively dry and cold air at this level. Additionally, at 900 hPa, the temperature–dew point difference approached zero, indicating warm and moist air in the lower levels. Therefore, the atmosphere above the station displayed an upper layer of dry and cold air and a lower layer of warm and moist air, indicating a typical convective unstable stratification. The lifting condensation level was 874 hPa. From the lifting condensation level to near 700 hPa, the temperature–dew point difference throughout the entire air layer was close to zero, indicating that the water vapor in this layer was basically in a saturated state. Near 500 hPa, the temperature–dew point difference was large, indicating that the air in this layer was dry. Therefore, the entire layer was convectively unstable, and the MUCAPE value at this time was large at 947 J/kg, providing significant energy for strong convection.
From the T-lnP diagram of the CTRL experiment (Figure 11b), it can be seen that at 0006 UTC on 9 August, the lifting condensation level in the initial field of the model is higher by 50 hPa compared to the actual observation. This indicates that the near-surface air relative humidity in the CTRL experiment is low, causing an increase in height required for air parcel saturation. At the same time, the temperature–dew point differences in the high-altitude areas are smaller than the actual observations. As a result, the convective instability is smaller than the actual observations due to drier conditions below and moister conditions above. Additionally, the convective available potential energy (CAPE) in the initial field of the CTRL model is 777 J/kg, which is much lower than the actual observations (946 J/kg). In contrast, both the direct assimilation (DIR_DA) and indirect assimilation (MWR_DA) experiments effectively improved the humidity fields in the lower level of the initial fields (Figure 11c,d), which makes the CAPE much closer to the actual observations. This increased the relative humidity compared to the CTRL experiment and lowered the lifting condensation levels closer to the actual observations, making convection easier to trigger. However, direct assimilation (DIR_DA) shows more significant improvements over indirect assimilation (MWR_DA) with lifting condensation levels and temperature, as well as CAPE, closer to actual observations. Furthermore, DIR_DA resulted in a free convection level consistent with actual observations of around 200 hPa, while MWR_DA lowered the free convection level by nearly 50 hPa compared to the CTRL experiment. This makes it difficult for stronger convective development and does not improve high-altitude atmospheric elements while increasing the deviation from the actual observations. This may be related to larger errors in the high-altitude inversion of the GMWR data. Therefore, direct assimilation (DIR_DA) is more effective than indirect assimilation (MWR_DA) at improving temperature and moisture fields throughout the initial model fields.
A comparison of the effects of direct and indirect assimilation on the analysis temperature and humidity fields of a model reveals that direct assimilation is more effective at improving the model’s initial field, particularly its humidity field. In contrast, indirect assimilation not only fails to enhance the model’s initial field but also increases its error. This can largely be attributed to the data inversion during indirect assimilation, which can introduce significant errors. Direct assimilation avoids such errors by bypassing inversion and directly assimilating raw data into the model.

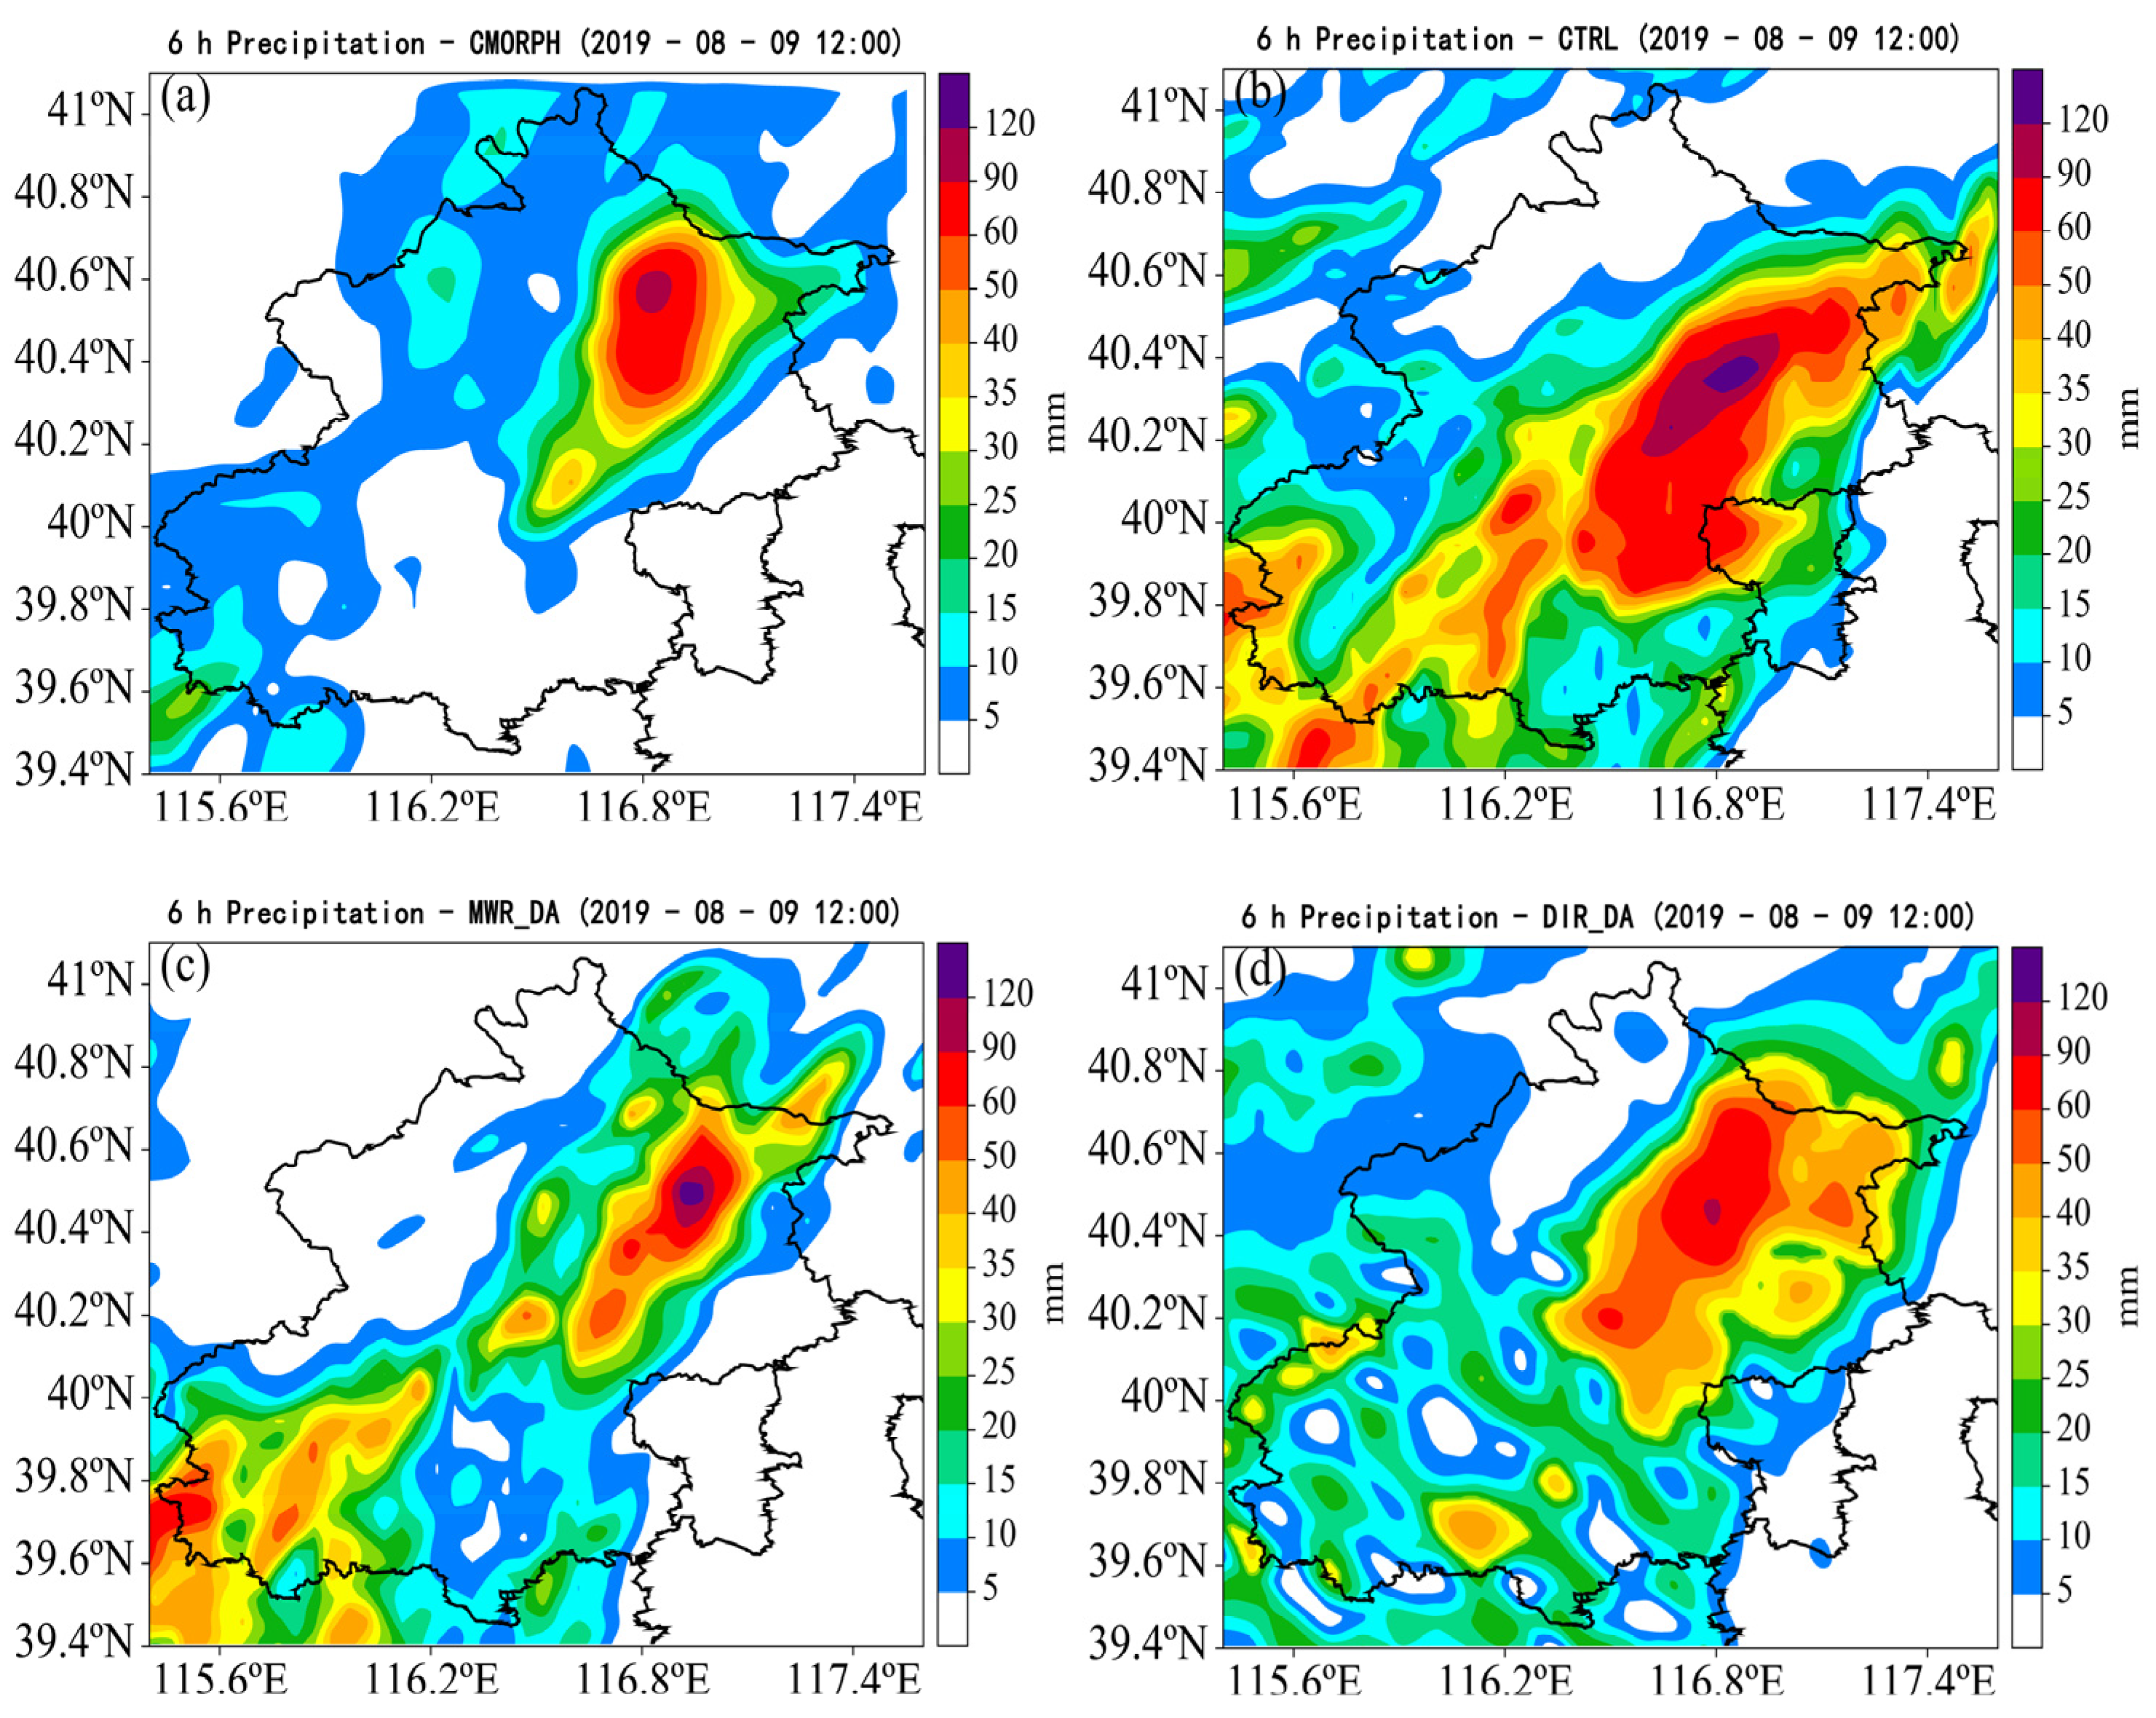
5.2. Impact on 6 h Accumulated Precipitation in Beijing Area

Given that GMWR data are available only in the Beijing area and that this heavy rain event occurred primarily in Beijing, we focused our study on the impact of assimilating such data into 6 h accumulated precipitation forecasts in this region. An examination of the actual precipitation map for Beijing (Figure 12a) reveals a primary precipitation center located in Miyun District with a maximum 6 h accumulated precipitation exceeding 90 mm. A secondary precipitation center south of this location also exhibited a 6 h accumulated precipitation exceeding 40 mm.
According to the 6 h cumulative precipitation forecast map from the CTRL test (Figure 12b), both the primary and secondary precipitation centers were predicted. However, the forecasted 6 h cumulative precipitation amounts for both centers were excessive, and their locations were shifted southward. Additionally, a large false precipitation center emerged in Beijing’s southwest region. In contrast, the MWR_DA test (Figure 12c) demonstrates significant improvement in its 6 h cumulative precipitation forecast compared to the CTRL. Both the primary and the secondary precipitation centers’ magnitudes and locations are more accurate, effectively reducing false reports at the primary precipitation locations in the CTRL. Although the primary precipitation center’s range is slightly smaller than the observation, its location is consistent with the observation, and the secondary precipitation center’s location is close to the observation with a magnitude slightly larger than that of the actual rainfall. Secondly, compared to the CTRL’s generation of a large false precipitation center in southwest Beijing due to terrain effects, MWR_DA effectively reduces false reports.
The DIR_DA test (Figure 12d), which directly assimilates data from the GMWRs’ BTs, demonstrates significant improvement in reducing false reports of 6 h cumulative precipitation and correcting southward shifts of precipitation center locations compared to the MWR_DA test. The magnitude and location of the 6 h cumulative precipitation forecast in the DIR_DA test are more consistent with both the observations and MWR_DA test results. Additionally, it effectively reduces false precipitation in southwest Beijing. As such, both indirect and direct assimilation of GMWR data can effectively enhance the model’s 6 h cumulative precipitation forecast, with direct assimilation yielding better results than indirect assimilation.
To quantitatively assess the ability of three experimental groups to forecast precipitation at different magnitudes, three experiments were conducted using TS precipitation scores for accumulated precipitation over time (Figure 13). The figure shows that when the precipitation threshold is 7.5 mm (Figure 13), the DIR_DA experiment’s TS precipitation score is lower than that of the CTRL experiment as the forecast time progresses. Additionally, during the first 4 h of forecasting, the MWR_DA experiment’s TS precipitation score is also lower than that of the CTRL experiment. This suggests that the assimilation experiments do not significantly improve the forecasts for small amounts of rainfall. Similarly, when the threshold is 15 mm (Figure 13b), the assimilation experiments TS precipitation scores only surpass those of the CTRL experiment after 5 h of the forecast. This indicates that for medium and small amounts of rainfall, the assimilation experiments primarily improve forecasts after 5 h have passed. When the threshold exceeds 30 mm (Figure 13c,d red line), it can be observed that at the beginning of forecasting, its TS precipitation score improves significantly compared to both the CTRL and MWR_DA experiments and continues until the forecast ends. The improvement becomes more pronounced as the thresholds increase. This demonstrates that directly assimilating GMWR data mainly improves model rainfall forecasts in areas with larger magnitudes; i.e., there are significant improvements in forecasting heavy rain or rainstorm levels, and the improvement increases as the rainfall increases, which is superior to indirectly assimilating GMWR data.

6. Discussion

At present, this study has only achieved the direct assimilation of clear-sky radiation BT data from GMWRs. During the assimilation process, the data from cloud and precipitation areas were discarded. However, for weather processes, the data from cloud and precipitation areas are crucial. Therefore, our future goal is to achieve the all-sky assimilation of GMWRs.
Furthermore, currently, there are few GMWR stations in China, and their distribution is scattered. Therefore, the impact of direct or indirect assimilation is too small, or it is difficult to fully utilize the value of these data. However, in the future, when the network of GMWRs is established, these data will play a significant role in short-term weather warnings and improve the forecast of the models.
Finally, this study only compared the effects of direct assimilation and indirect assimilation based on a single heavy precipitation case and concluded that direct assimilation performed better than indirect assimilation. However, this conclusion may not be universally applicable. In the future, batch experiments should be conducted to validate these findings.

7. Conclusions

This paper investigates the application of direct assimilation for GMWR clear-sky radiation (brightness temperatures) BTs. Firstly, the RTTOV-gb was selected as the observation operator for direct assimilation, and its ability to simulate GMWR BTs was tested. Then, the RTTOV-gb operator was used to build a direct assimilation module for GMWR radiance data using the WRFDA v3.9, and a single-point experiment was conducted. Finally, the simulation results of the GMWR radiance direct assimilation experiment were compared to the indirect assimilation experiment using a heavy rainfall case study in Beijing. Our findings are as follows:
(1)
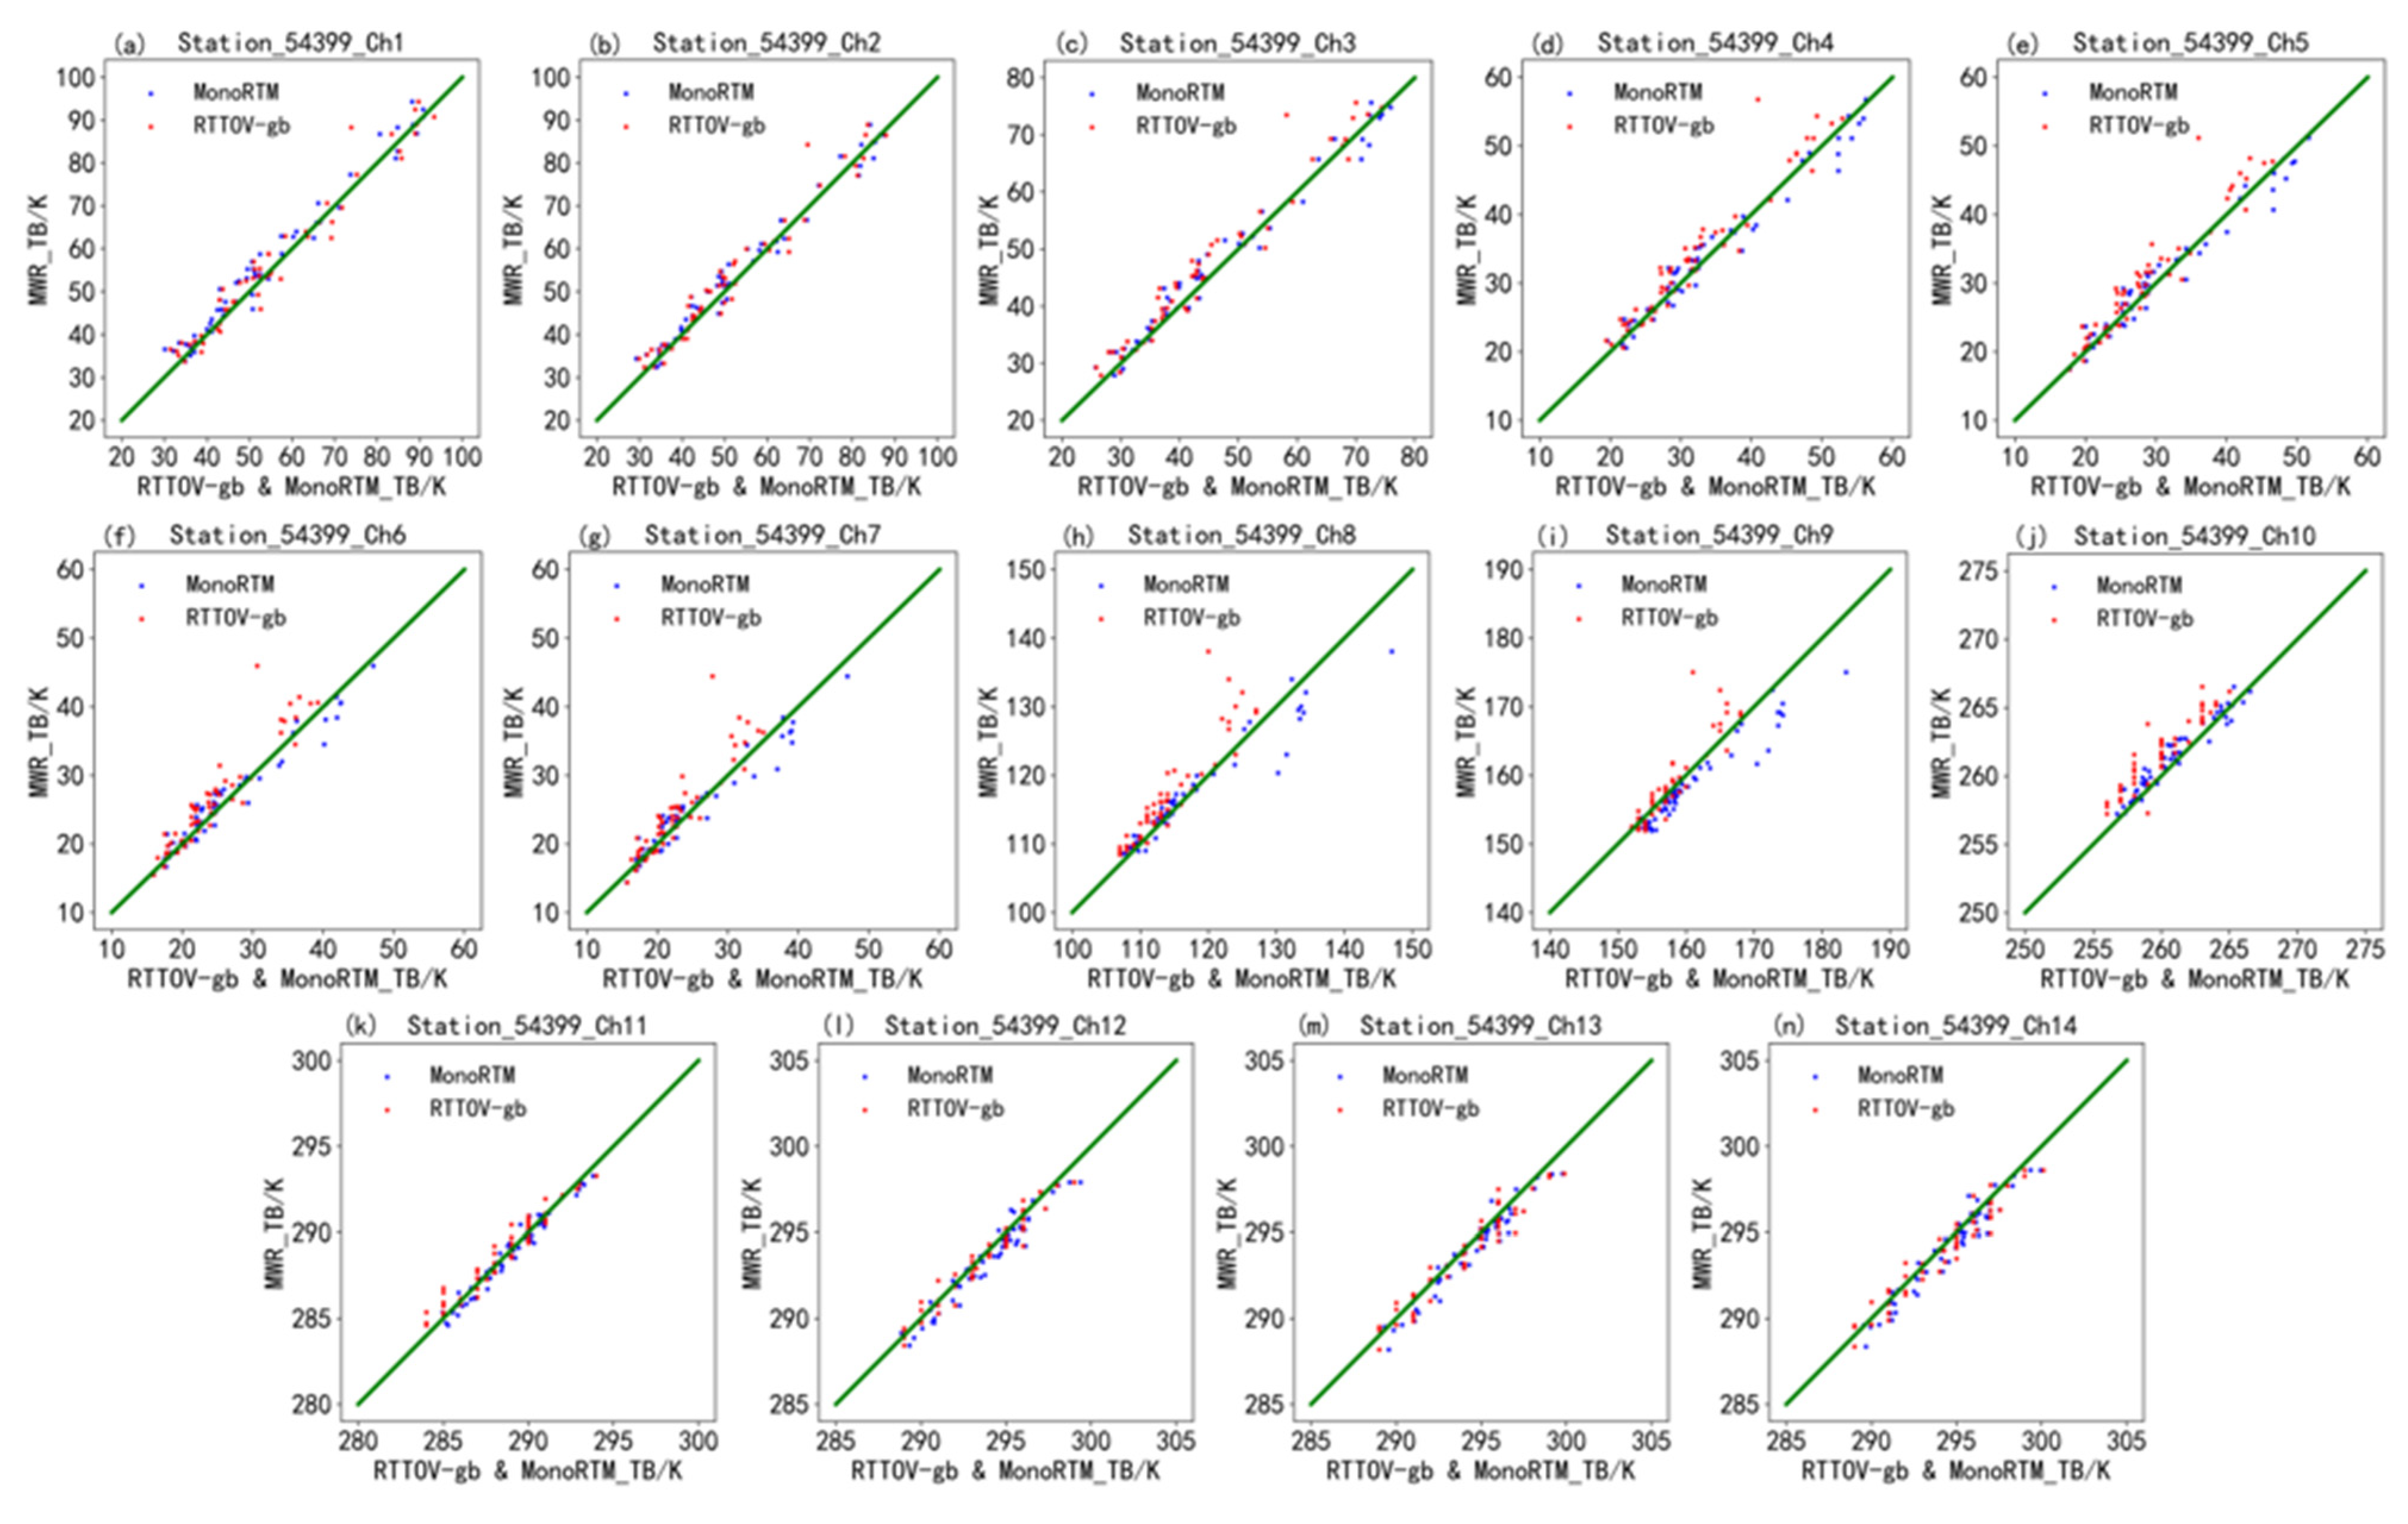
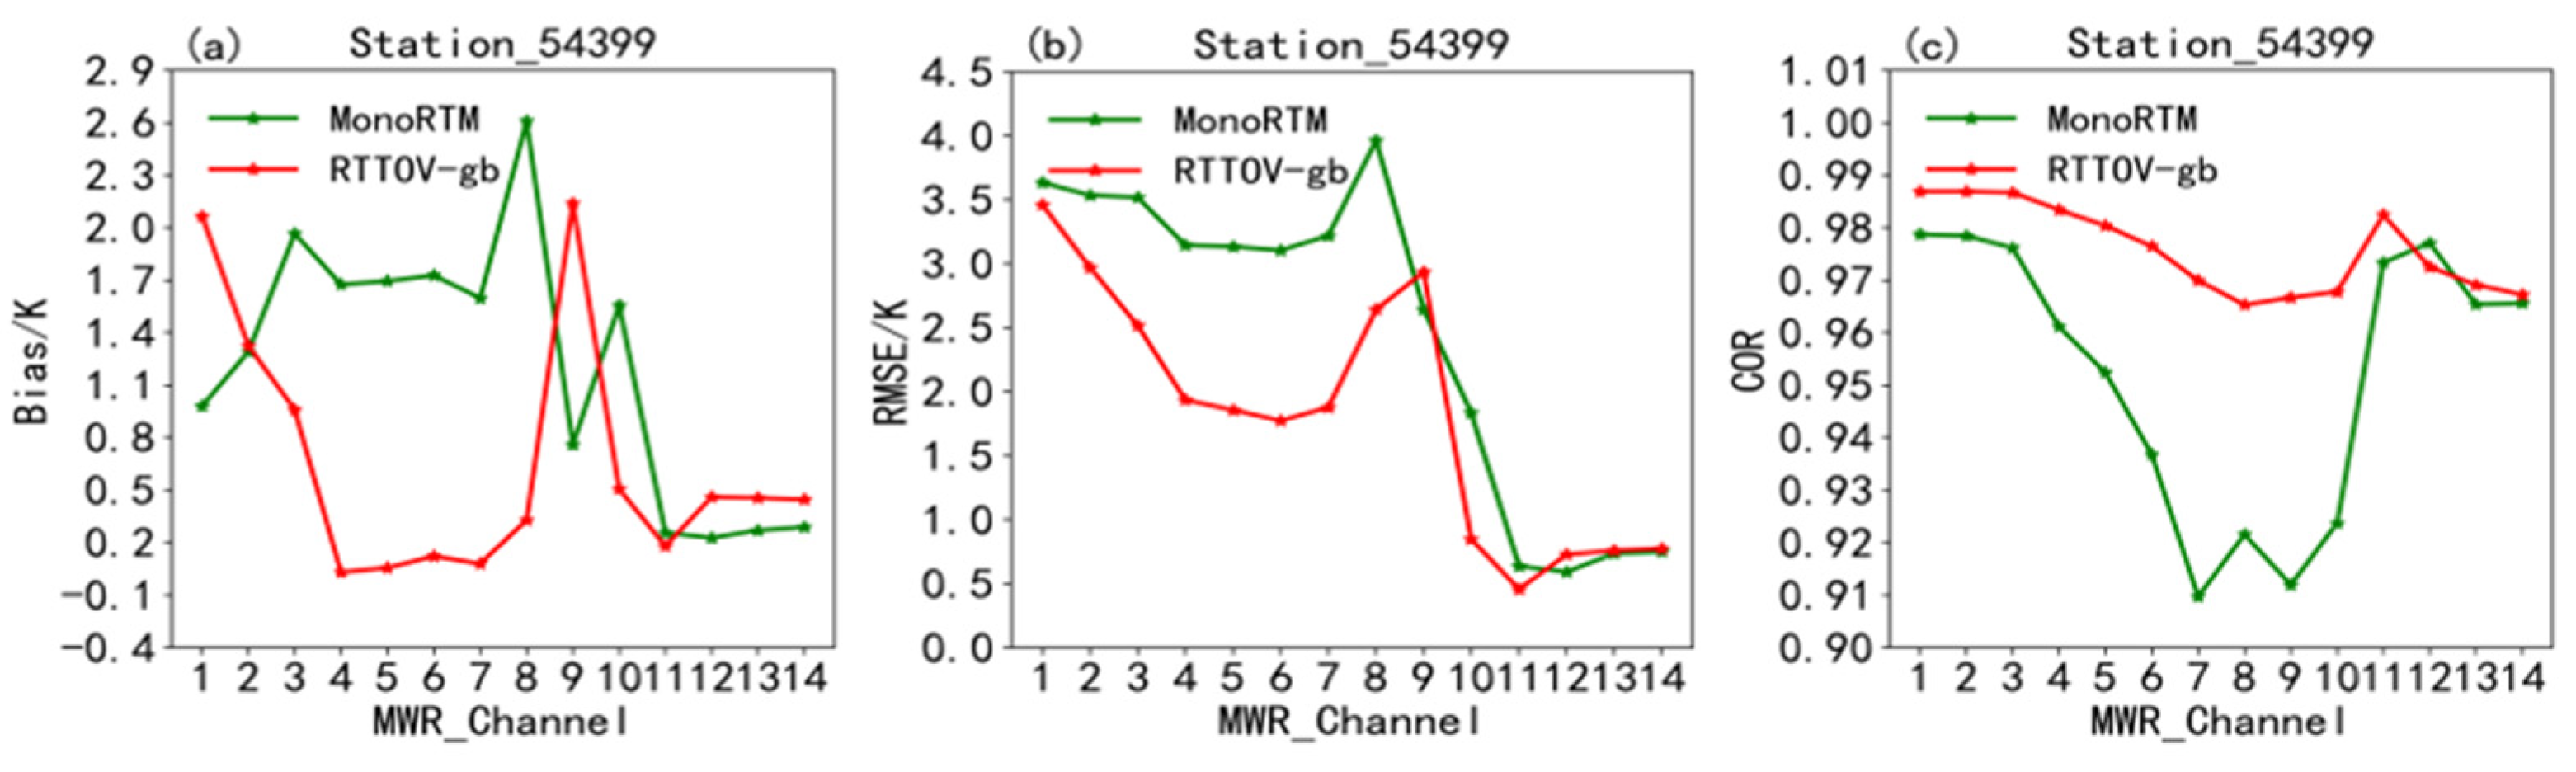
The RTTOV-gb effectively simulates the BT performance assimilation of GMWR data and can be used as an observation operator for direct assimilation. By comparing simulations of Station 54399′s BTs from June to October 2019 using both the RTTOV-gb and MonoRTM with observed values, the analysis results show that scatter plots for both models’ simulated BTs versus the observed values are concentrated along the diagonal line. The absolute error between the simulated and observed BTs is within 3.0 K. Additionally, the root mean square error for each channel’s simulated BTs using the RTTOV-gb is consistent with the MonoRTM and relatively small, indicating that the performance of the RTTOV-gb is comparable to the MonoRTM in simulating GMWR BTs.
(2)
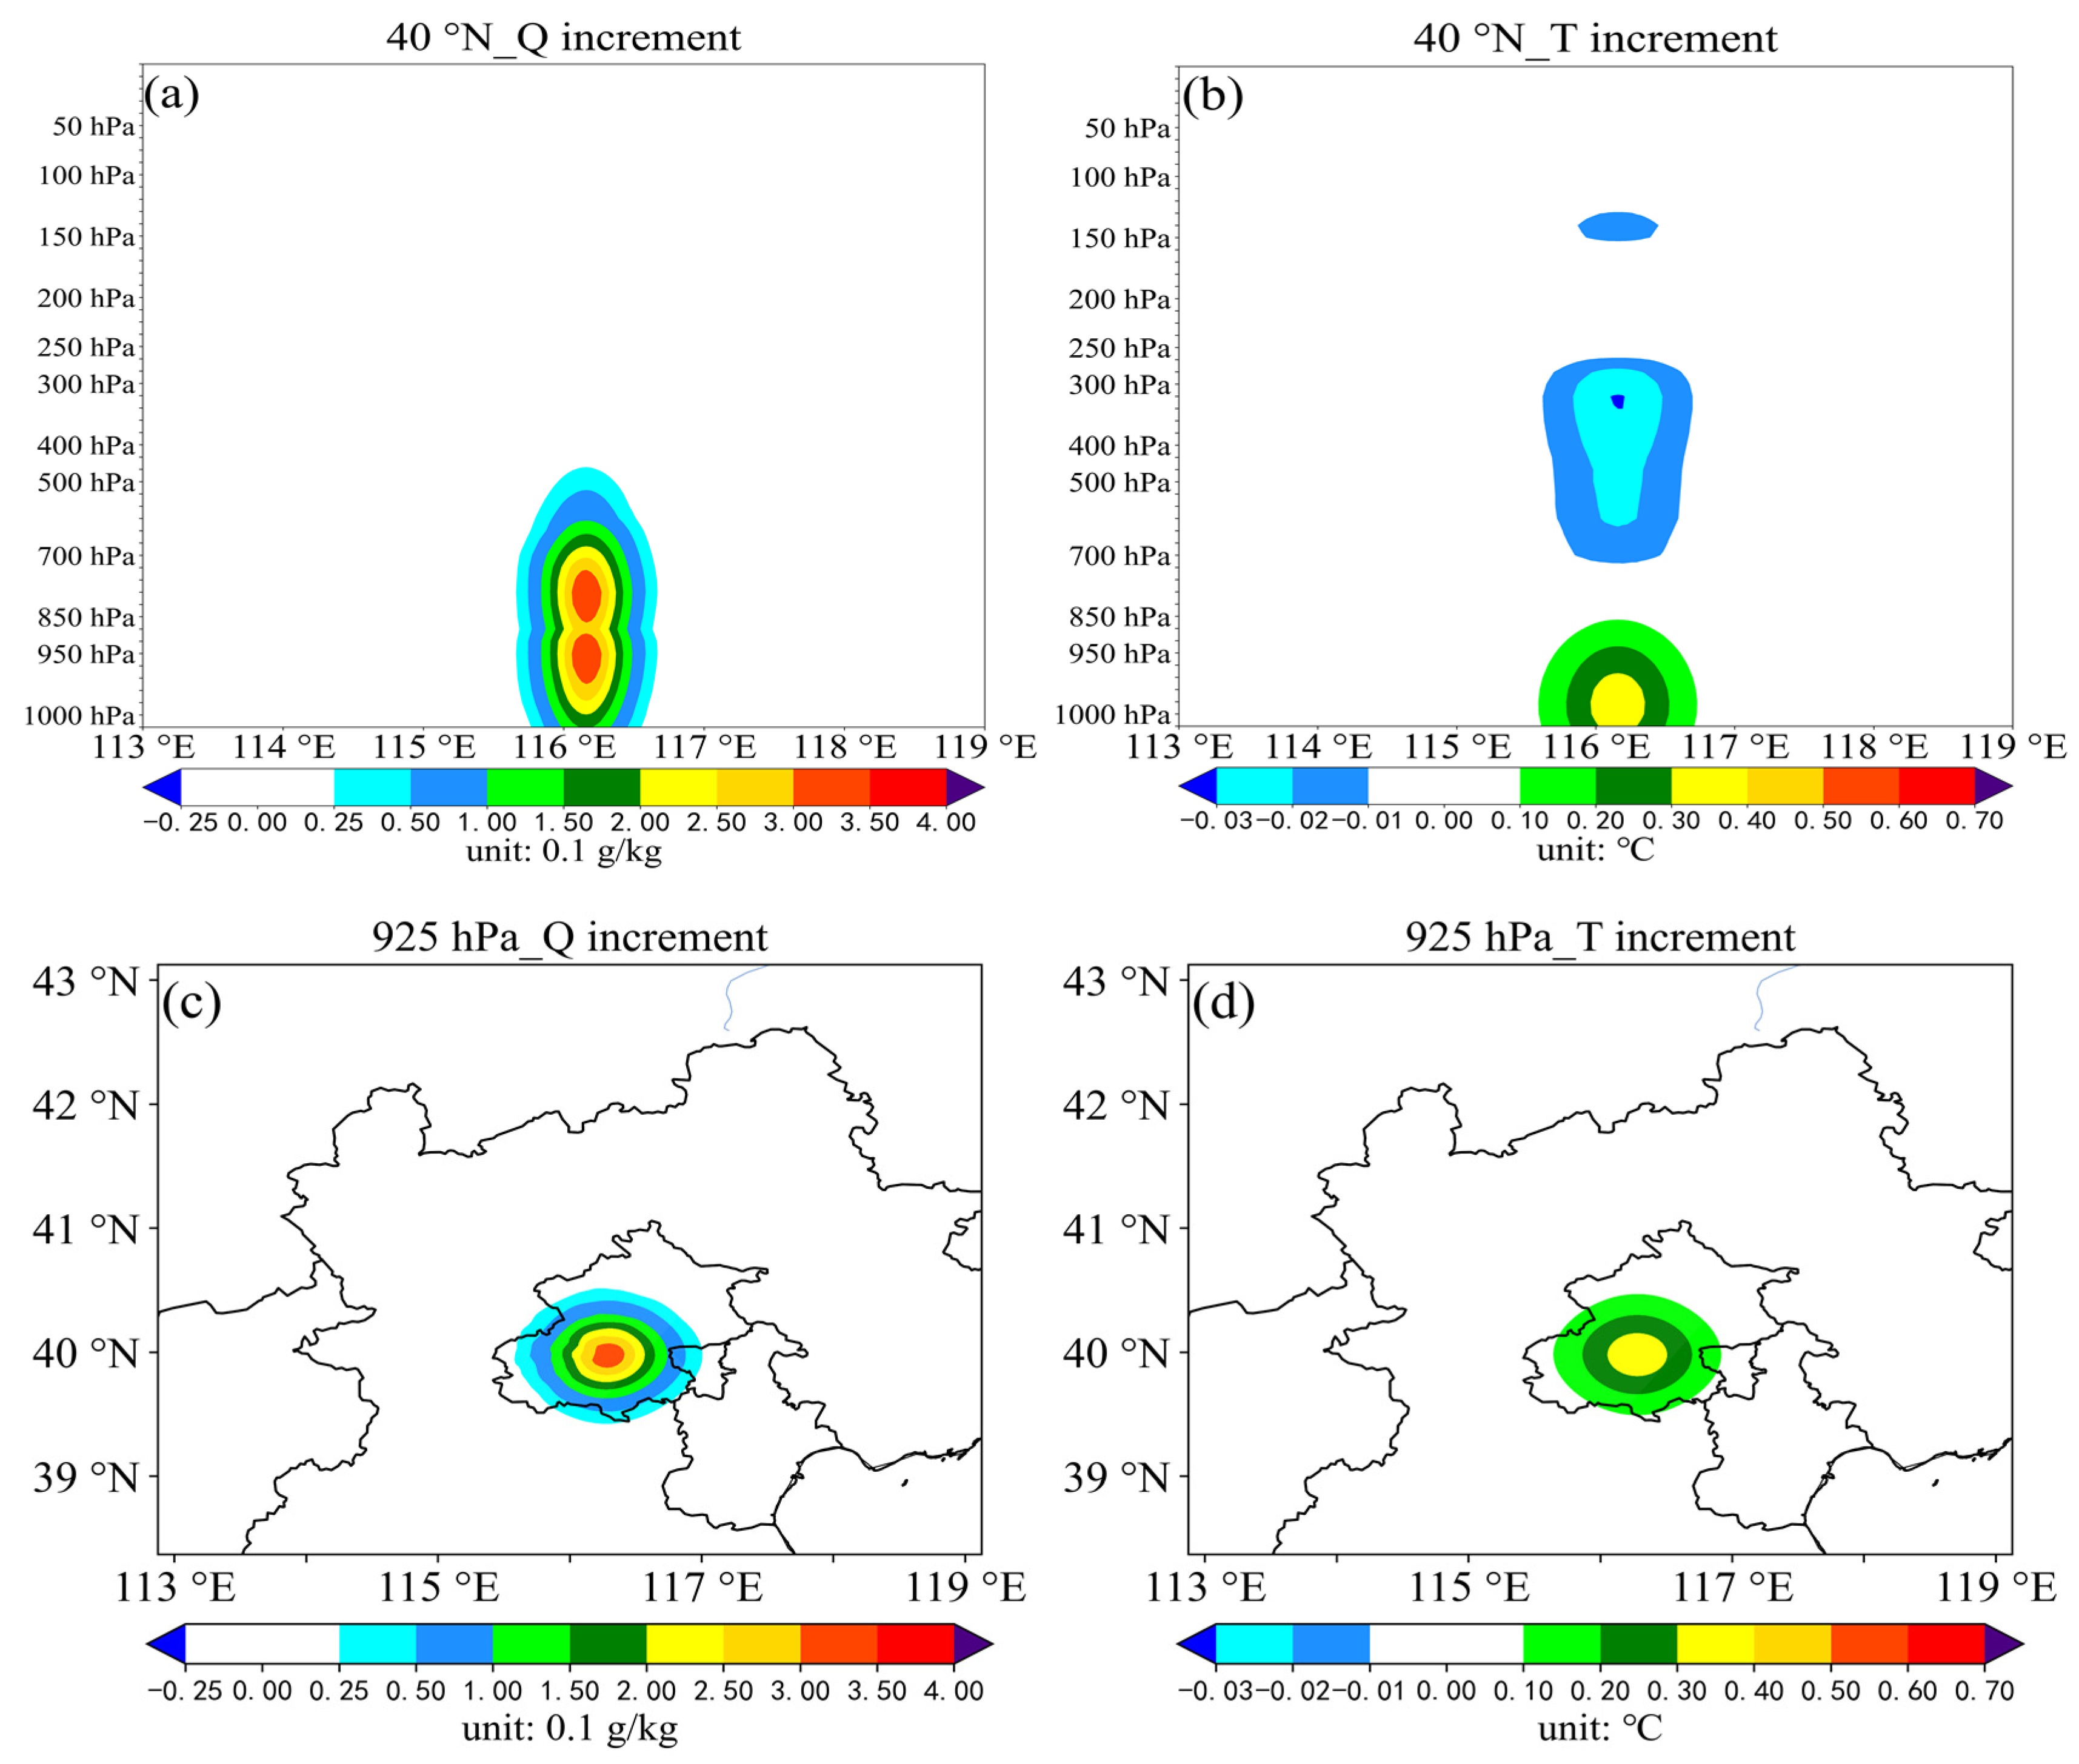
The constructed direct assimilation module for GMWRs can successfully perform the direct assimilation of GMWR radiance data. Through a single-point test, the accuracy of the direct assimilation module and the validity of its algorithm were confirmed. The single-point test also reveals that direct assimilation primarily impacts temperature and humidity fields in the middle and lower layers below 500 hPa in the model, which is consistent with each channel’s weighting function characterization for GMWRs. As such, this direct assimilation module can be utilized for further direct assimilation testing.
(3)
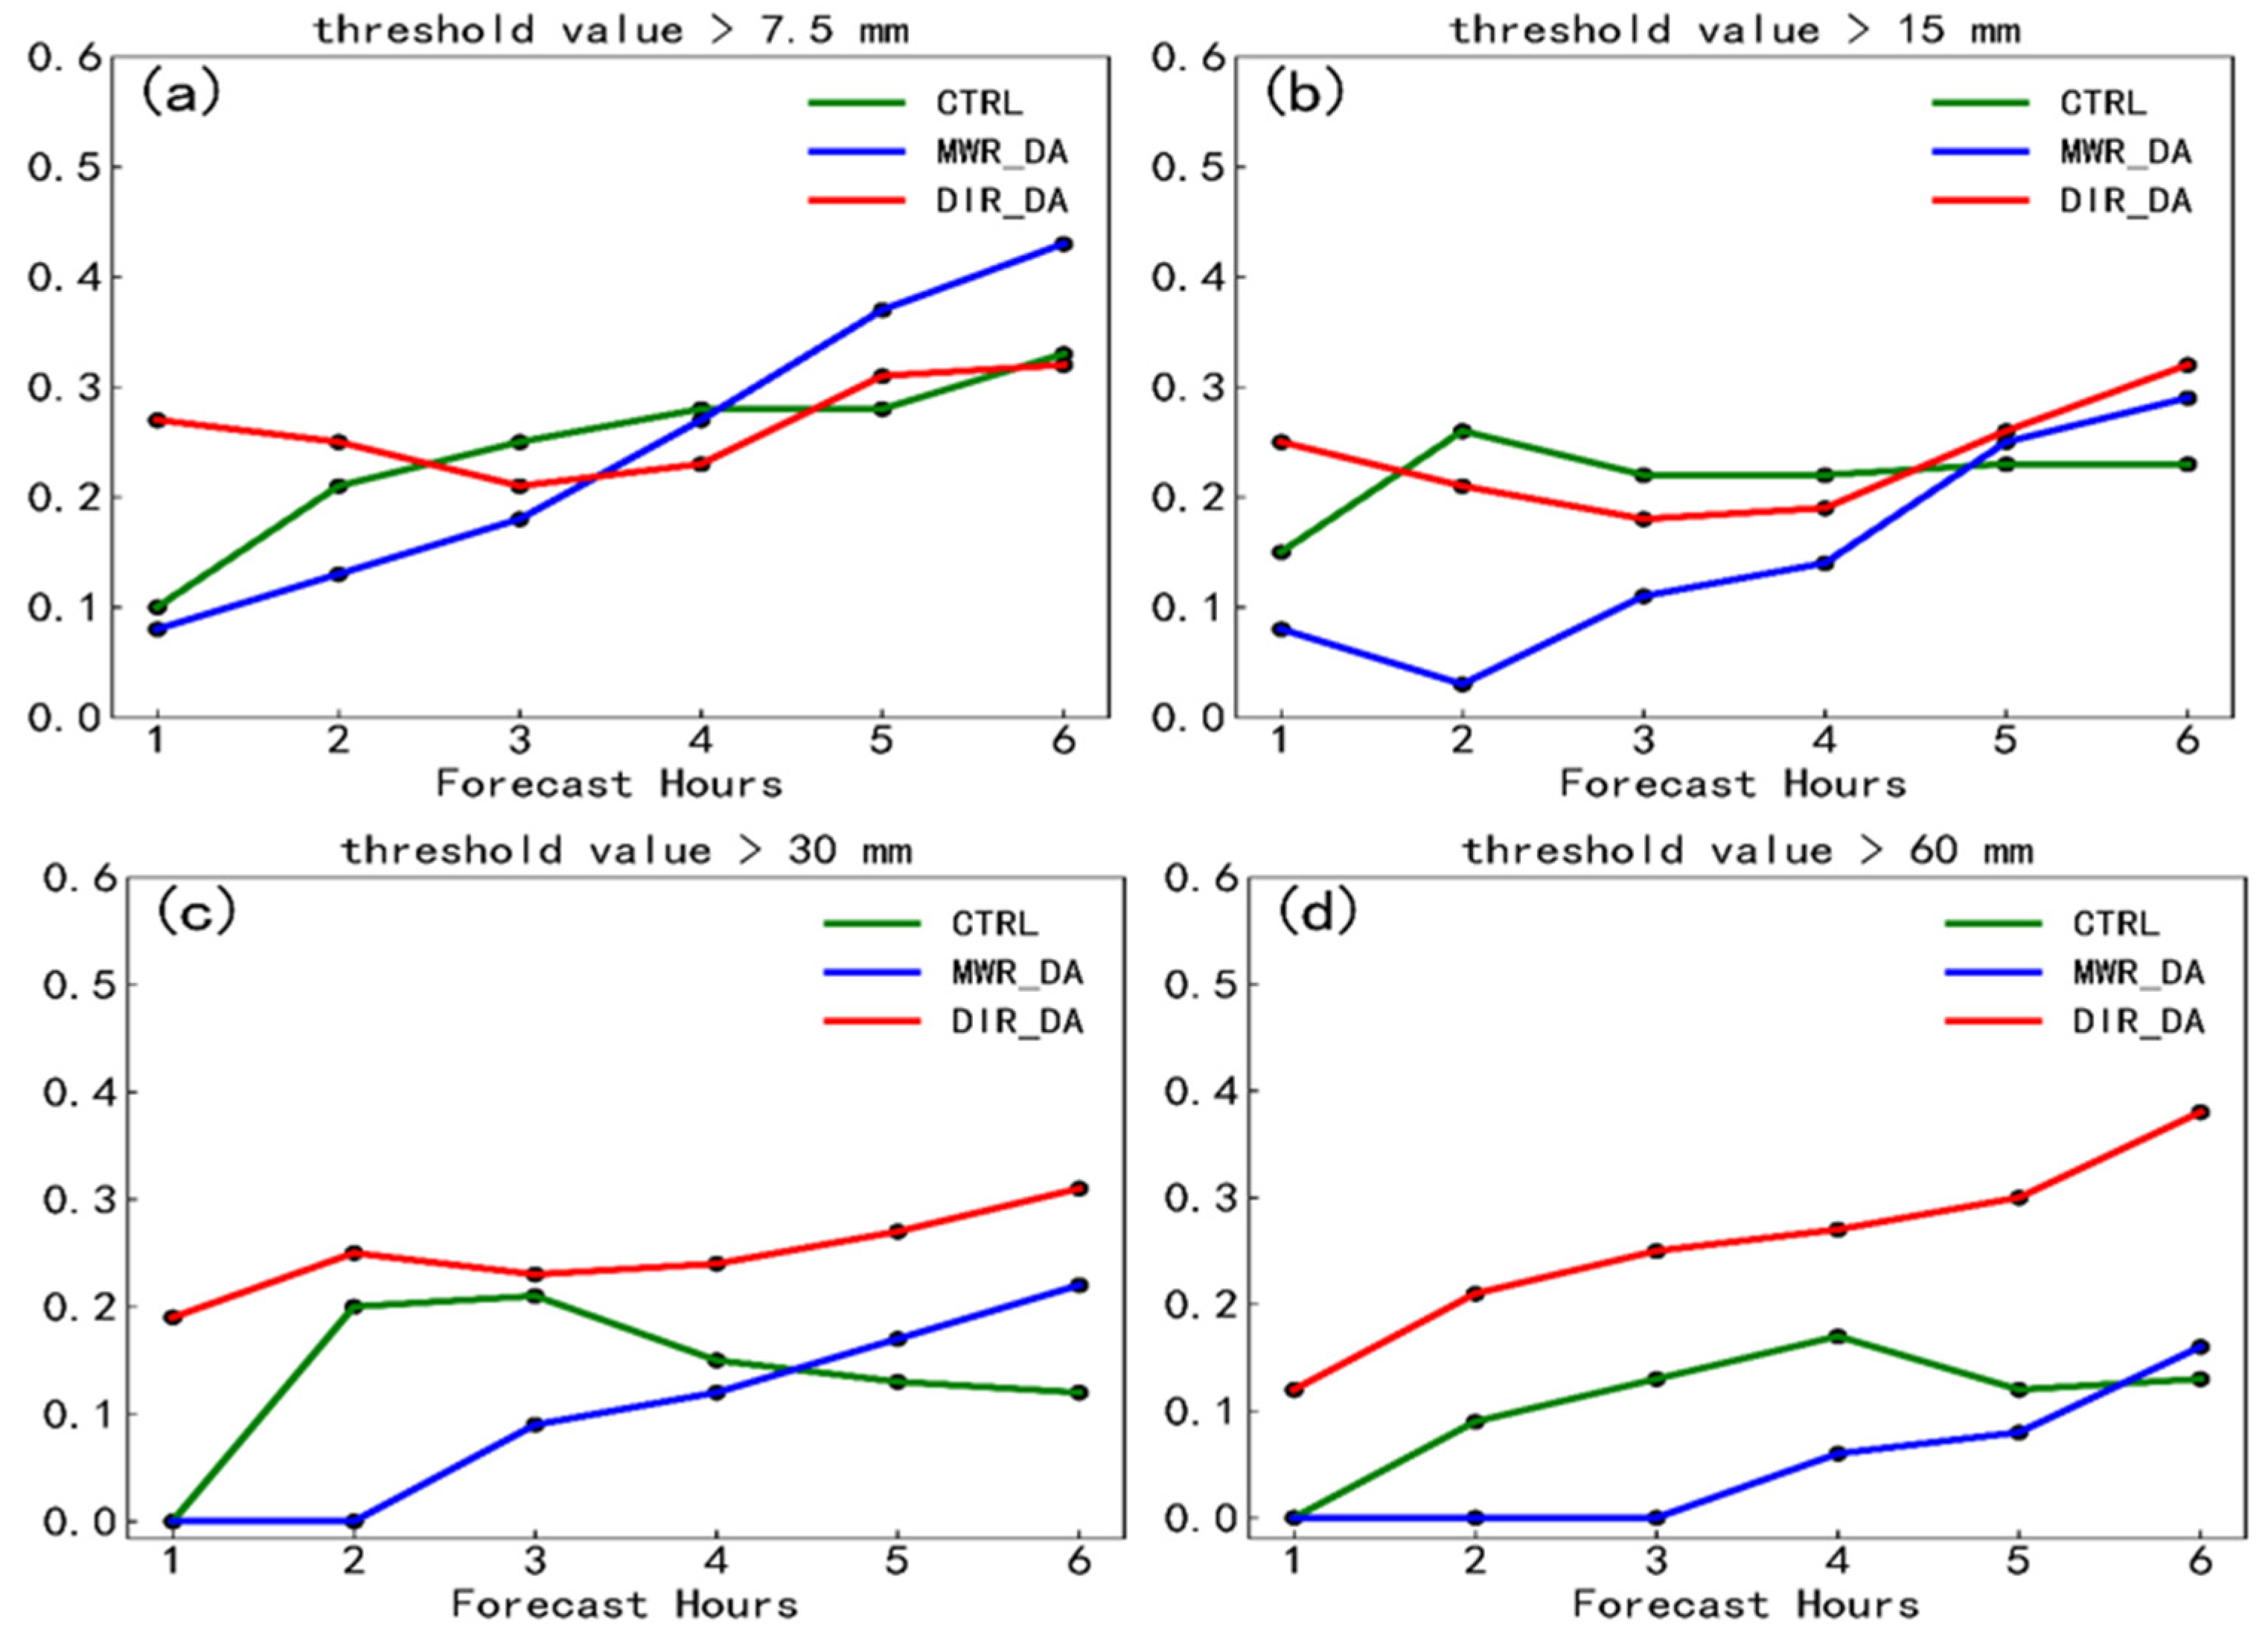
When assimilating GMWR radiance data, the direct assimilation method proves to be more effective than the indirect assimilation method. This results in an improvement in the initial temperature and humidity fields of the model, which in turn enhances its ability to forecast extreme precipitation events. A comparison between the impact of direct and indirect assimilation on analysis fields shows that direct assimilation reduces errors in temperature and humidity fields, while indirect assimilation can increase them due to large errors introduced by the data retrieval method. Furthermore, based on the TS scores for 6 h accumulated precipitation, direct assimilation can effectively improve forecasts of precipitation events with larger magnitudes of rainfall with particularly significant improvements seen for accumulated rainfall of over 60 mm.

Author Contributions

Conceptualization, J.M.; Funding acquisition, J.M.; writing—original draft, Y.C.; writing—review and editing, B.S. and Y.C.; formal analysis, Y.C. and B.S.; data curation, X.Z. and T.Y. All authors have read and agreed to the published version of the manuscript.

Funding

This research was funded by the National Natural Science Foundation of China (Grant No. 42192553).

Data Availability Statement

The ERA5 hourly data on pressure levels from 1940 to present can be downloaded from https://cds.climate.copernicus.eu/cdsapp#!/dataset/reanalysis-era5-pressure-levels?tab=form (accessed on 7 July 2023). Part of the software was associated with the National Center for Atmospheric Research (NCAR) using the new version 4.3 of the WRF and WRFDA system. The NCEP FNL (Final) operational global analysis and forecast data are on 0.25-degree by 0.25-degree grids available at https://rda.ucar.edu/datasets/ds083.3/ (accessed on 6 July 2023). Figures were made with Python version 3.3.8 from https://www.python.org.

Acknowledgments

We acknowledge the High-Performance Computing Center of Nanjing University of Information Science and Technology for their support of this work.

Conflicts of Interest

The authors declare no conflict of interest.

References

  1. Anderson, E. 2018: Statement of Guidance for Global Numerical Weather Prediction (NWP); World Meteorological Organization: Geneva, Switzerland. Available online: https://docplayer.net/194586713-Statement-of-guidance-for-global-numerical-weather-prediction-nwp.html (accessed on 16 December 2019).
  2. Cimini, D.; Hewison, T.J.; Martin, L.; Güldner, J.; Gaffard, C.; Marzano, F.S. Temperature and humidity profile retrievals from groundbased microwave radiometers during TUC. Meteorol. Z. 2006, 15, 45–56. [Google Scholar] [CrossRef]
  3. Bao, Y.S.; Cai, X.; Qian, C.; Min, J.Z.; Lu, Q.F.; Zuo, Q. 0–10 KM Temperature and Humidity Profiles Retrieval from Ground-based Microwave Radiometer. J. Trop. Meteorol. 2018, 24, 243–252. [Google Scholar] [CrossRef]
  4. Wei, J.; Shi, Y.; Ren, Y.; Li, Q.; Qiao, Z.; Cao, J.; Ayantobo, O.O.; Yin, J.; Wang, G. Application of Ground-Based Microwave Radiometer in Retrieving Meteorological Characteristics of Tibet Plateau. Remote Sens. 2021, 13, 2527. [Google Scholar] [CrossRef]
  5. Caumont, O.; Cimini, D.; Löhnert, U.; Alados-Arboledas, L.; Bleisch, R.; Buffa, F.; Ferrario, M.E.; Haefele, A.; Huet, T.; Madonna, F.; et al. Assimilation of humidity and temperature observations retrieved from ground-based microwave radiometers into a convective-scale NWP model. Q. J. R. Meteorol. Soc. 2016, 142, 2692–2704. [Google Scholar] [CrossRef]
  6. Ferraro, R.; Beauchamp, J.; Cecil, D.; Heymsfield, G. A prototype haildetection algorithm and hail climatology developed with the Advanced Microwave Sounding Unit (AMSU). Atmos. Res. 2015, 163, 24–35. [Google Scholar] [CrossRef]
  7. Rysman, J.F.; Claud, C.; Dafis, S. Global monitoring of deep convection using passive microwave observations. Atmos. Res. 2021, 247, 105244. [Google Scholar] [CrossRef]
  8. Lei, L.; Wang, Z.; Ma, Y.; Qin, J.; Zhu, L.; Chen, R.; Lu, J. Observing the Microwave Radiation of the Sun during a Solar Eclipse with a Ground-Based Multichannel Microwave Radiometer. Remote Sens. 2022, 14, 2665. [Google Scholar] [CrossRef]
  9. Cossu, F.; Hocke, K.; Mätzler, C. A 10-Year Cloud Fraction Climatology of Liquid Water Clouds over Bern Observed by a Ground-Based Microwave Radiometer. Remote Sens. 2015, 7, 7768–7784. [Google Scholar] [CrossRef]
  10. Temimi, M.; Fonseca, R.M.; Nelli, N.R.; Valappil, V.K.; Weston, M.J.; Thota, M.S.; Wenbe, Y.; Yousef, L. On the analysis of ground-based microwave radiometer data during fog conditions. Atmos. Res. 2020, 231, 104652. [Google Scholar] [CrossRef]
  11. Ming, H.; Wang, M.; Gao, L.; Qian, Y.; Gao, M.; Chehri, A. Study on the Boundary Layer of the Haze at Xianyang Airport Based on Multi-Source Detection Data. Remote Sens. 2023, 15, 641. [Google Scholar] [CrossRef]
  12. Martinet, P.; Cimini, D.; Burnet, F.; Ménétrier, B.; Michel, Y.; Unger, V. Improvement of numerical weather prediction model analysis during fog conditions through the assimilation of ground-based microwave radiometer observations: A 1D-Var study. Atmos. Meas. Tech. 2020, 13, 6593–6611. [Google Scholar] [CrossRef]
  13. Chen, K.; Wu, G. Comparison of the Potential Impact to the Prediction of Typhoons of Various Microwave Sounders Onboard a Geostationary Satellite. Remote Sens. 2022, 14, 1533. [Google Scholar] [CrossRef]
  14. Xu, D.; Shu, A.; Li, H.; Shen, F.; Li, Q.; Su, H. Effects of Assimilating Clear-Sky FY-3D MWHS2 Radiance on the Numerical Simulation of Tropical Storm Ampil. Remote Sens. 2021, 13, 2873. [Google Scholar] [CrossRef]
  15. Zhang, X.; Xu, D.; Liu, R.; Shen, F. Impacts of FY-4A AGRI Radiance Data Assimilation on the Forecast of the Super Typhoon “In-Fa” (2021). Remote Sens. 2022, 14, 4718. [Google Scholar] [CrossRef]
  16. Lee, E.; Todling, R.; Karpowicz, B.M.; Jin, J.; Sewnath, A.; Park, S.K. Assessment of Geo-Kompsat-2A Atmospheric Motion Vector Data and Its Assimilation Impact in the GEOS Atmospheric Data Assimilation System. Remote Sens. 2022, 14, 5287. [Google Scholar] [CrossRef]
  17. Xu, D.; Zhang, X.; Li, H.; Wu, H.; Shen, F.; Shu, A.; Wang, Y.; Zhuang, X. Evaluation of the Simulation of Typhoon Lekima (2019) Based on Different Physical Parameterization Schemes and FY-3D Satellite’s MWHS-2 Data Assimilation. Remote Sens. 2021, 13, 4556. [Google Scholar] [CrossRef]
  18. Wang, Y.; He, J.; Chen, Y.; Min, J. The Potential Impact of Assimilating Synthetic Microwave Radiances Onboard a Future Geostationary Satellite on the Prediction of Typhoon Lekima Using the WRF Model. Remote Sens. 2021, 13, 886. [Google Scholar] [CrossRef]
  19. Mao, J.; Zhang, X.; Wang, Z.; Yang, Y.; Pan, X.; Ji, C.; Guo, R. Comparison of Brightness Temperature of Multi-type Ground-based Microwave Radiometers. J. Appl. Meteorol. 2018, 29, 724–736. [Google Scholar] [CrossRef]
  20. Qi, Y.; Fan, S.; Mao, J.; Li, B.; Guo, C.; Zhang, S. Impact of assimilating ground-based microwave radiometer data on the precipitation bifurcation forecast: A case study in Beijing. Atmosphere 2021, 12, 551. [Google Scholar] [CrossRef]
  21. De Angelis, F.; Cimini, D.; Hocking, J.; Martinet, P.; Kneifel, S. RTTOV-gb adapting the fast radiative transfer model RTTOV for the assimilation of ground-based microwave radiometer observations. Geosci. Model Dev. 2016, 9, 2721–2739. [Google Scholar] [CrossRef]
  22. Cimini, D.; Hocking, J.; De Angelis, F.; Cersosimo, A.; Di Paola, F.; Gallucci, D.; Gentile, S.; Geraldi, E.; Larosa, S.; Nilo, S.; et al. RTTOV-gb v1. 0–updates on sensors, absorption models, uncertainty, and availability. Geosci. Model Dev. 2019, 12, 1833–1845. [Google Scholar] [CrossRef]
  23. Zhang, B.; Yu, X.; Perrie, W.; Zhou, F. Air–Sea Interface Parameters and Heat Flux from Neural Network and Advanced Microwave Scanning Radiometer Observations. Remote Sens. 2022, 14, 2364. [Google Scholar] [CrossRef]
  24. Zhao, Y.; Zhou, D.; Yan, H. An improved retrieval method of atmospheric parameter profiles based on the BP neural network. Atmos. Res. 2018, 213, 389–397. [Google Scholar] [CrossRef]
  25. Zou, R.; He, W.; Wang, P.; Mao, J.; Chen, H.; Li, J.; Nan, W.; Chang, Y. Assessment of Radiative Transfer Models Based on Observed Brightness Temperature from Ground-Based Microwave Radiometer. Chin. J. Atmos. Sci. 2021, 45, 605–616. (In Chinese) [Google Scholar] [CrossRef]
  26. He, W.; Cheng, Y.; Zou, R.; Wang, P.; Chen, H.; Li, J.; Xia, X. Radiative Transfer Model Simulations for Ground-Based Microwave Radiometers in North China. Remote Sens. 2021, 13, 5161. [Google Scholar] [CrossRef]
  27. Buehler, S.A.; Courcoux, N.; John, V.O. Radiative transfer calculations for a passive microwave satellite sensor: Comparing a fast model and a line-by-line model. J. Geophys. Res. Atmos. 2006, 111, 6552. [Google Scholar] [CrossRef]
  28. Clough, S.A.; Shephard, M.W.; Mlawer, E.J.; Delamere, J.S.; Iacono, M.J.; Cady-Pereira, K.; Boukabara, S.; Brown, P.D. Atmospheric radiative transfer modeling: A summary of the AER codes. J. Quant. Spectrosc. Radiat. Transf. 2005, 91, 233–244. [Google Scholar] [CrossRef]
  29. Rosenkranz, P.W. Water vapor microwave continuum absorption: A comparison of measurements and models. Radio Sci. 1998, 33, 919–928. [Google Scholar] [CrossRef]
  30. Cimini, D.; Rosenkranz, P.W.; Tretyakov, M.Y.; Koshelev, M.A.; Romano, F. Uncertainty of atmospheric microwave absorption model: Impact on ground-based radiometer simulations and retrievals. Atmos. Chem. Phys. 2018, 18, 15231–15259. [Google Scholar] [CrossRef]
  31. Shen, F.; Xu, D.; Min, J.; Zhang, B.; Li, C. Assimilation of radar observations with En3DVAR at cloud-resolving scale for the prediction of Typhoon Saomai. Acta Oceanol. Sin. 2018, 40, 48–61. [Google Scholar] [CrossRef]
  32. Parrish, D.F.; Derber, J.C. The National Meteorological Center’s spectral statistical-interpolation analysis system. Mon. Weather Rev. 1992, 120, 1747–1763. [Google Scholar] [CrossRef]
  33. Shen, F.; Min, J.; Xu, D. Assimilation of radar radial velocity data with the WRF Hybrid ETKF–3DVAR system for the prediction of Hurricane Ike (2008). Atmos. Res. 2016, 169, 127–138. [Google Scholar] [CrossRef]
  34. Shu, T.; Han, H.; Guo, L.; Lin, L.; Zhao, Z.; Li, J. Using of Temperature Weighting Functions for Retrieving Atmospheric Temperature Profiles of the Relevant Theoretical Research. J. Microw. 2012, 28, 451–454. [Google Scholar] [CrossRef]
  35. Wang, R.; Wang, Y.; Yan, W.; Lu, W.; Ma, S.; Zhao, X.; Gu, C. Channel Selection, Data Simulation, and Parameter Inversion of Ground-Based Hyperspectral Microwave Radiometer. Math. Probl. Eng. 2019, 2019, 4846378. [Google Scholar] [CrossRef]
  36. Arora, K.; Ray, K.; Ram, S.; Mehajan, R. The Role of Instability Indices in Forecasting Thunderstorm and Non-Thunderstorm Days across Six Cities in India. Climate 2023, 11, 14. [Google Scholar] [CrossRef]
  37. Xu, D.; Yang, G.; Wu, Z.; Shen, F.; Li, H.; Zhai, D. Evaluate Radar Data Assimilation in Two Momentum Control Variables and the Effect on the Forecast of Southwest China Vortex Precipitation. Remote Sens. 2022, 14, 3460. [Google Scholar] [CrossRef]
  38. Song, L.; Shen, F.; Shao, C.; Shu, A.; Zhu, L. Impacts of 3DEnVar-Based FY-3D MWHS-2 Radiance Assimilation on Numerical Simulations of Landfalling Typhoon Ampil (2018). Remote Sens. 2022, 14, 6037. [Google Scholar] [CrossRef]
Figure 1. (a) Distribution of GMWR sites and (b) the location of Beijing (the red-shaded area).
Remotesensing 15 04314 g001
Figure 2. Scatter diagram of observed BTs against simulated ones in RTTOV-gb (red dots) and MonoRTM (blue dots) from 1–14 channels (an) at Station 54399. The green lines represent the diagonal.
Remotesensing 15 04314 g002
Figure 3. The (a) BIAS, (b) RMSE, and (c) COR of RTTOV-gb (red line) and MonoRTM (green line) simulated BTs against observed ones from 14 channels at Station 54399.
Remotesensing 15 04314 g003
Figure 4. The analysis increments of (a) the cross sections of water vapor mixing ratio along 40°N; (b) the cross sections of temperature along 40°N; (c) water vapor mixing ratio at 925 hPa; (d) temperature at 925 hPa for the single-observation experiment of water vapor channel 5 and oxygen channel 12 radiance data at Station 54399.
Remotesensing 15 04314 g004
Figure 5. The analysis at 0600 UTC on 9 August 2019 of the water vapor mixing ratio (shaded; units: g/kg), wind (vectors; units: m/s), and vertical velocity (contours; units: m/s). The colored bars from left to right are for the wind field, vertical velocity, and water vapor mixing ratio, respectively.
Remotesensing 15 04314 g005
Figure 6. Distribution of 1 h accumulated rainfall during the periods (a) 0600 UTC–0700 UTC, (b) 0700 UTC–0800 UTC, (c) 0800 UTC–0900 UTC, (d) 0900 UTC–1000 UTC, (e) 1000 UTC–1100 UTC, and (f) 1100 UTC–1200 UTC on 9 August 2019.
Remotesensing 15 04314 g006
Figure 7. Two nested domains of the WRF model (d01: 9 km, d02: 3 km). D02 is outlined by the black box. The color shading represents the terrain height (units: m).
Remotesensing 15 04314 g007
Figure 8. Workflow for assimilation experiments.
Remotesensing 15 04314 g008
Figure 9. The 500 hPa temperature field at 0600 UTC on 9 August 2019 from (a) FNL, (b) CTRL, (c) MWR_DA, and (d) DIR_DA.
Remotesensing 15 04314 g009
Figure 10. The 850 hPa relative humidity field at 0600 UTC on 9 August 2019 from (a) FNL, (b) CTRL, (c) MWR_DA, and (d) DIR_DA.
Remotesensing 15 04314 g010
Figure 11. (ad) T-lnP diagram of Station 54511 at 0600 UTC on 9 August 2019 from (a) Sounding, (b) CTRL, (c) MWR_DA, and (d) DIR_DA.
Remotesensing 15 04314 g011
Figure 12. (ad) A 6 h precipitation in Beijing area at 1200 UTC on 9 August 2019 from (a) CMORPH, (b) CTRL, (c) MWR_DA, and (d) DIR_DA.
Remotesensing 15 04314 g012
Figure 13. TS scores of accumulated precipitation with different thresholds of (a) >7.5, (b) >15, (c) >30, and (d) >60 in Beijing.
Remotesensing 15 04314 g013
Table 1. Characteristics of RPG-HATPRO GMWR for each channel.
Water Vapor ChannelsOxygen Channels
Channel NumberCentre FrequencyChannel NumberCentre Frequency
122.40 GHz851.26 GHz
223.04 GHz952.28 GHz
323.84 GHz1053.86 GHz
425.44 GHz1154.94 GHz
526.24 GHz1256.66 GHz
627.84 GHz1357.30 GHz
731.40 GHz1458.80 GHz
Table 2. Sensors supported by RTTOV-gb.
SensorRTTOV-gb IDChannel
HATPRO11–14
MP3000A21–22
TEMPERA31–12
LWP_K2W41–6
Table 3. Assimilation scheme.
ExperimentAssimilated DataAssimilation Interval
CTRLNo
MWR_DATemperature and humidity profiles from 7 GMWRs2 h
DIR_DARadiance of 7 GMWRs2 h
Disclaimer/Publisher’s Note: The statements, opinions and data contained in all publications are solely those of the individual author(s) and contributor(s) and not of MDPI and/or the editor(s). MDPI and/or the editor(s) disclaim responsibility for any injury to people or property resulting from any ideas, methods, instructions or products referred to in the content.

