Next Issue
Volume 8, September
Previous Issue
Volume 8, July


Data, Volume 8, Issue 8 (August 2023) – 12 articles

Cover Story (view full-size image): 
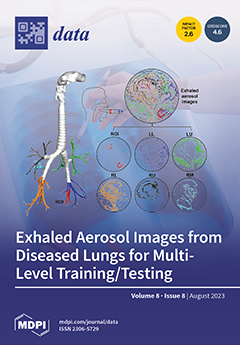
This dataset contains 2,264 simulated exhaled aerosol images generated via physiology-based simulations. The dataset is unique in providing testing image datasets with decreasing similarities to images in the training datasets, allowing the evaluation of model verification, interpolation, and extrapolation in both 2-class and 3-cass classifications. This database may be of interest to the AI community to benchmark-test CNN models, physicians working with automatic diagnosis of obstructive lung diseases, and researchers in respiratory dynamics. In addition to the well-structured dataset, the source code for CNN models, detailed training/testing results, and a result summary were also provided, which can serve as an easy-to-start educational tutorial for AI beginners. View this paper
  • Issues are regarded as officially published after their release is announced to the table of contents alert mailing list.
  • You may sign up for e-mail alerts to receive table of contents of newly released issues.
  • PDF is the official format for papers published in both, html and pdf forms. To view the papers in pdf format, click on the "PDF Full-text" link, and use the free Adobe Readerexternal link to open them.
Order results
Result details
Section
Select all
Export citation of selected articles as:
Article
Quantifying Webpage Performance: A Comparative Analysis of TCP/IP and QUIC Communication Protocols for Improved Efficiency
Data 2023, 8(8), 134; https://doi.org/10.3390/data8080134 - 19 Aug 2023
Viewed by 273
Abstract
Browsing is a prevalent activity on the World Wide Web, and users usually demonstrate significant expectations for expeditious information retrieval and seamless transactions. This article presents a comprehensive performance evaluation of the most frequently accessed webpages in recent years using Data Envelopment Analysis [...] Read more.
Browsing is a prevalent activity on the World Wide Web, and users usually demonstrate significant expectations for expeditious information retrieval and seamless transactions. This article presents a comprehensive performance evaluation of the most frequently accessed webpages in recent years using Data Envelopment Analysis (DEA) adapted to the context (inverse DEA), comparing their performance under two distinct communication protocols: TCP/IP and QUIC. To assess performance disparities, parametric and non-parametric hypothesis tests are employed to investigate the appropriateness of each website’s communication protocols. We provide data on the inputs, outputs, and efficiency scores for 82 out of the world’s top 100 most-accessed websites, describing how experiments and analyses were conducted. The evaluation yields quantitative metrics pertaining to the technical efficiency of the websites and efficient benchmarks for best practices. Nine websites are considered efficient from the point of view of at least one of the communication protocols. Considering TCP/IP, about 80.5% of all units (66 webpages) need to reduce more than 50% of their page load time to be competitive, while this number is 28.05% (23 webpages), considering QUIC communication protocol. In addition, results suggest that TCP/IP protocol has an unfavorable effect on the overall distribution of inefficiencies. Full article
Show Figures

Figure 1

Article
Leveraging Return Prediction Approaches for Improved Value-at-Risk Estimation
Data 2023, 8(8), 133; https://doi.org/10.3390/data8080133 - 17 Aug 2023
Viewed by 528
Abstract
Value at risk is a statistic used to anticipate the largest possible losses over a specific time frame and within some level of confidence, usually 95% or 99%. For risk management and regulators, it offers a solution for trustworthy quantitative risk management tools. [...] Read more.
Value at risk is a statistic used to anticipate the largest possible losses over a specific time frame and within some level of confidence, usually 95% or 99%. For risk management and regulators, it offers a solution for trustworthy quantitative risk management tools. VaR has become the most widely used and accepted indicator of downside risk. Today, commercial banks and financial institutions utilize it as a tool to estimate the size and probability of upcoming losses in portfolios and, as a result, to estimate and manage the degree of risk exposure. The goal is to obtain the average number of VaR “failures” or “breaches” (losses that are more than the VaR) as near to the target rate as possible. It is also desired that the losses be evenly distributed as possible. VaR can be modeled in a variety of ways. The simplest method is to estimate volatility based on prior returns according to the assumption that volatility is constant. Otherwise, the volatility process can be modeled using the GARCH model. Machine learning techniques have been used in recent years to carry out stock market forecasts based on historical time series. A machine learning system is often trained on an in-sample dataset, where it can adjust and improve specific hyperparameters in accordance with the underlying metric. The trained model is tested on an out-of-sample dataset. We compared the baselines for the VaR estimation of a day (d) according to different metrics (i) to their respective variants that included stock return forecast information of d and stock return data of the days before d and (ii) to a GARCH model that included return prediction information of d and stock return data of the days before d. Various strategies such as ARIMA and a proposed ensemble of regressors have been employed to predict stock returns. We observed that the versions of the univariate techniques and GARCH integrated with return predictions outperformed the baselines in four different marketplaces. Full article
Show Figures

Figure 1

Data Descriptor
VR Traffic Dataset on Broad Range of End-User Activities
Data 2023, 8(8), 132; https://doi.org/10.3390/data8080132 - 17 Aug 2023
Viewed by 315
Abstract
With the emergence of new internet traffic types in modern transport networks, it has become critical for service providers to understand the structure of that traffic and predict peaks of that load for planning infrastructure expansion. Several studies have investigated traffic parameters for [...] Read more.
With the emergence of new internet traffic types in modern transport networks, it has become critical for service providers to understand the structure of that traffic and predict peaks of that load for planning infrastructure expansion. Several studies have investigated traffic parameters for Virtual Reality (VR) applications. Still, most of them test only a partial range of user activities during a limited time interval. This work creates a dataset of captures from a broader spectrum of VR activities performed with a Meta Quest 2 headset, with the duration of each real residential user session recorded for at least half an hour. Newly collected data helped show that some gaming VR traffic activities have a high share of uplink traffic and require symmetric user links. Also, we have figured out that the gaming phase of the overall gameplay is more sensitive to the channel resources reduction than the higher bitrate game launch phase. Hence, we recommend it as a source of traffic distribution for channel sizing model creation. From the gaming phase, capture intervals of more than 100 s contain the most representative information for modeling activity. Full article
(This article belongs to the Section Information Systems and Data Management)
Show Figures

Figure 1

Data Descriptor
Draft Genome Sequence Data of Streptomyces anulatus, Strain K-31
Data 2023, 8(8), 131; https://doi.org/10.3390/data8080131 - 10 Aug 2023
Viewed by 354
Abstract
Streptomyces anulatus is a typical representative of the Streptomyces genus synthesizing a large number of biologically active compounds. In this study, the draft genome of Streptomyces anulatus, strain K-31 is presented, generated from Illumina reads by SPAdes software. The size of the [...] Read more.
Streptomyces anulatus is a typical representative of the Streptomyces genus synthesizing a large number of biologically active compounds. In this study, the draft genome of Streptomyces anulatus, strain K-31 is presented, generated from Illumina reads by SPAdes software. The size of the assembled genome was 8.548838 Mb. Annotation of the S. anulatus genome assembly identified C. hemipterus genome 7749 genes, including 7149 protein-coding genes and 92 RNA genes. This genome will be helpful to further understand Streptomyces genetics and evolution and can be useful for obtained biological active compounds. Full article
Show Figures

Figure 1

Article
Towards Action-State Process Model Discovery
Data 2023, 8(8), 130; https://doi.org/10.3390/data8080130 - 09 Aug 2023
Viewed by 345
Abstract
Process model discovery covers the different methodologies used to mine a process model from traces of process executions, and it has an important role in artificial intelligence research. Current approaches in this area, with a few exceptions, focus on determining a model of [...] Read more.
Process model discovery covers the different methodologies used to mine a process model from traces of process executions, and it has an important role in artificial intelligence research. Current approaches in this area, with a few exceptions, focus on determining a model of the flow of actions only. However, in several contexts, (i) restricting the attention to actions is quite limiting, since the effects of such actions also have to be analyzed, and (ii) traces provide additional pieces of information in the form of states (i.e., values of parameters possibly affected by the actions); for instance, in several medical domains, the traces include both actions and measurements of patient parameters. In this paper, we propose AS-SIM (Action-State SIM), the first approach able to mine a process model that comprehends two distinct classes of nodes, to capture both actions and states. Full article
Show Figures

Figure 1

Data Descriptor
Anomaly Detection in Student Activity in Solving Unique Programming Exercises: Motivated Students against Suspicious Ones
Data 2023, 8(8), 129; https://doi.org/10.3390/data8080129 - 08 Aug 2023
Viewed by 327
Abstract
This article presents a dataset containing messages from the Digital Teaching Assistant (DTA) system, which records the results from the automatic verification of students’ solutions to unique programming exercises of 11 various types. These results are automatically generated by the system, which automates [...] Read more.
This article presents a dataset containing messages from the Digital Teaching Assistant (DTA) system, which records the results from the automatic verification of students’ solutions to unique programming exercises of 11 various types. These results are automatically generated by the system, which automates a massive Python programming course at MIREA—Russian Technological University (RTU MIREA). The DTA system is trained to distinguish between approaches to solve programming exercises, as well as to identify correct and incorrect solutions, using intelligent algorithms responsible for analyzing the source code in the DTA system using vector representations of programs based on Markov chains, calculating pairwise Jensen–Shannon distances for programs and using a hierarchical clustering algorithm to detect high-level approaches used by students in solving unique programming exercises. In the process of learning, each student must correctly solve 11 unique exercises in order to receive admission to the intermediate certification in the form of a test. In addition, a motivated student may try to find additional approaches to solve exercises they have already solved. At the same time, not all students are able or willing to solve the 11 unique exercises proposed to them; some will resort to outside help in solving all or part of the exercises. Since all information about the interactions of the students with the DTA system is recorded, it is possible to identify different types of students. First of all, the students can be classified into 2 classes: those who failed to solve 11 exercises and those who received admission to the intermediate certification in the form of a test, having solved the 11 unique exercises correctly. However, it is possible to identify classes of typical, motivated and suspicious students among the latter group based on the proposed dataset. The proposed dataset can be used to develop regression models that will predict outbursts of student activity when interacting with the DTA system, to solve clustering problems, to identify groups of students with a similar behavior model in the learning process and to develop intelligent data classifiers that predict the students’ behavior model and draw appropriate conclusions, not only at the end of the learning process but also during the course of it in order to motivate all students, even those who are classified as suspicious, to visualize the results of the learning process using various tools. Full article
Show Figures

Figure 1

Data Descriptor
VEPL Dataset: A Vegetation Encroachment in Power Line Corridors Dataset for Semantic Segmentation of Drone Aerial Orthomosaics
Data 2023, 8(8), 128; https://doi.org/10.3390/data8080128 - 04 Aug 2023
Viewed by 485
Abstract
Vegetation encroachment in power line corridors has multiple problems for modern energy-dependent societies. Failures due to the contact between power lines and vegetation can result in power outages and millions of dollars in losses. To address this problem, UAVs have emerged as a [...] Read more.
Vegetation encroachment in power line corridors has multiple problems for modern energy-dependent societies. Failures due to the contact between power lines and vegetation can result in power outages and millions of dollars in losses. To address this problem, UAVs have emerged as a promising solution due to their ability to quickly and affordably monitor long corridors through autonomous flights or being remotely piloted. However, the extensive and manual task that requires analyzing every image acquired by the UAVs when searching for the existence of vegetation encroachment has led many authors to propose the use of Deep Learning to automate the detection process. Despite the advantages of using a combination of UAV imagery and Deep Learning, there is currently a lack of datasets that help to train Deep Learning models for this specific problem. This paper presents a dataset for the semantic segmentation of vegetation encroachment in power line corridors. RGB orthomosaics were obtained for a rural road area using a commercial UAV. The dataset is composed of pairs of tessellated RGB images, coming from the orthomosaic and corresponding multi-color masks representing three different classes: vegetation, power lines, and the background. A detailed description of the image acquisition process is provided, as well as the labeling task and the data augmentation techniques, among other relevant details to produce the dataset. Researchers would benefit from using the proposed dataset by developing and improving strategies for vegetation encroachment monitoring using UAVs and Deep Learning. Full article
(This article belongs to the Section Spatial Data Science and Digital Earth)
Show Figures

Figure 1

Data Descriptor
eMailMe: A Method to Build Datasets of Corporate Emails in Portuguese
Data 2023, 8(8), 127; https://doi.org/10.3390/data8080127 - 31 Jul 2023
Viewed by 468
Abstract
One of the areas in which knowledge management has application is in companies that are concerned with maintaining and disseminating their practices among their members. However, studies involving these two domains may end up suffering from the issue of data confidentiality. Furthermore, it [...] Read more.
One of the areas in which knowledge management has application is in companies that are concerned with maintaining and disseminating their practices among their members. However, studies involving these two domains may end up suffering from the issue of data confidentiality. Furthermore, it is difficult to find data regarding organizations processes and associated knowledge. Therefore, this paper presents a method to support the generation of a labeled dataset composed of texts that simulate corporate emails containing sensitive information regarding disclosure, written in Portuguese. The method begins with the definition of the dataset’s size and content distribution; the structure of its emails’ texts; and the guidelines for specialists to build the emails’ texts. It aims to create datasets that can be used in the validation of a tacit knowledge extraction process considering the 5W1H approach for the resulting base. The method was applied to create a dataset with content related to several domains, such as Federal Court and Registry Office and Marketing, giving it diversity and realism, while simulating real-world situations in the specialists’ professional life. The dataset generated is available in an open-access repository so that it can be downloaded and, eventually, expanded. Full article
(This article belongs to the Topic Methods for Data Labelling for Intelligent Systems)
Show Figures

Figure 1

Data Descriptor
Datasets of Simulated Exhaled Aerosol Images from Normal and Diseased Lungs with Multi-Level Similarities for Neural Network Training/Testing and Continuous Learning
Data 2023, 8(8), 126; https://doi.org/10.3390/data8080126 - 31 Jul 2023
Viewed by 409
Abstract
Although exhaled aerosols and their patterns may seem chaotic in appearance, they inherently contain information related to the underlying respiratory physiology and anatomy. This study presented a multi-level database of simulated exhaled aerosol images from both normal and diseased lungs. An anatomically accurate [...] Read more.
Although exhaled aerosols and their patterns may seem chaotic in appearance, they inherently contain information related to the underlying respiratory physiology and anatomy. This study presented a multi-level database of simulated exhaled aerosol images from both normal and diseased lungs. An anatomically accurate mouth-lung geometry extending to G9 was modified to model two stages of obstructions in small airways and physiology-based simulations were utilized to capture the fluid-particle dynamics and exhaled aerosol images from varying breath tests. The dataset was designed to test two performance metrics of convolutional neural network (CNN) models when used for transfer learning: interpolation and extrapolation. To this aim, three testing datasets with decreasing image similarities were developed (i.e., level 1, inbox, and outbox). Four network models (AlexNet, ResNet-50, MobileNet, and EfficientNet) were tested and the performances of all models decreased for the outbox test images, which were outside the design space. The effect of continuous learning was also assessed for each model by adding new images into the training dataset and the newly trained network was tested at multiple levels. Among the four network models, ResNet-50 excelled in performance in both multi-level testing and continuous learning, the latter of which enhanced the accuracy of the most challenging classification task (i.e., 3-class with outbox test images) from 60.65% to 98.92%. The datasets can serve as a benchmark training/testing database for validating existent CNN models or quantifying the performance metrics of new CNN models. Full article
(This article belongs to the Special Issue Artificial Intelligence and Big Data Applications in Diagnostics)
Show Figures

Figure 1

Data Descriptor
Quantitative Metabolomic Dataset of Avian Eye Lenses
Data 2023, 8(8), 125; https://doi.org/10.3390/data8080125 - 31 Jul 2023
Viewed by 392
Abstract
Metabolomics is a powerful set of methods that uses analytical techniques to identify and quantify metabolites in biological samples, providing a snapshot of the metabolic state of a biological system. In medicine, metabolomics may help to reveal the molecular basis of a disease, [...] Read more.
Metabolomics is a powerful set of methods that uses analytical techniques to identify and quantify metabolites in biological samples, providing a snapshot of the metabolic state of a biological system. In medicine, metabolomics may help to reveal the molecular basis of a disease, make a diagnosis, and monitor treatment responses, while in agriculture, it can improve crop yields and plant breeding. However, animal metabolomics faces several challenges due to the complexity and diversity of animal metabolomes, the lack of standardized protocols, and the difficulty in interpreting metabolomic data. The current dataset includes quantitative metabolomic profiles of eye lenses from 26 bird species (111 specimens) that can aid researchers in developing new experiments, mathematical models, and integrating with other “-omics” data. The dataset includes raw 1H NMR spectra, protocols for sample preparation, and data preprocessing, with the final table containing information on the abundance of 89 reliably identified and quantified metabolites. The dataset is quantitative, making it relevant for supplementing with new specimens or comparison groups, followed by data mining and expected new interpretations. The data were obtained using the bird specimens collected in compliance with ethical standards and revealed potential differences in metabolic pathways due to phylogenetic differences or environmental exposure. Full article
Show Figures

Figure 1

Article
Measuring the Effect of Fraud on Data-Quality Dimensions
Data 2023, 8(8), 124; https://doi.org/10.3390/data8080124 - 30 Jul 2023
Viewed by 329
Abstract
Data preprocessing moves the data from raw to ready for analysis. Data resulting from fraud compromises the quality of the data and the resulting analysis. It can exist in datasets such that it goes undetected since it is included in the analysis. This [...] Read more.
Data preprocessing moves the data from raw to ready for analysis. Data resulting from fraud compromises the quality of the data and the resulting analysis. It can exist in datasets such that it goes undetected since it is included in the analysis. This study proposed a process for measuring the effect of fraudulent data during data preparation and its possible influence on quality. The five-step process begins with identifying the business rules related to the business process(s) affected by fraud and their associated quality dimensions. This is followed by measuring the business rules in the specified timeframe, detecting fraudulent data, cleaning them, and measuring their quality after cleaning. The process was implemented in the case of occupational fraud within a hospital context and the illegal issuance of underserved sick leave. The aim of the application is to identify the quality dimensions that are influenced by the injected fraudulent data and how these dimensions are affected. This study agrees with the existing literature and confirms its effects on timeliness, coherence, believability, and interpretability. However, this did not show any effect on consistency. Further studies are needed to arrive at a generalizable list of the quality dimensions that fraud can affect. Full article
Show Figures

Figure 1

Article
Blockchain Payment Services in the Hospitality Sector: The Mediating Role of Data Security on Utilisation Efficiency of the Customer
Data 2023, 8(8), 123; https://doi.org/10.3390/data8080123 - 30 Jul 2023
Viewed by 432
Abstract
Blockchain technology has the potential to completely transform the hospitality sector by offering a safe, open, and effective method of payment. Increased customer utilisation efficiency may result from this. This study looks into how blockchain payment methods affect hotel customers’ intentions to stay [...] Read more.
Blockchain technology has the potential to completely transform the hospitality sector by offering a safe, open, and effective method of payment. Increased customer utilisation efficiency may result from this. This study looks into how blockchain payment methods affect hotel customers’ intentions to stay loyal by devising four hypotheses. A questionnaire was specifically created and self-administered for this study as a data-gathering tool and distributed to hotel customers. The I.B.M. SPSS and Amos software packages were used to analyse the data of the 301 valid responses. Findings show that hospitality customers may use blockchain payment services if the customer is satisfied with the data security of this payment system. The study also highlighted that customer data security mediated the association between utilisation efficiency and blockchain payment systems. Blockchain payment services can affect visitors’ intentions to stay loyal by impacting data security and consumer happiness. Results suggest that blockchain payment systems can be useful for hospitality firms looking to increase client utilisation efficiency. Blockchain can simplify visitor booking and payment processes by providing a safe, open, and effective transacting method. This may result in a satisfying encounter that visitors are more inclined to recall and repeat. Full article
(This article belongs to the Special Issue Blockchain Applications in Data Management and Governance)
Show Figures

Figure 1

Previous Issue
Next Issue
Back to TopTop