

The Influence of the Hardness of the Tested Material and the Surface Preparation Method on the Results of Ultrasonic Testing

Abstract
:1. Introduction
2. Ultrasonic Testing of Materials
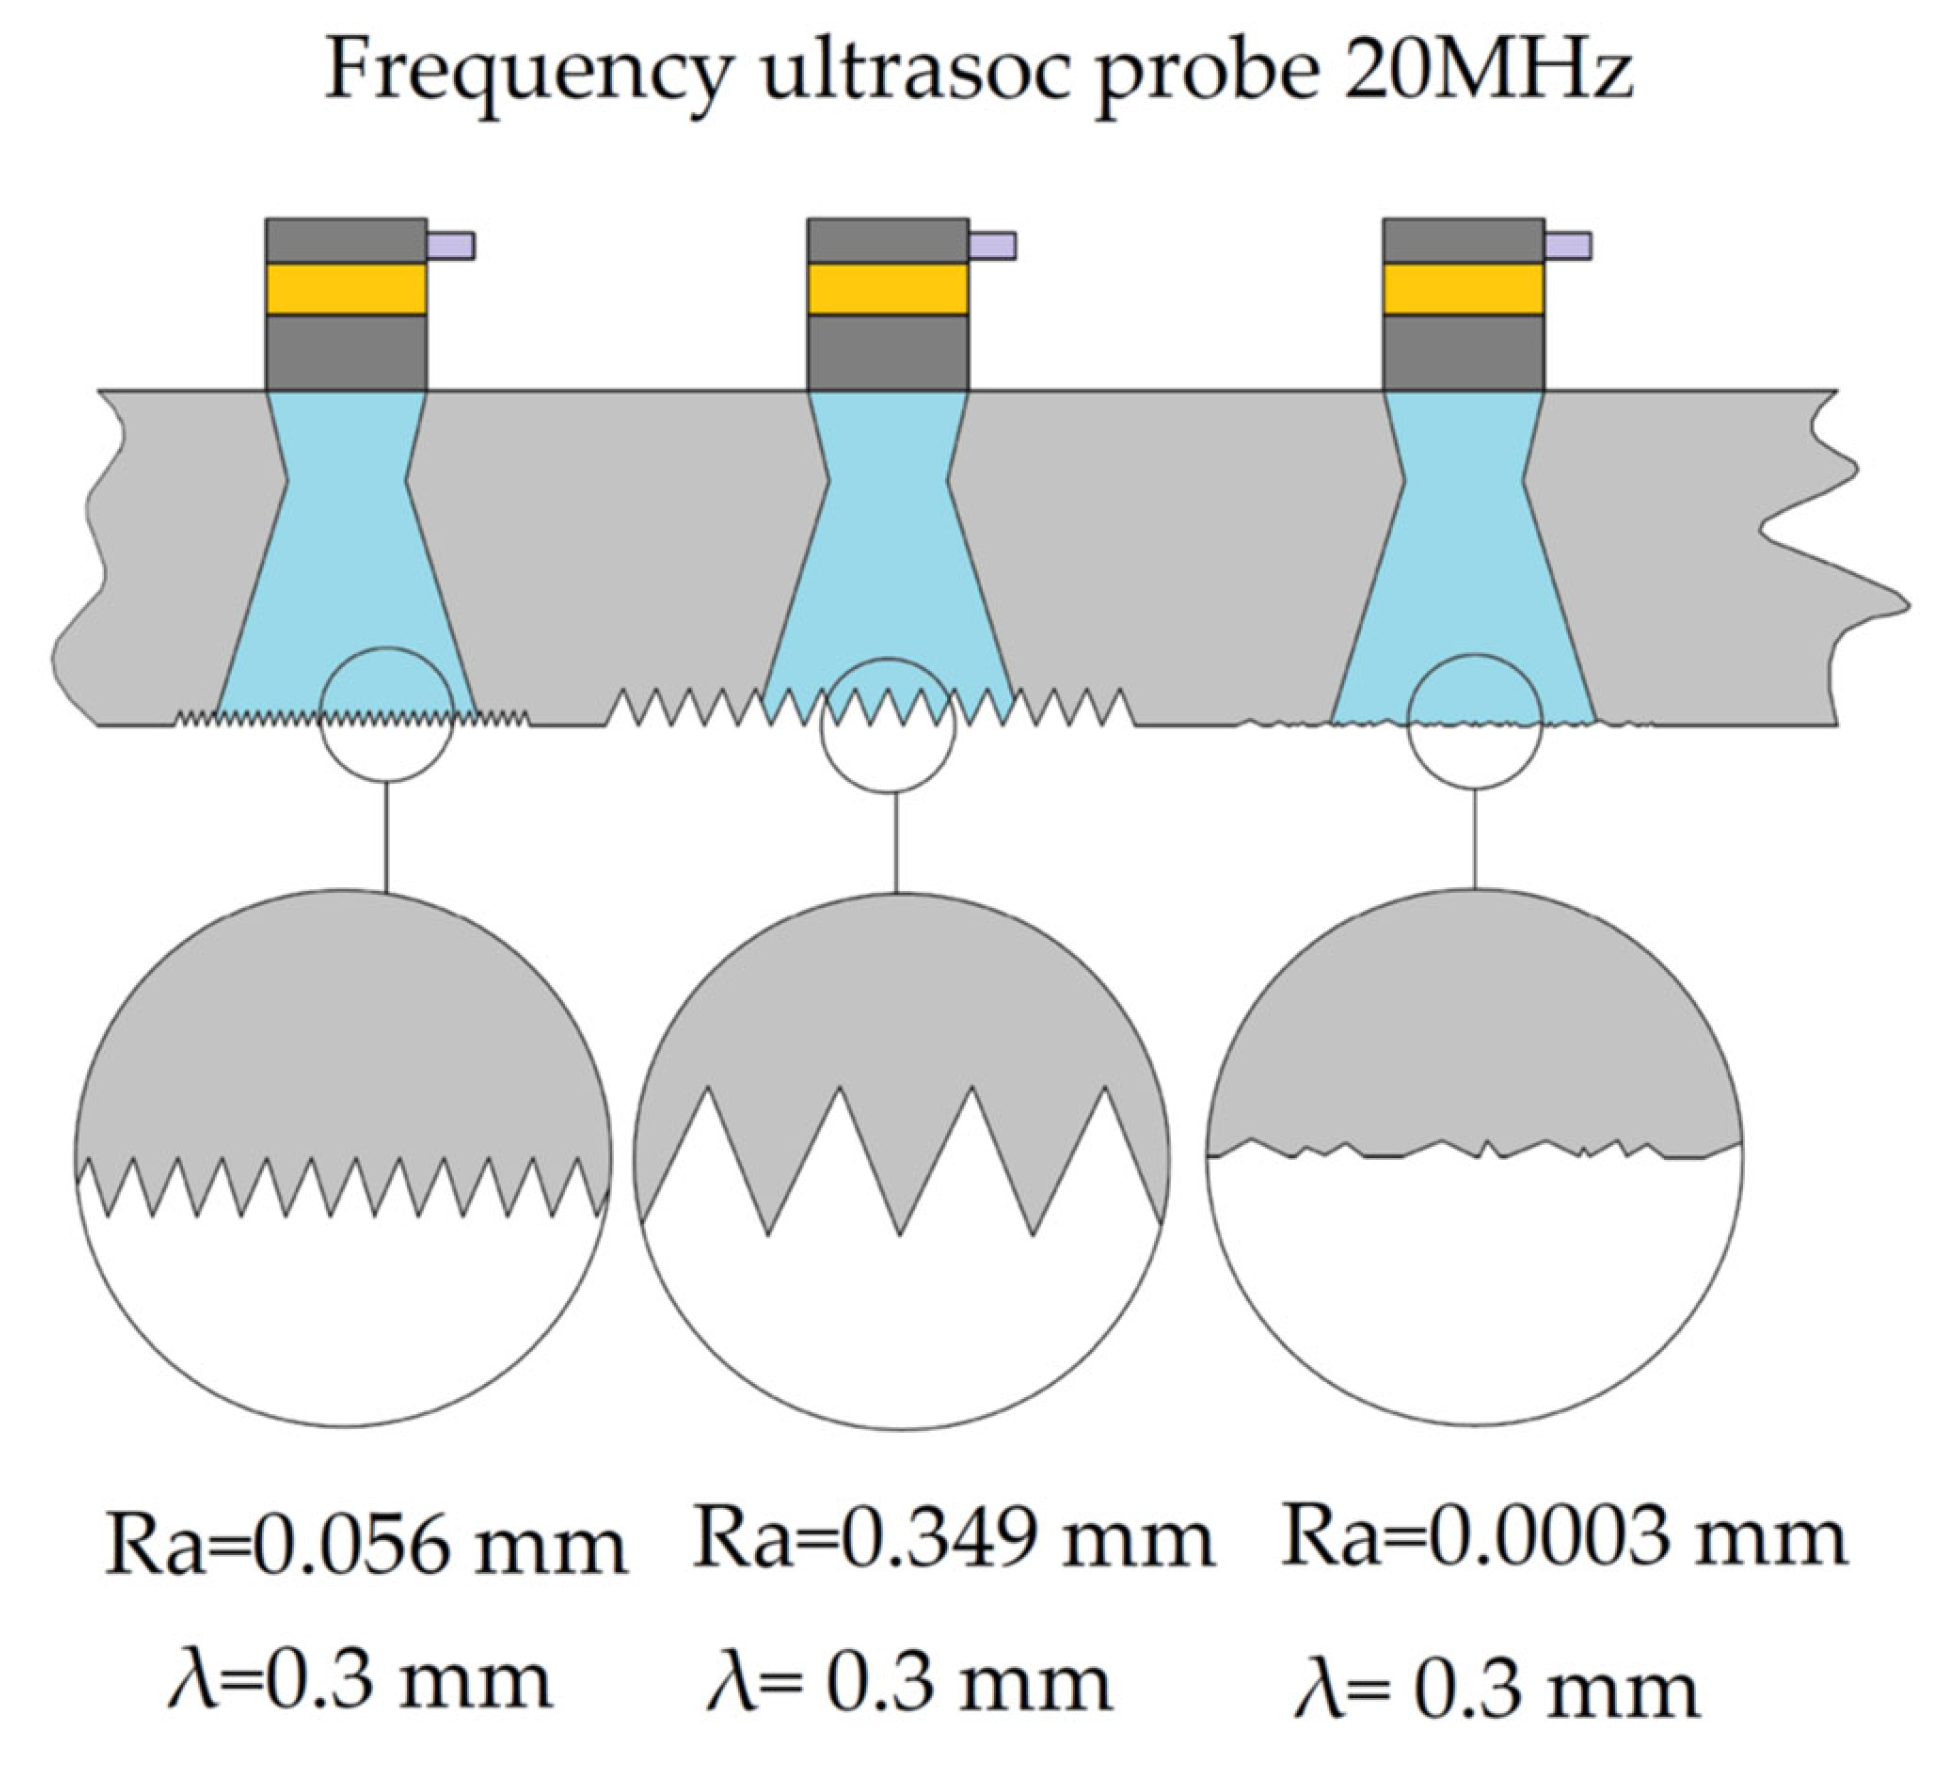
2.1. Studies of Areas with Different Surface Roughness
- B—beam diameter mm,
- s—distance from the ultrasonic transducer mm,
- k—coefficient of amplitude decrease across the beam width by 6 dB (k = 0.5) and by 10 dB (k = 0.87),
- c—wave velocity in the material m/s,
- f—probe frequency Hz,
- D—transducer diameter mm.
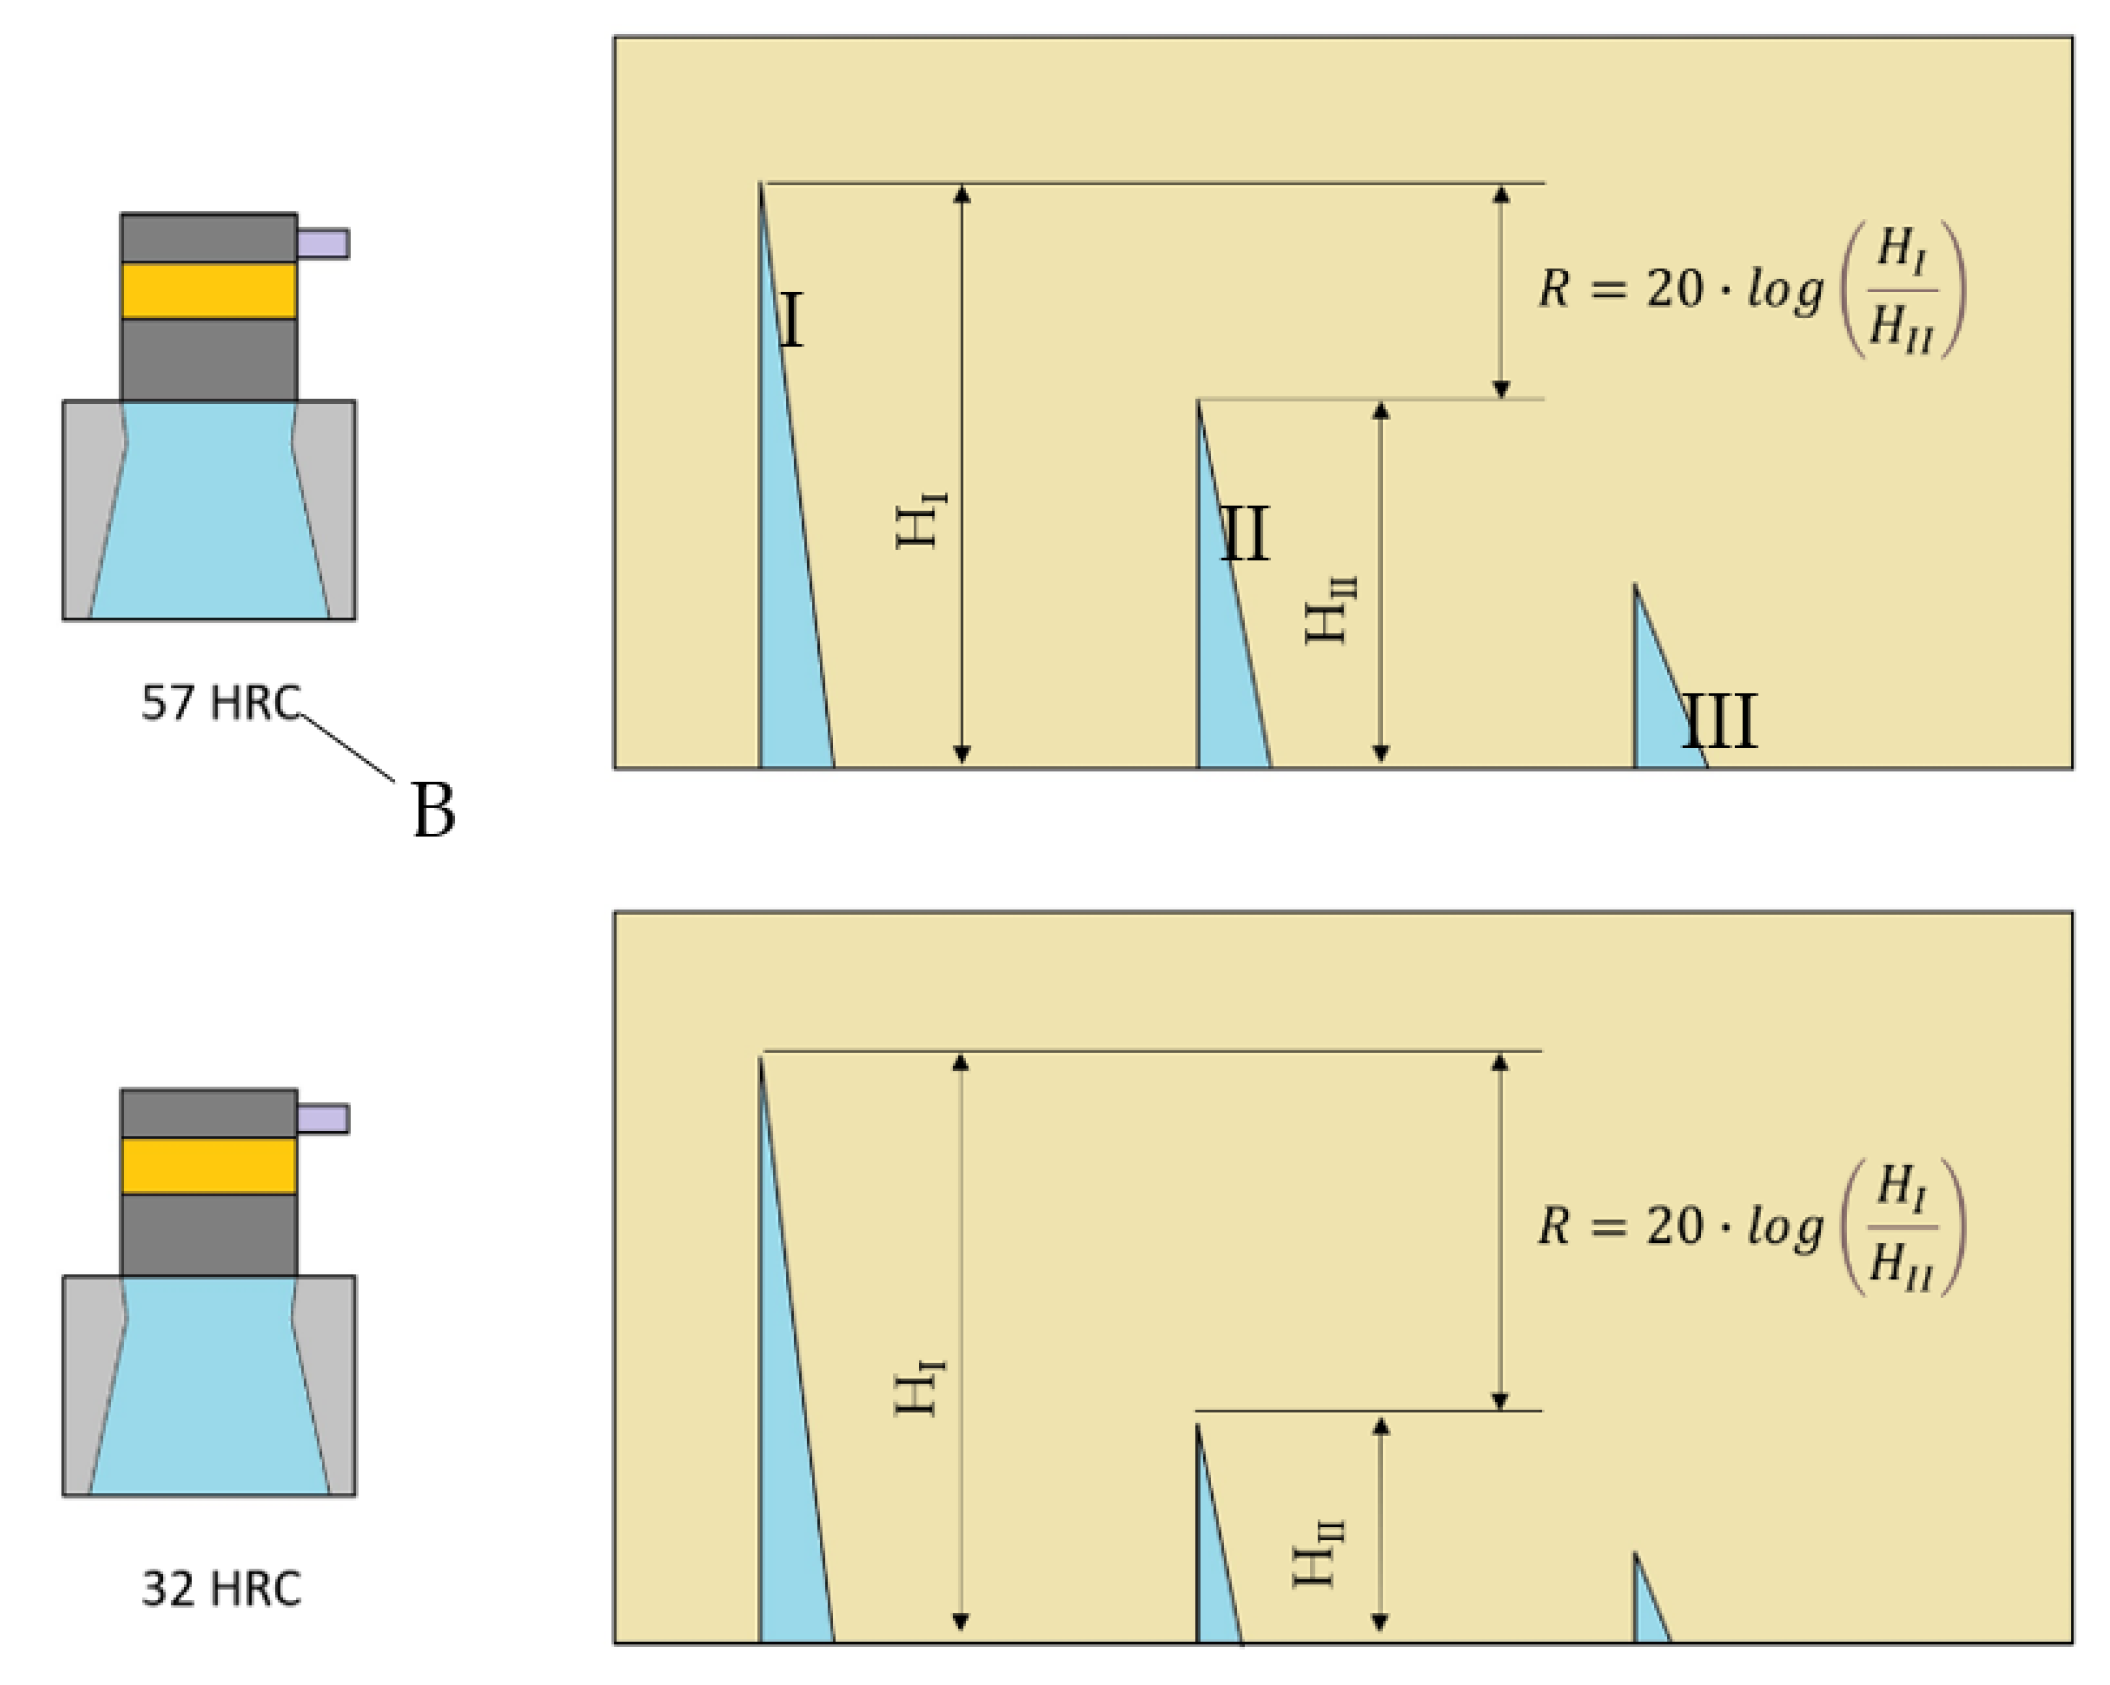
2.2. Testing of Specimens with Different Hardnesses
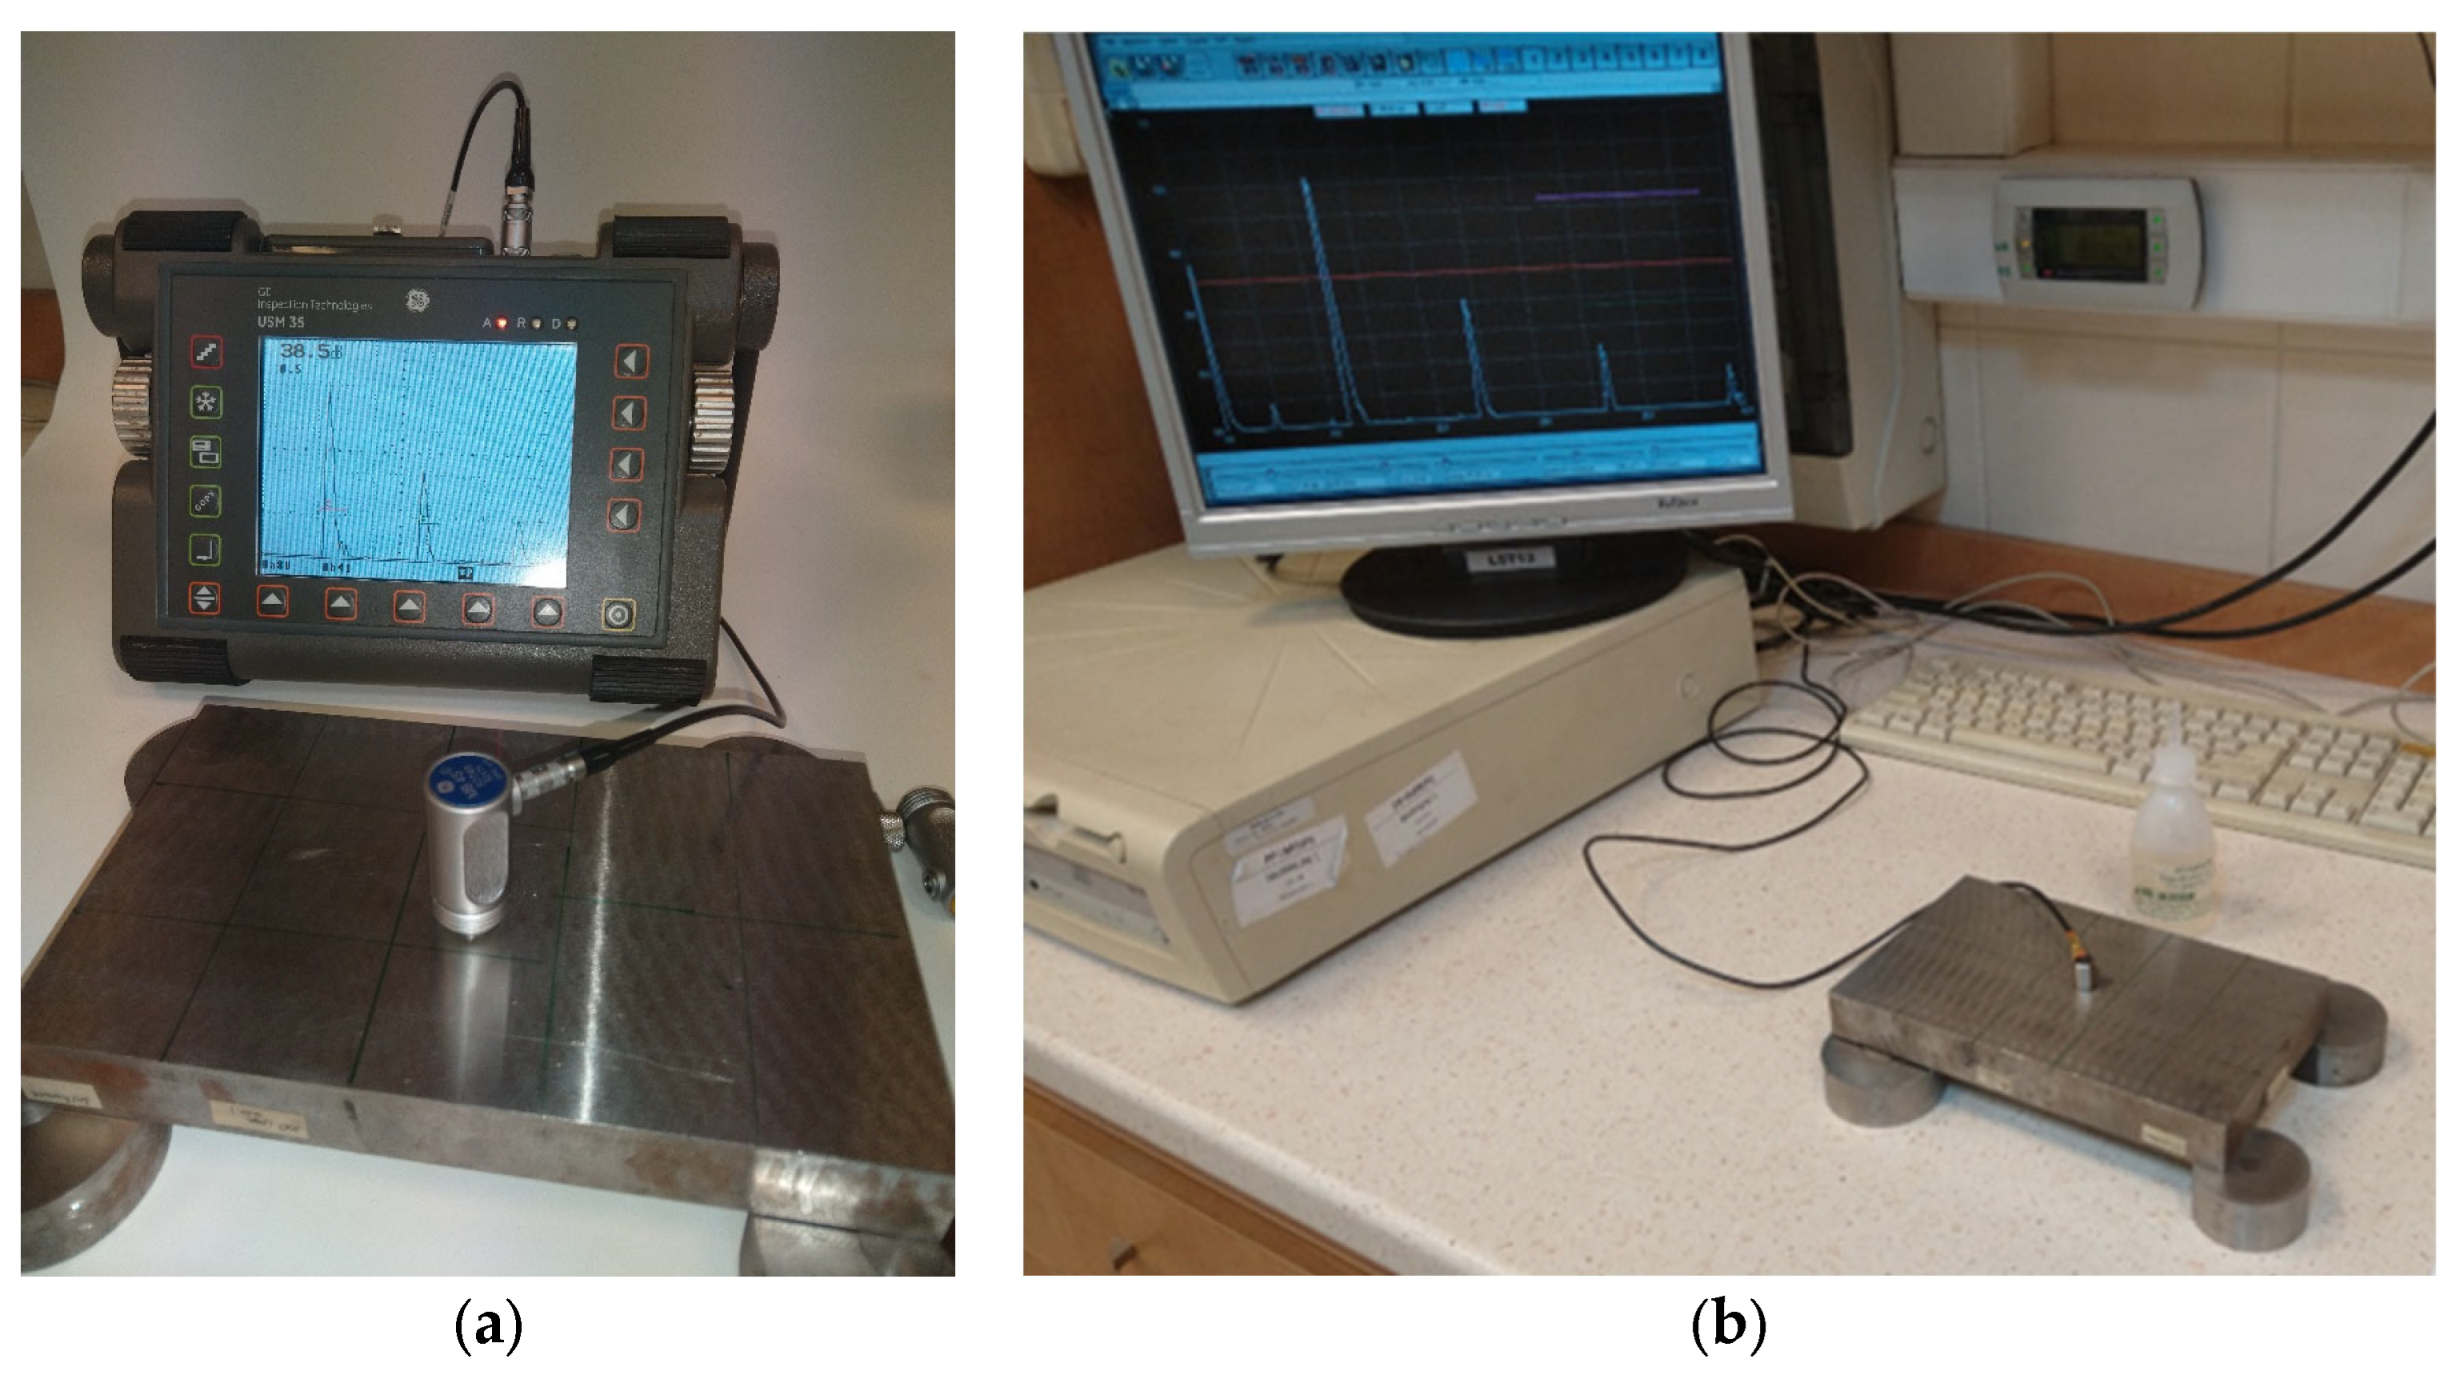
3. Results of Our Own Ultrasonic Tests
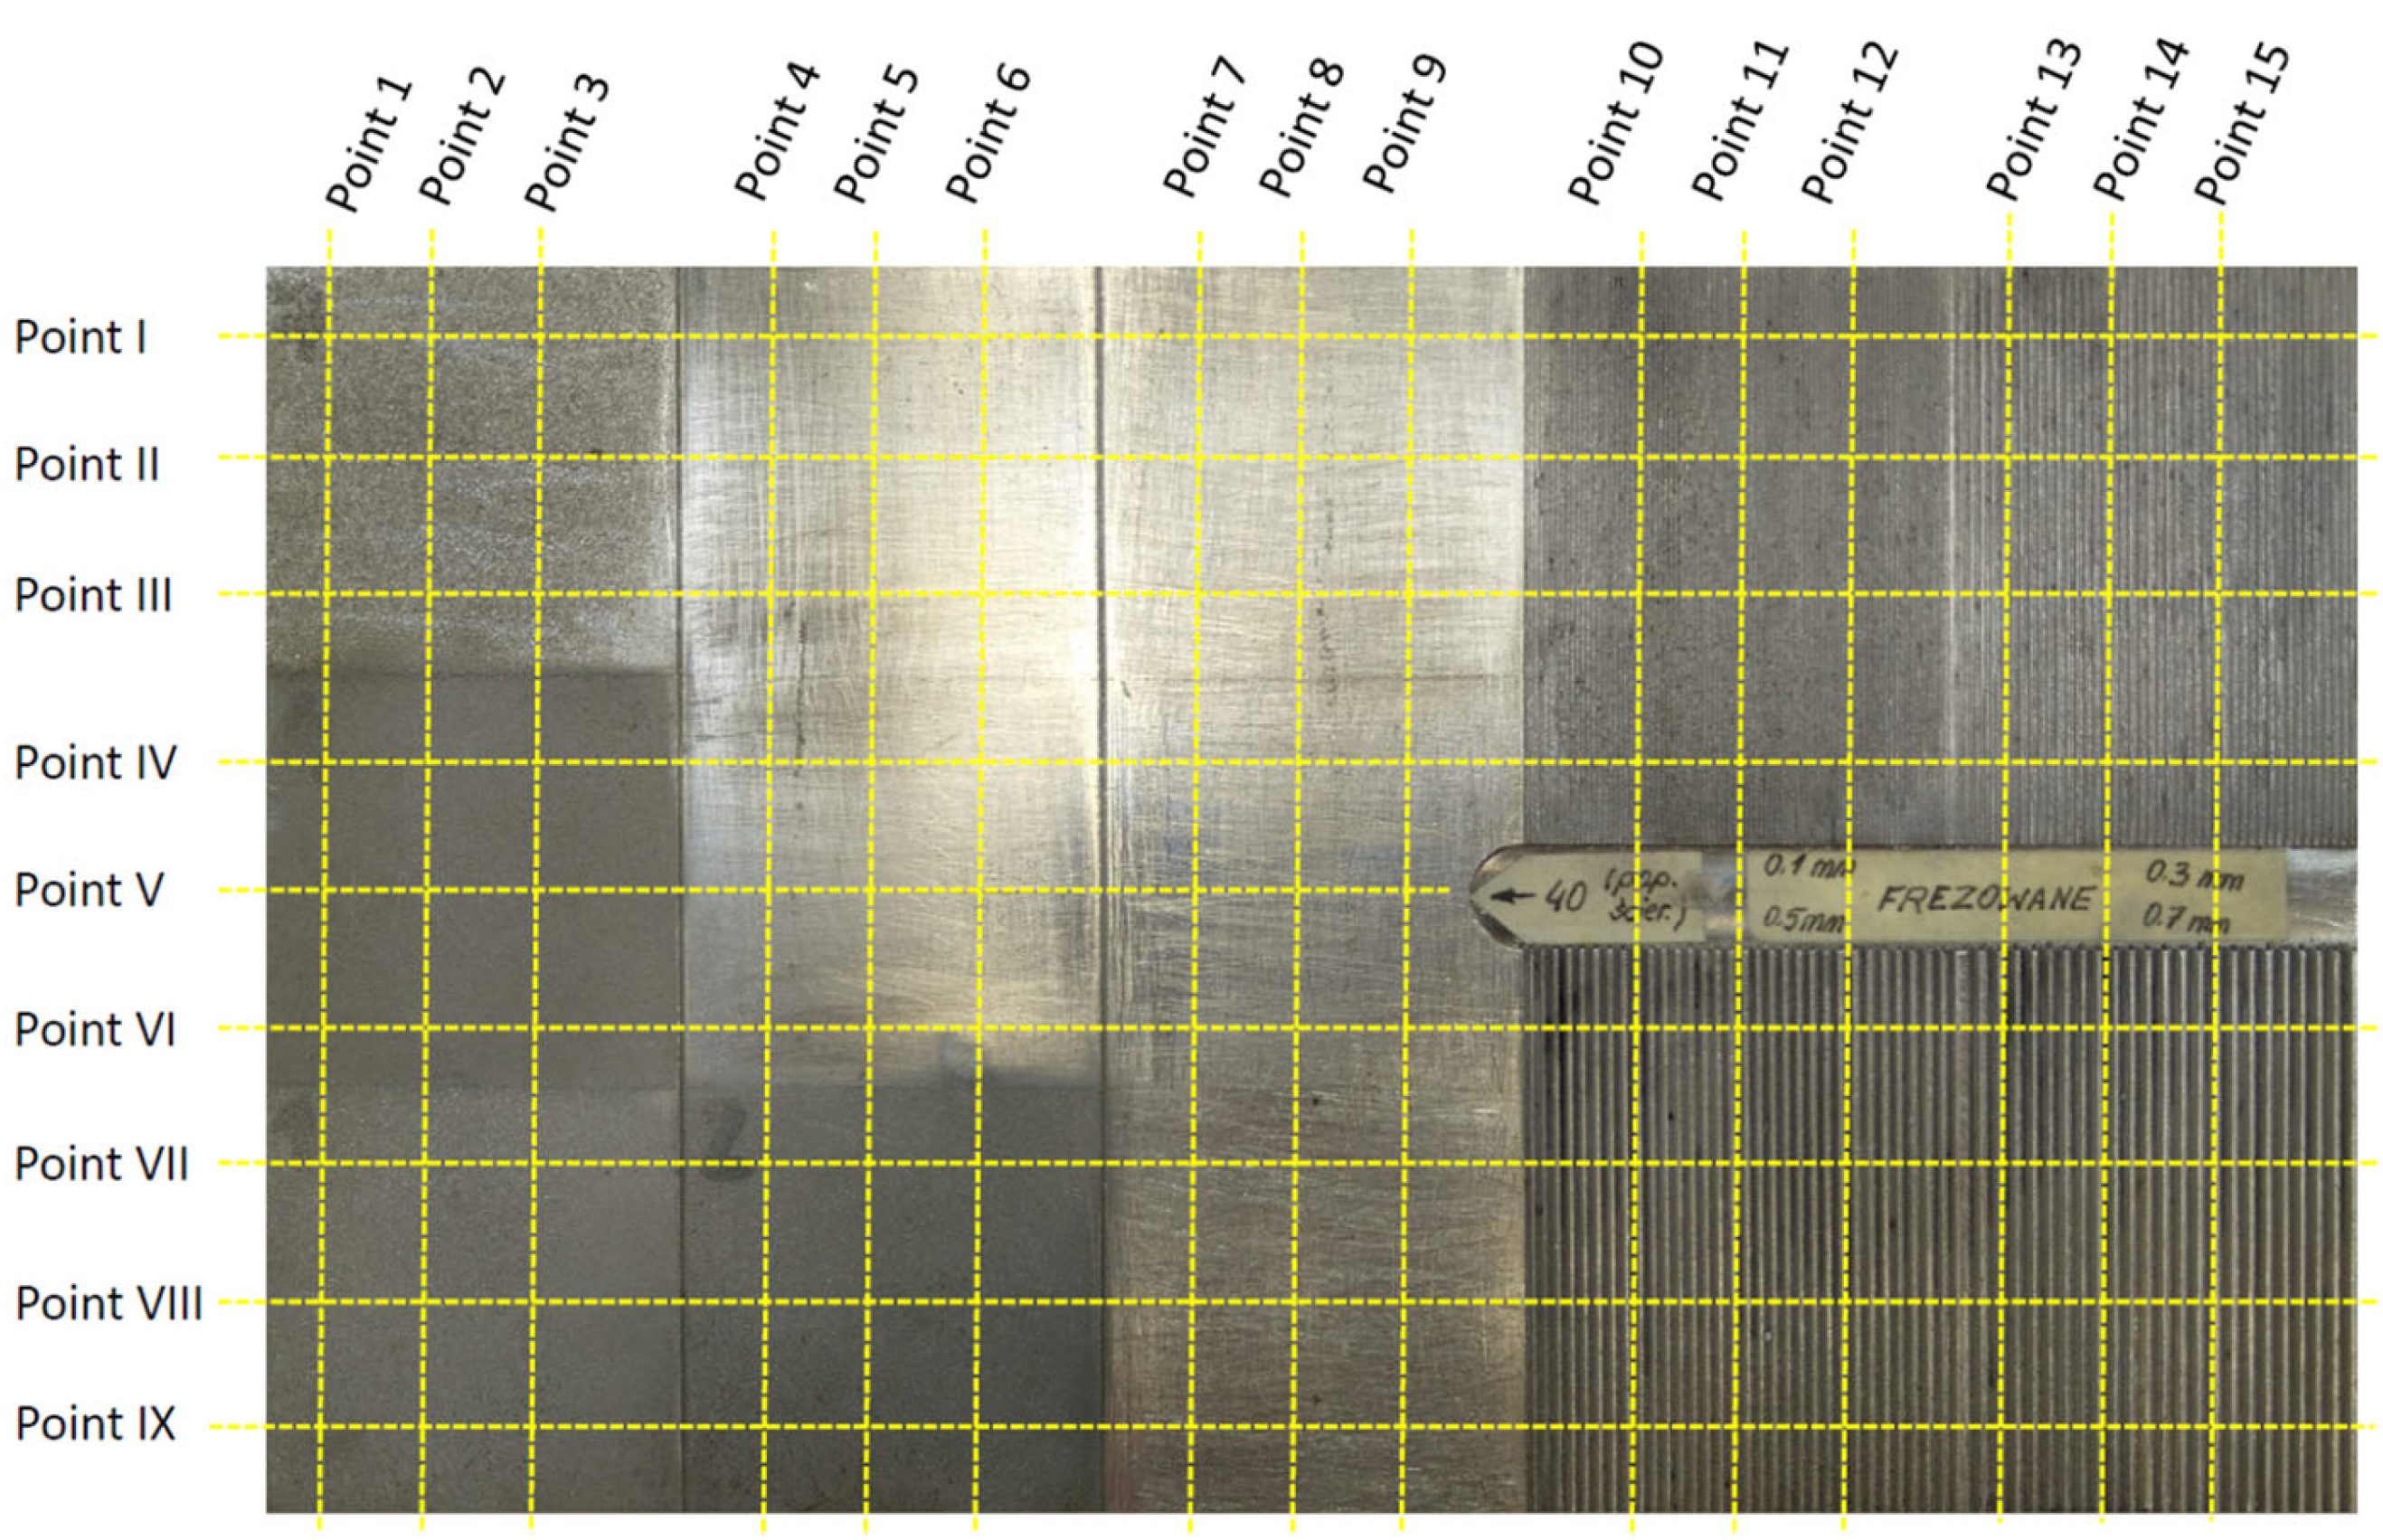
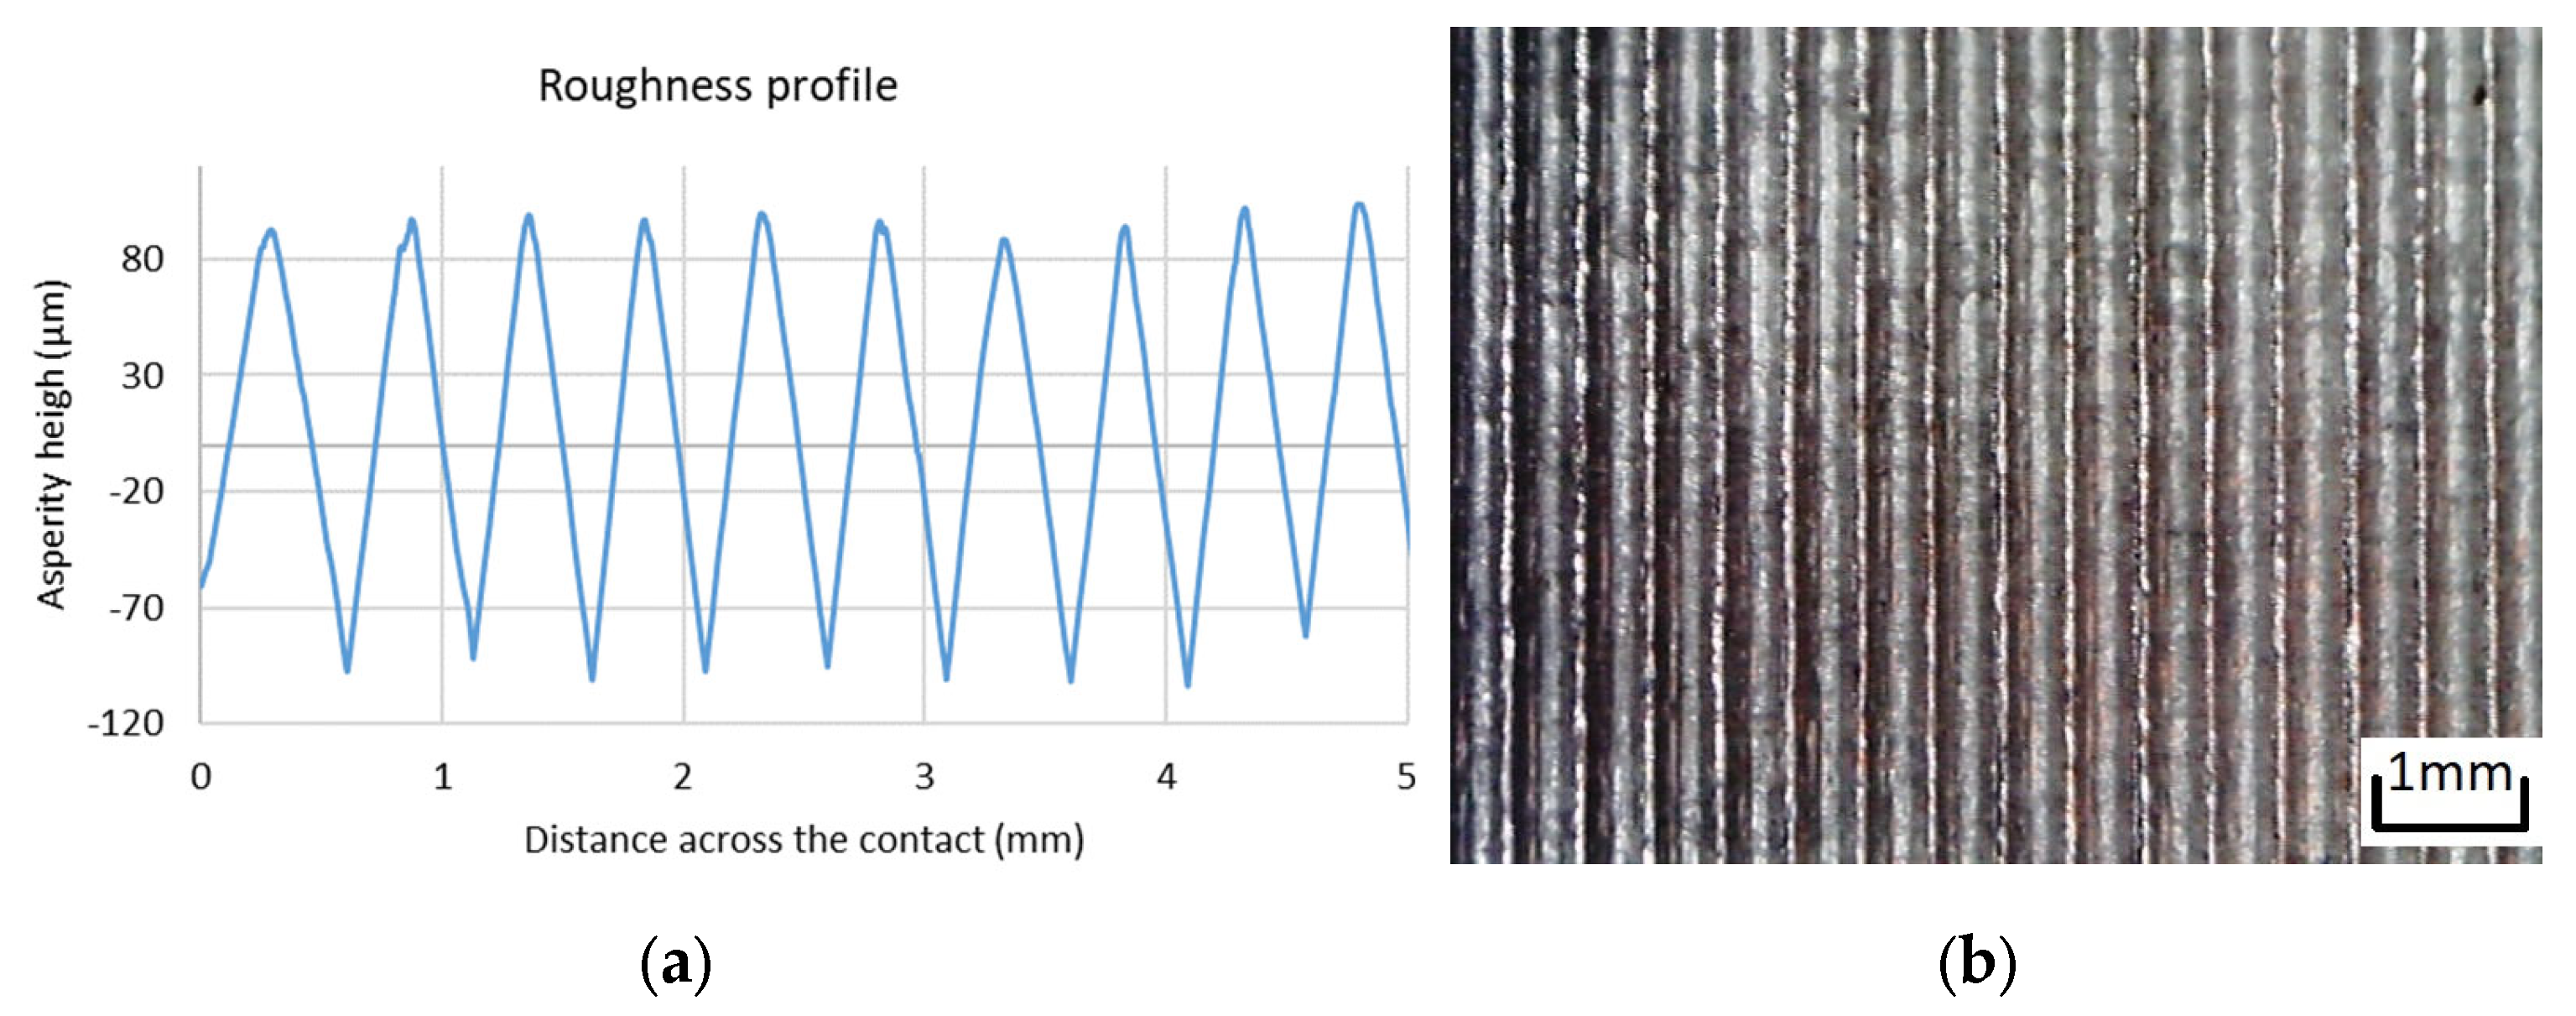
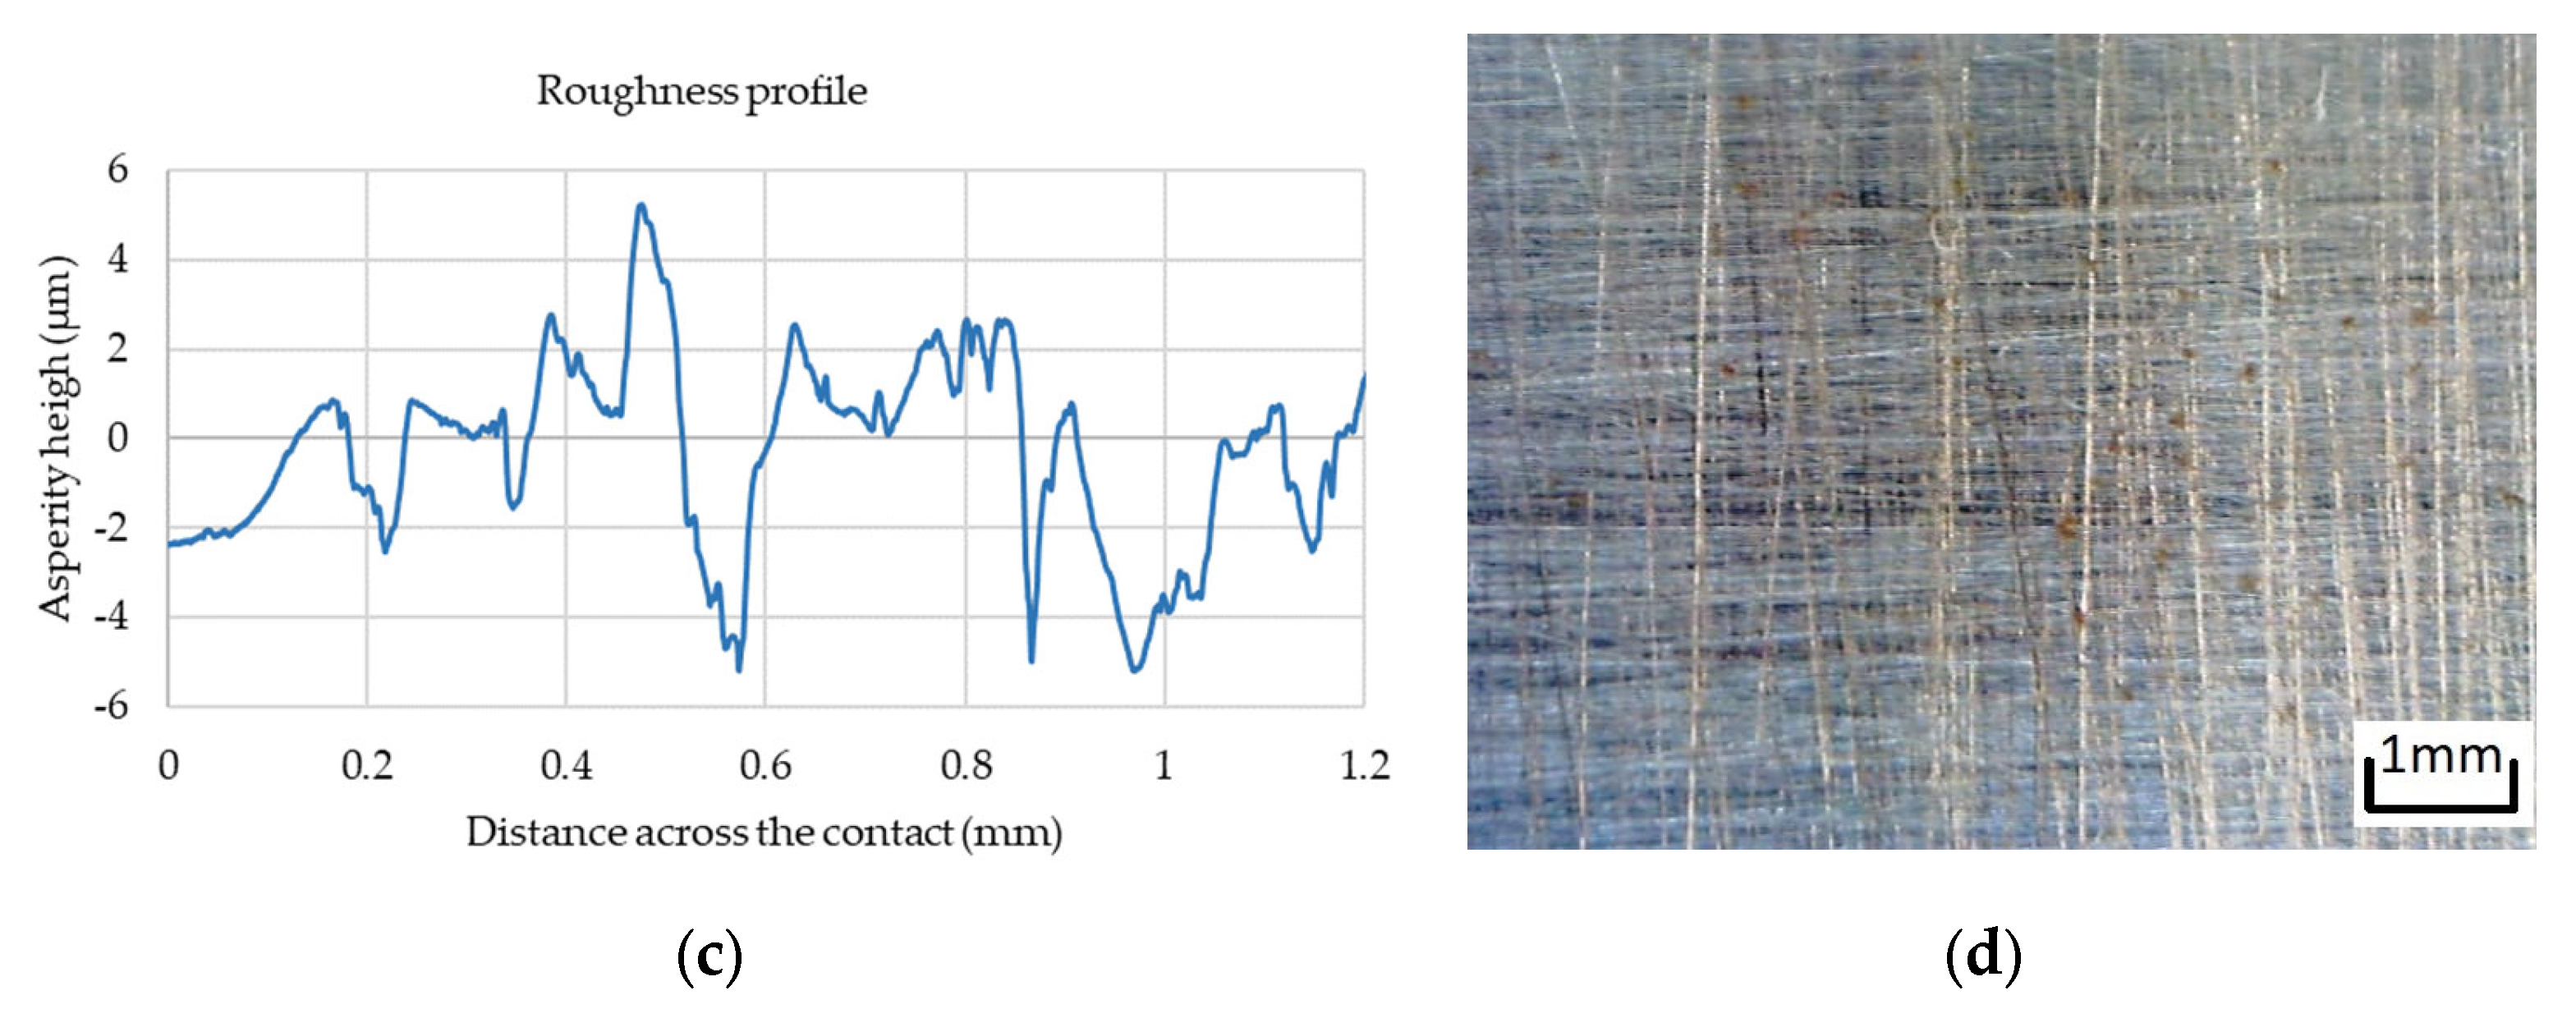
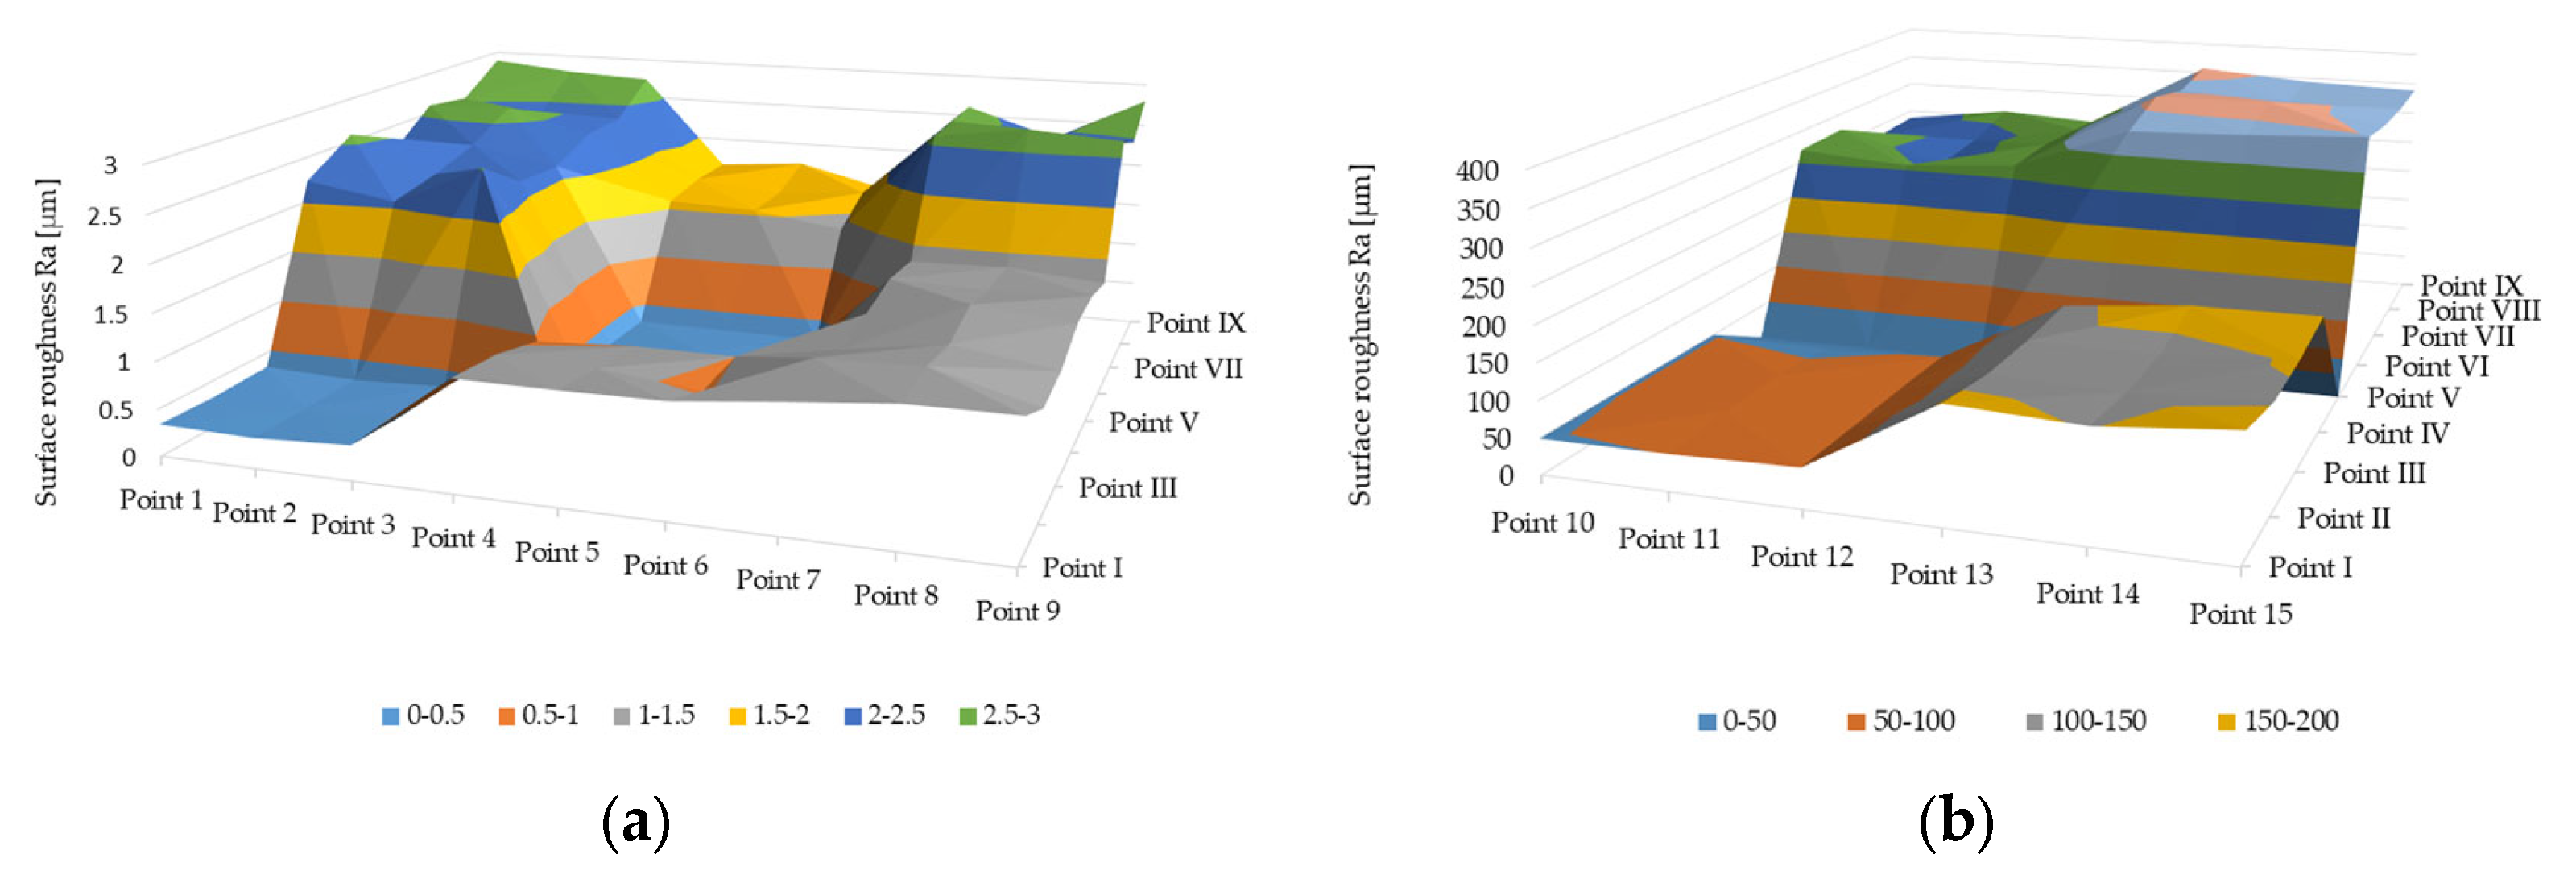
3.1. Surface Roughness Results
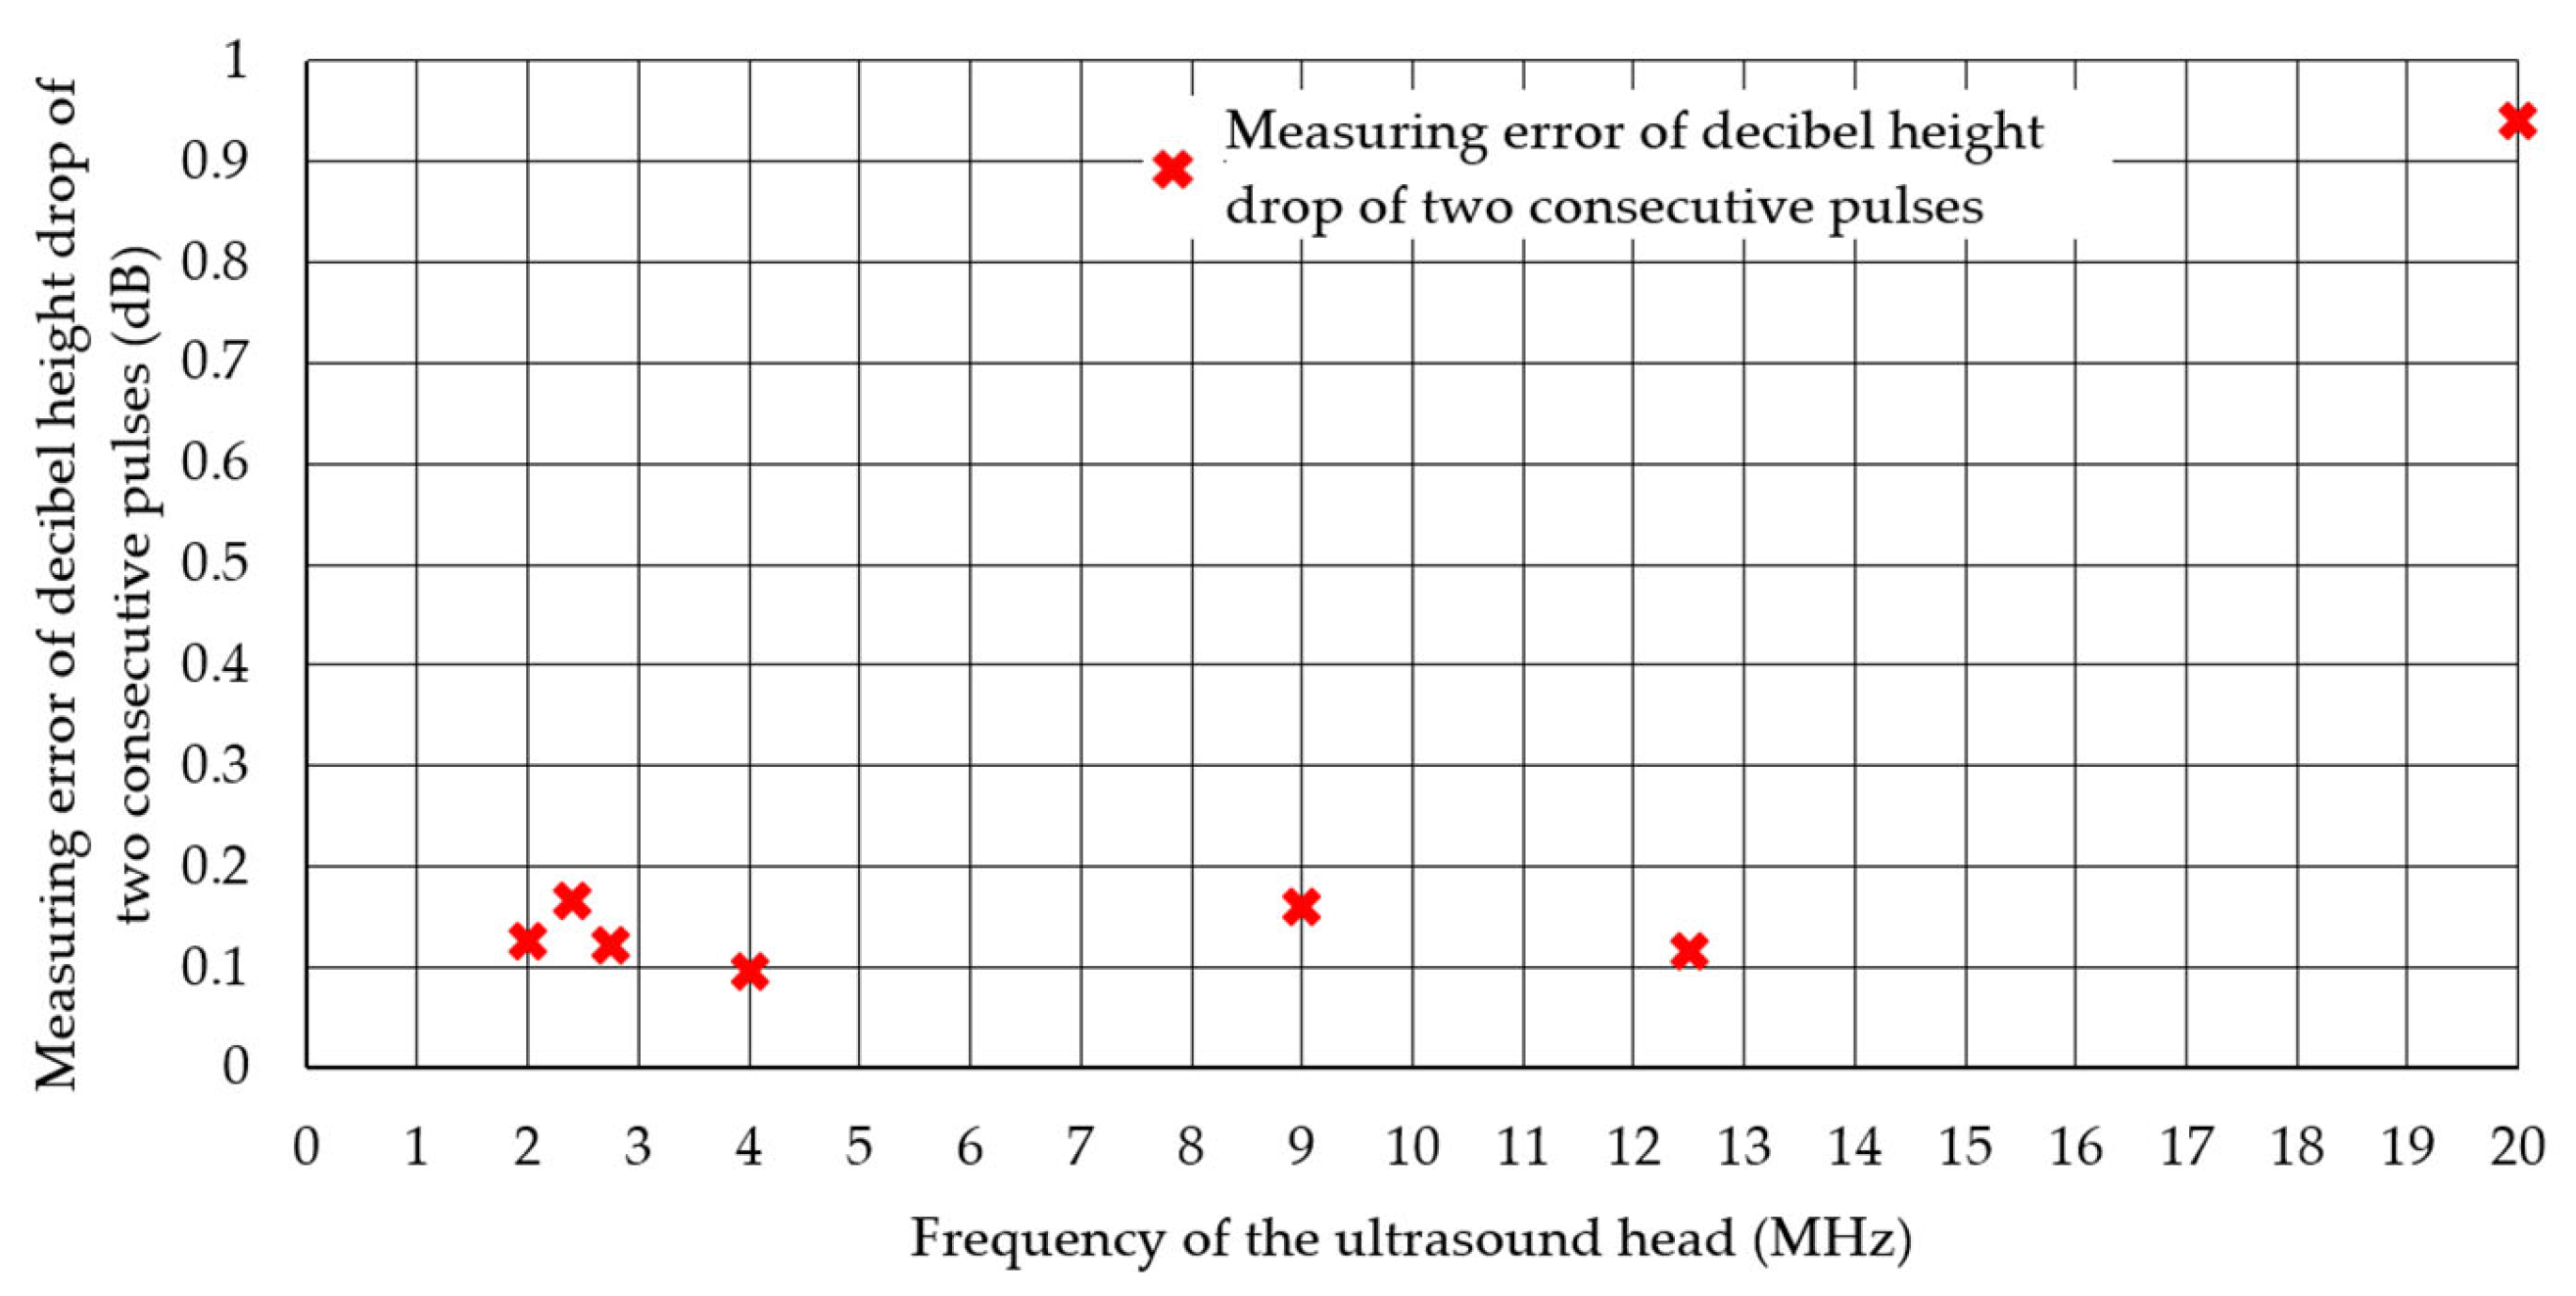
3.2. Hardness Estimation Results
4. Discussion
5. Conclusions
Author Contributions
Funding
Institutional Review Board Statement
Informed Consent Statement
Data Availability Statement
Conflicts of Interest
References
- Farrahi, G.H.; Lebrun, J.L. Surface hardness measurement and microstructural characterisation of steel by X-ray diffraction profile analysis. Int. J. Eng. 1995, 8, 159–167. [Google Scholar]
- Grzyb, K.; Drobiec, Ł.; Blazy, J.; Zając, J. The Use of NDT Diagnostic Methods and Calculations in Assessing the Masonry Tower Crowned with the Steel Dome. Materials 2022, 15, 7196. [Google Scholar] [CrossRef] [PubMed]
- Szymanik, A.; Psuj, G.; Hashemi, M.; Lopato, P. Detection and Identification of Defects in 3D-Printed Dielectric Structures via Thermographic Inspection and Deep Neural Networks. Materials 2021, 14, 4168. [Google Scholar] [CrossRef] [PubMed]
- Maciusowicz, M.; Psuj, G. Time-Frequency Analysis of Barkhausen Noise for the Needs of Anisotropy Evaluation of Grain-Oriented Steels. Sensors 2020, 20, 768. [Google Scholar] [CrossRef]
- Xueliang, R.; Anqiao, X.; Pin, Z.; Ming, Y.; Jianqing, B.; Xinxin, W. Fatigue performance of composite trough-girders with corrugated-steel-webs. J. Constr. Steel Res. 2023, 207, 107974. [Google Scholar] [CrossRef]
- Wright, W.M.D.; Hutchins, D.A. Air-coupled ultrasonic testing of metals using broadband pulses in through-transmission. Ultrasonics 1999, 37, 19–22. [Google Scholar] [CrossRef]
- Kinra, V.K.; Dayal, V. A new technique for ultrasonic-nondestructive evaluation of thin specimens. Exp. Mech. 1988, 28, 288–297. [Google Scholar] [CrossRef]
- Terence, T.P. Ultrasonic thickness measurement of nonporous membranes with long wavelengths. Ultrasonics 2021, 113, 106370. [Google Scholar] [CrossRef]
- Kim, C.; Yin, H.; Shmatok, A.; Prorok, B.C.; Lou, X.; Matlack, K.H. Ultrasonic nondestructive evaluation of laser powder bed fusion 316L stainless steel. Addit. Manuf. 2021, 38, 101800. [Google Scholar] [CrossRef]
- Allam, A.; Alfahmi, O.; Patel, H.; Sugino, C.; Harding, M.; Ruzzene, M.; Erturk, A. Ultrasonic testing of thick and thin In-conel 625 alloys manufactured by laser powder bed fusion. Ultrasonics 2022, 125, 106780. [Google Scholar] [CrossRef]
- Lopez, A.; Bacelar, R.; Pires, I.; Santos, T.G.; Sousa, J.P.; Quintino, L. Non-destructive testing application of radiography and ultrasound for wire and arc additive manufacturing. Addit. Manuf. 2018, 21, 298–306. [Google Scholar] [CrossRef]
- Davis, G.; Nagarajah, R.; Palanisamy, S.; Rashid, R.A.R.; Rajagopal, P.; Balasubramaniam, K. Laser ultrasonic inspection of additive manufactured components. Int. J. Adv. Manuf. Technol. 2019, 102, 2571–2579. [Google Scholar] [CrossRef]
- Fatih, U.; Ali Nezihi, B. Application of ultrasonic waves in measurement of hardness of welded carbon steels. Def. Technol. 2015, 11, 255–261. [Google Scholar] [CrossRef]
- Ulbrich, D.; Kańczurzewska, M. Correlation Tests of Ultrasonic Wave and Mechanical Parameters of Spot-Welded Joints. Materials 2022, 15, 1701. [Google Scholar] [CrossRef]
- Allen, J.C.P.; Ng, C.T. Debonding detection at adhesive joints using nonlinear Lamb waves mixing. NDT E Int. 2022, 125, 102552. [Google Scholar] [CrossRef]
- Kowalczyk, J.; Lopato, P.; Psuj, G.; Ulbrich, D. Glass–Adhesive–Steel Joint Inspection Using Mechanic and High Frequency Electromagnetic Waves. Materials 2020, 13, 4648. [Google Scholar] [CrossRef]
- Kowalczyk, J.; Ulbrich, D.; Nowak, M.; Sędłak, K.; Gruber, K.; Kurzynowski, T.; Jósko, M. Acoustic Properties Comparison of Ti6Al4V Produced by Conventional Method and AM Technology in the Aspect of Ultrasonic Structural Health Monitoring of Adhesive Joints. Appl. Sci. 2023, 13, 371. [Google Scholar] [CrossRef]
- Fu, Y.; Hu, P.; Turner, J.A.; Song, Y.; Li, X. Ultrasonic flaw detection for two-phase Ti-6Al-4V based on secondary scattering. NDT E Int. 2019, 102, 199–206. [Google Scholar] [CrossRef]
- İşleyici, U. Effect of Surface Roughness on Ultrasonic Testing. Master’s Thesis, Middle East Technical University, Ankara, Turkey, December 2005. [Google Scholar]
- ISO 5817:2014; Welding—Fusion-Welded Joints in Steel, Nickel, Titanium and Their Alloys (Beam Welding Excluded)—Quality Levels for Imperfections. ISO: Geneva, Switzerland, 2014.
- Hsia, S.Y.; Chou, Y.T. Assessing the Hardness of Quenched Medium Steel Using and Ultrasonic Nondestructive Method. Adv. Mater. Sci. Eng. 2015, 2015, 684836. [Google Scholar] [CrossRef]
- Kupperman, D.S.; Reimann, K.J. Effects of Microstructure on Ultrasonic Examination of Stainless Steel. United States, 1976. Available online: https://www.osti.gov/servlets/purl/7313924 (accessed on 10 February 2023).
- İsmail, H.; Sarpün, M.; Selami, K.; Sabri, T. Mean grain size determination in marbles by ultrasonic velocity techniques. NDT E Int. 2005, 38, 21–25. [Google Scholar] [CrossRef]
- Lukomski, T.; Stepinski, T. Steel hardness evaluation based on ultrasound velocity measurements. Insight Non-Destr. Test. Cond. Monit. 2010, 52, 592–596. [Google Scholar] [CrossRef]
- Wang, Z.; Fan, Z.; Chen, X.; Kang, Y.; Cheng, J.; Chen, W. Modeling and Experimental Analysis of Roughness Effect on Ultrasonic Nondestructive Evaluation of Micro-crack. Chin. J. Mech. Eng. 2021, 34, 114. [Google Scholar] [CrossRef]
- Zou, F.; Cegla, F.B. High-Accuracy Ultrasonic Corrosion Rate Monitoring. Corrosion 2018, 74, 372–382. [Google Scholar] [CrossRef] [PubMed]
- Nagy, P.B.; Rose, J.H. Surface roughness and the ultrasonic detection of subsurface scatterers. J. Appl. Phys. 1993, 73, 566–580. [Google Scholar] [CrossRef]


| Type of Processing | Ra |
|---|---|
| Sandpaper 150 | 0.34 |
| Sandpaper 100 | 1.06 |
| Sandpaper 60 | 1.30 |
| Sandpaper 40 | 1.36 |
| Sandpaper 20 | 2.57 |
| Sandblasting EK100 | 0.33 |
| Sandblasting EK60 | 1.59 |
| Sandblasting EK40 | 2.27 |
| Blasting | 2.59 |
| Milling 0.1 | 50.62 |
| Milling 0.3 | 149.15 |
| Milling 0.5 | 250.73 |
| Milling 0.7 | 348.69 |
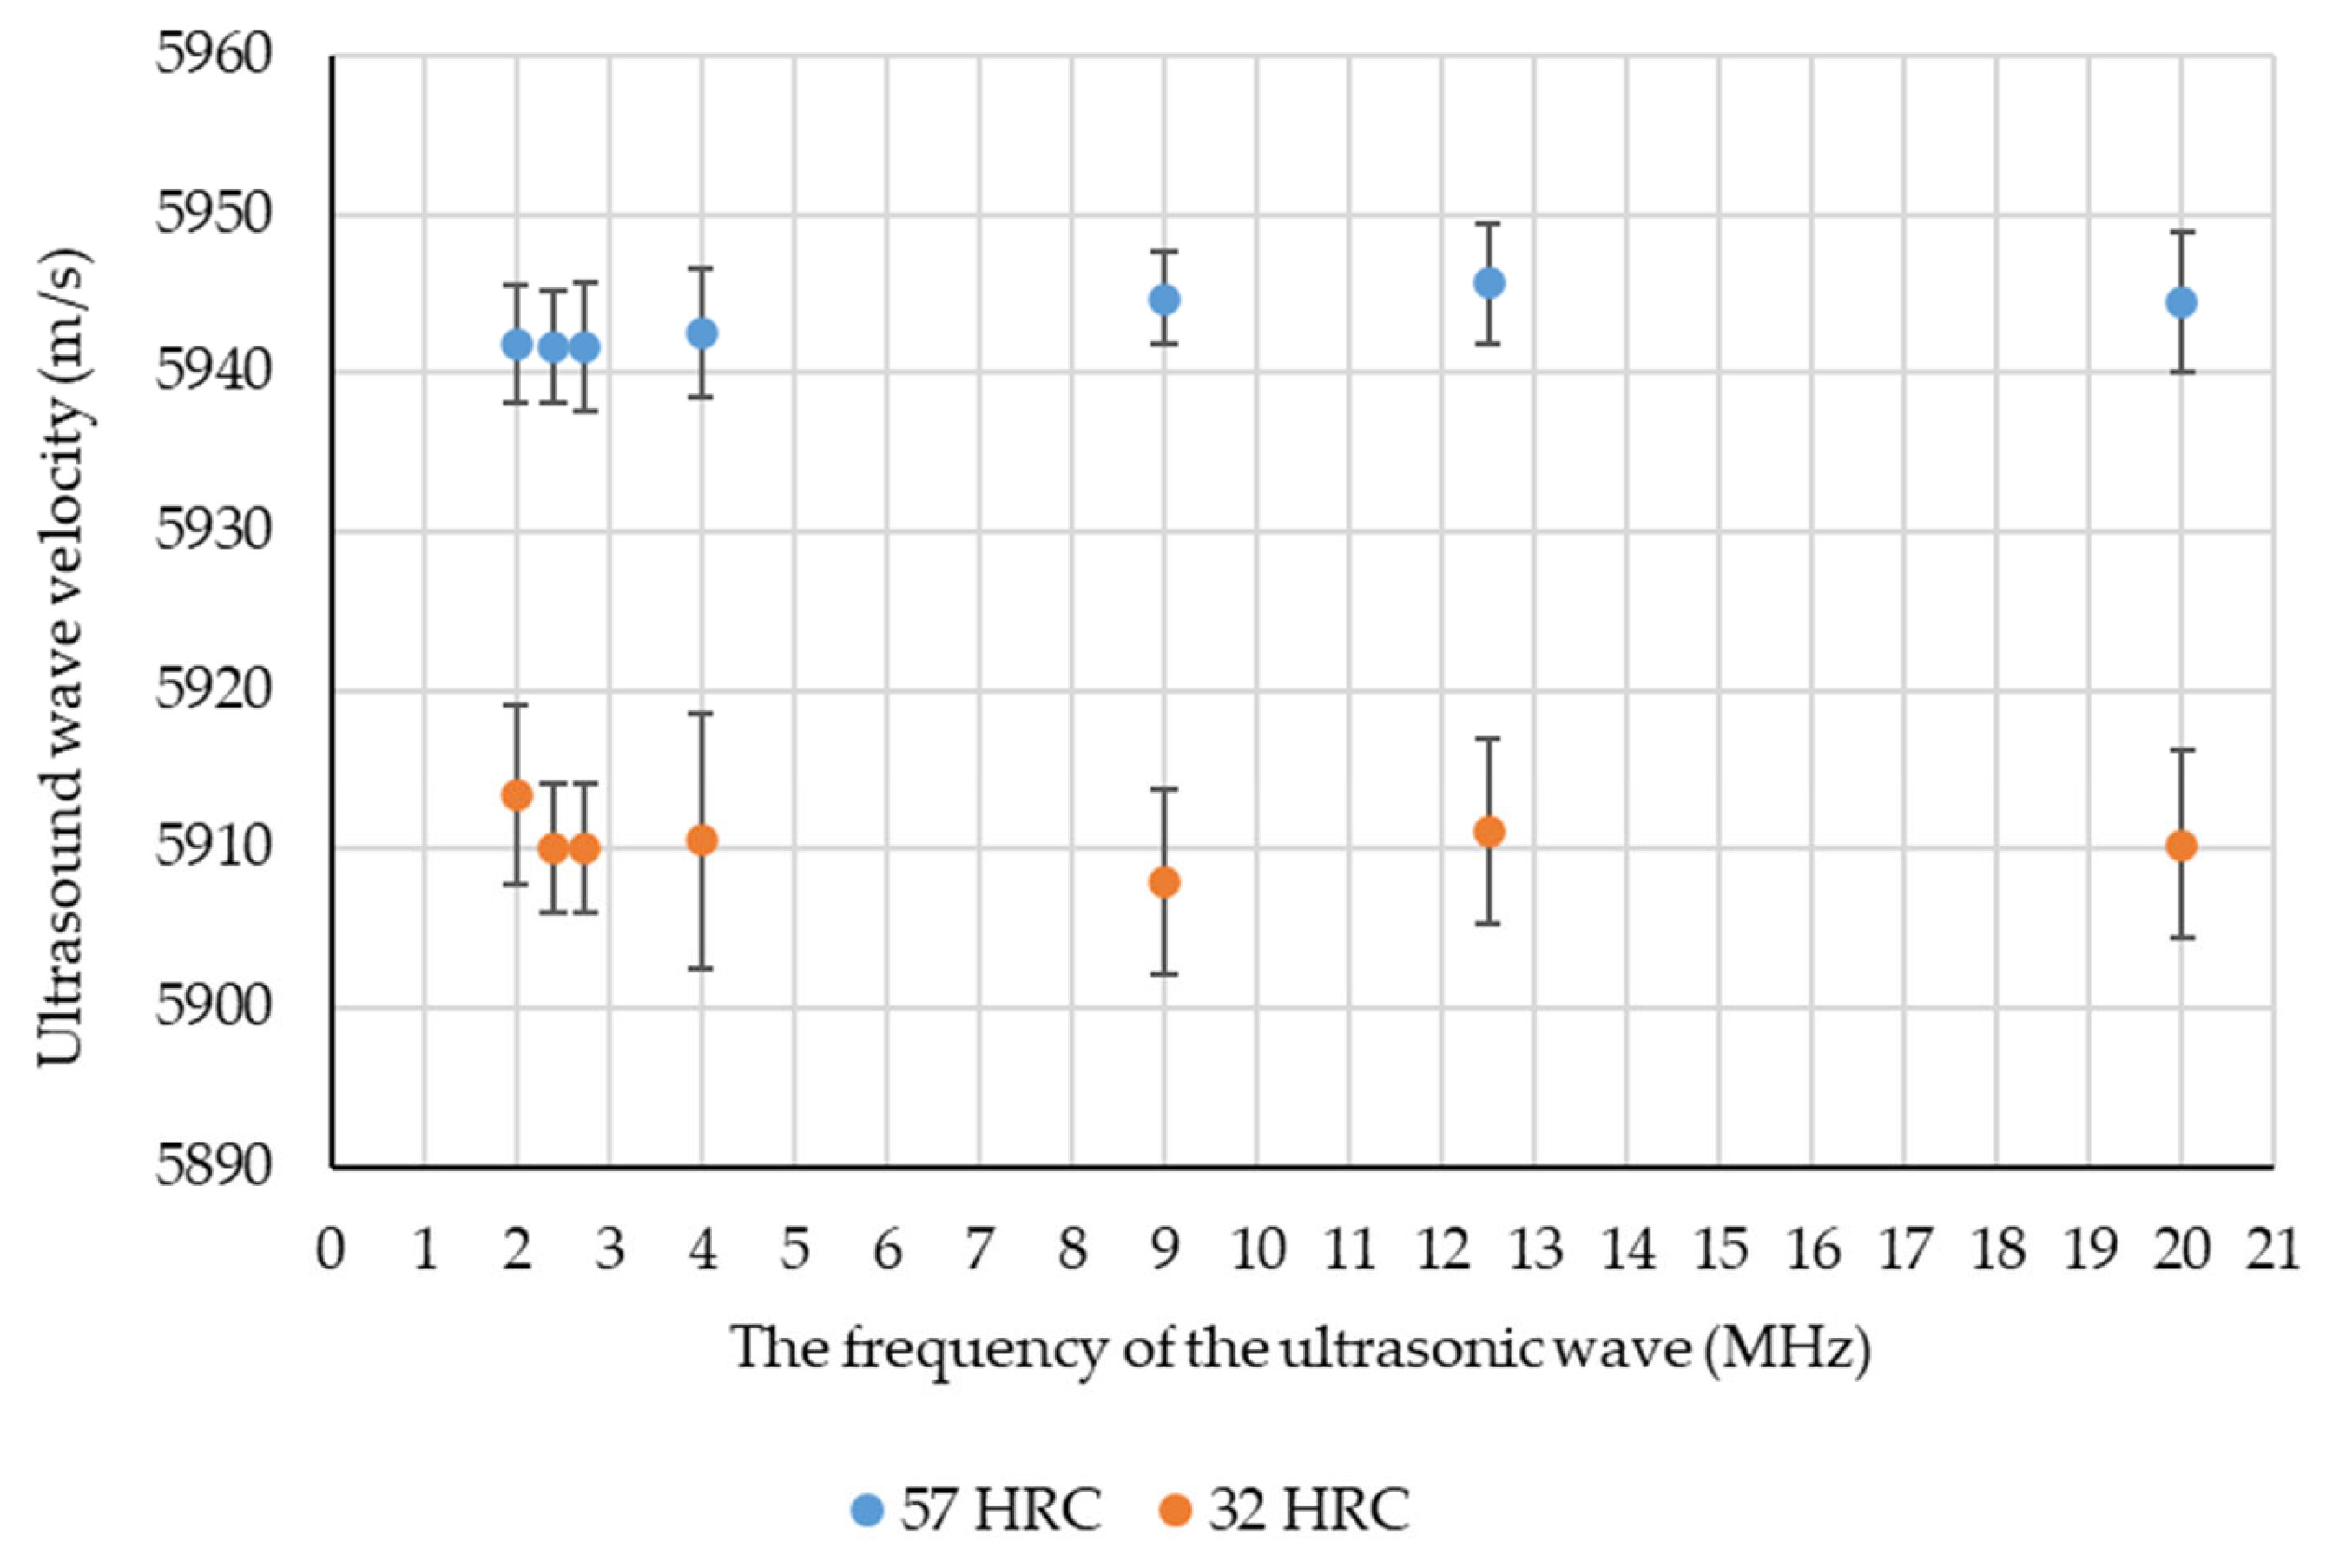
| Probe Name | MB2S | KD1-6 | KD0.8-3 | MB4S | 10 MHz | KD4-12 | GE20 |
|---|---|---|---|---|---|---|---|
| Number of Ultrasonic Transducer | 1 | 2 | 3 | 4 | 5 | 6 | 7 |
| frequency MHz | 2 | 2.4 | 2.75 | 4 | 9 | 12.5 | 20 |
| transducer diameter mm | 10 | 12 | 12 | 10 | 6 | 6 | 3 |
| effective diameter of the beam mm | 9.7 | 11.64 | 11.64 | 9.7 | 5.82 | 5.82 | 2.91 |
| mean wave velocity in tested material m/s | 5920 | 5920 | 5920 | 5920 | 5920 | 5920 | 5920 |
| wavelength mm | 3.0 | 2.5 | 2.2 | 1.5 | 0.7 | 0.5 | 0.3 |
| near field mm | 7.2 | 13.1 | 15.2 | 15.5 | 12.7 | 17.8 | 7.1 |
| decibel drop ratio K | 0.87 | 0.87 | 0.87 | 0.87 | 0.87 | 0.87 | 0.87 |
| sin beam divergence angle | 0.27 | 0.18 | 0.16 | 0.13 | 0.10 | 0.07 | 0.09 |
| divergence angle° within 25 mm | 15.40 | 10.62 | 9.26 | 7.63 | 5.64 | 4.06 | 5.08 |
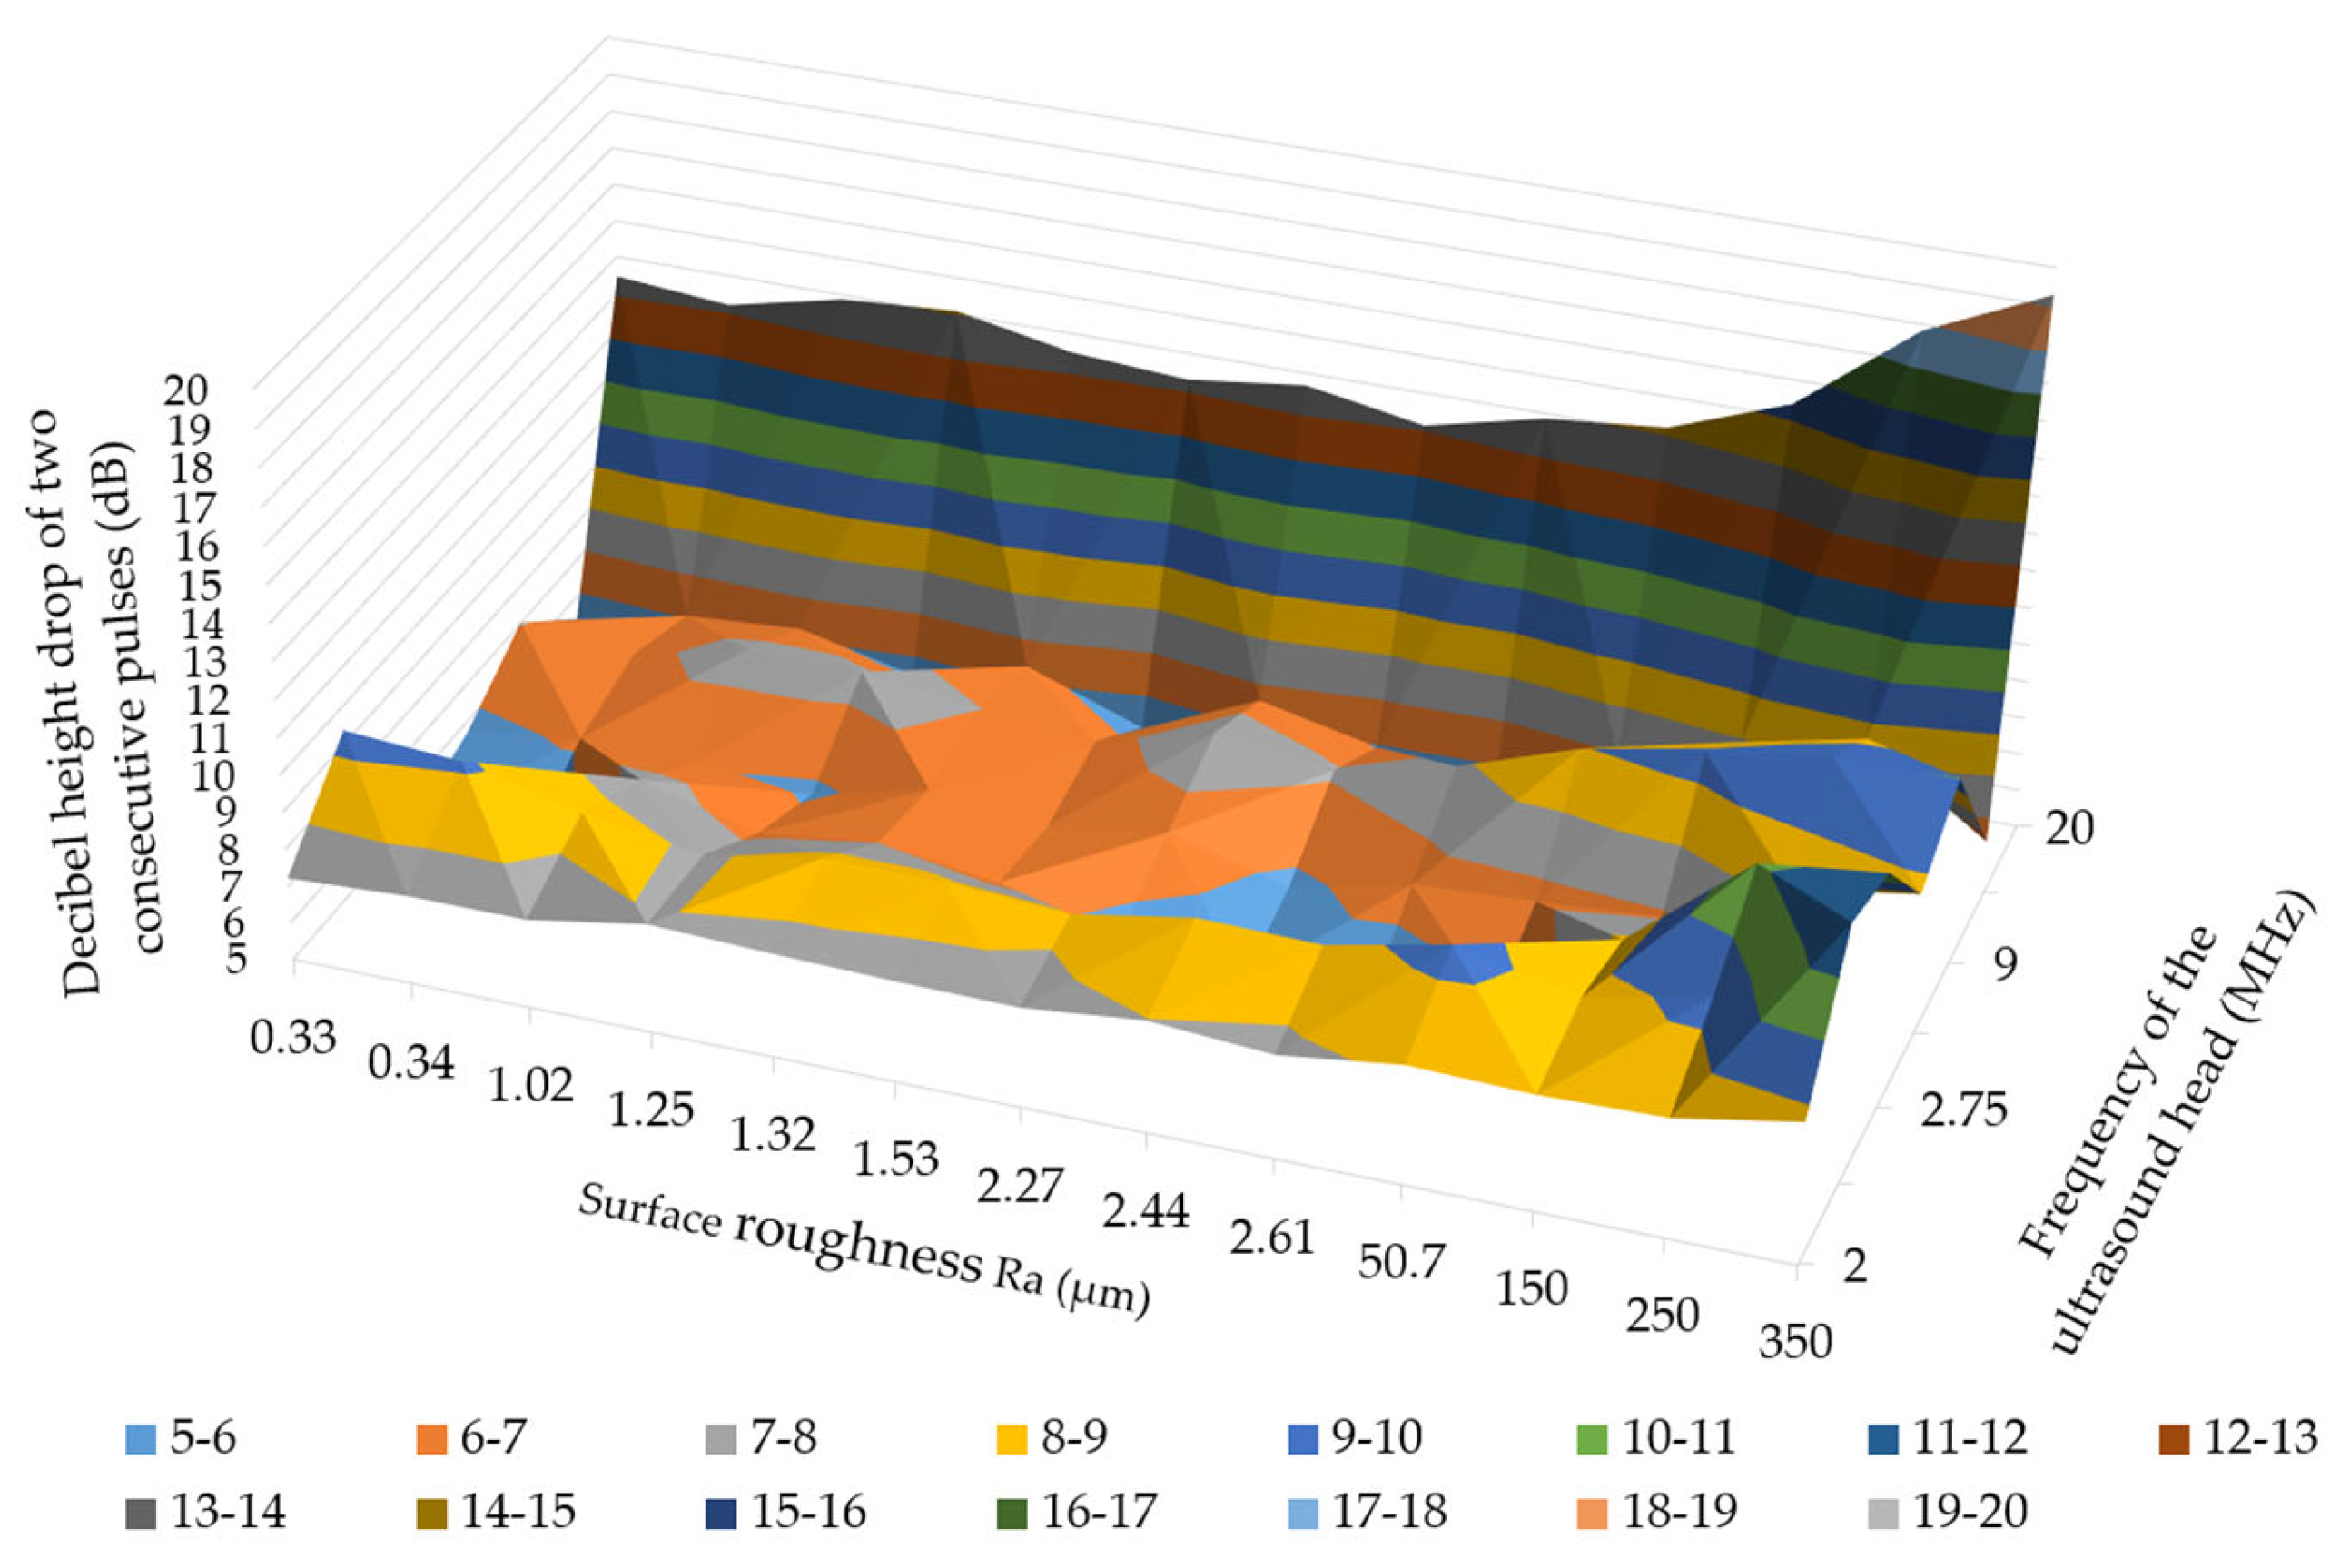
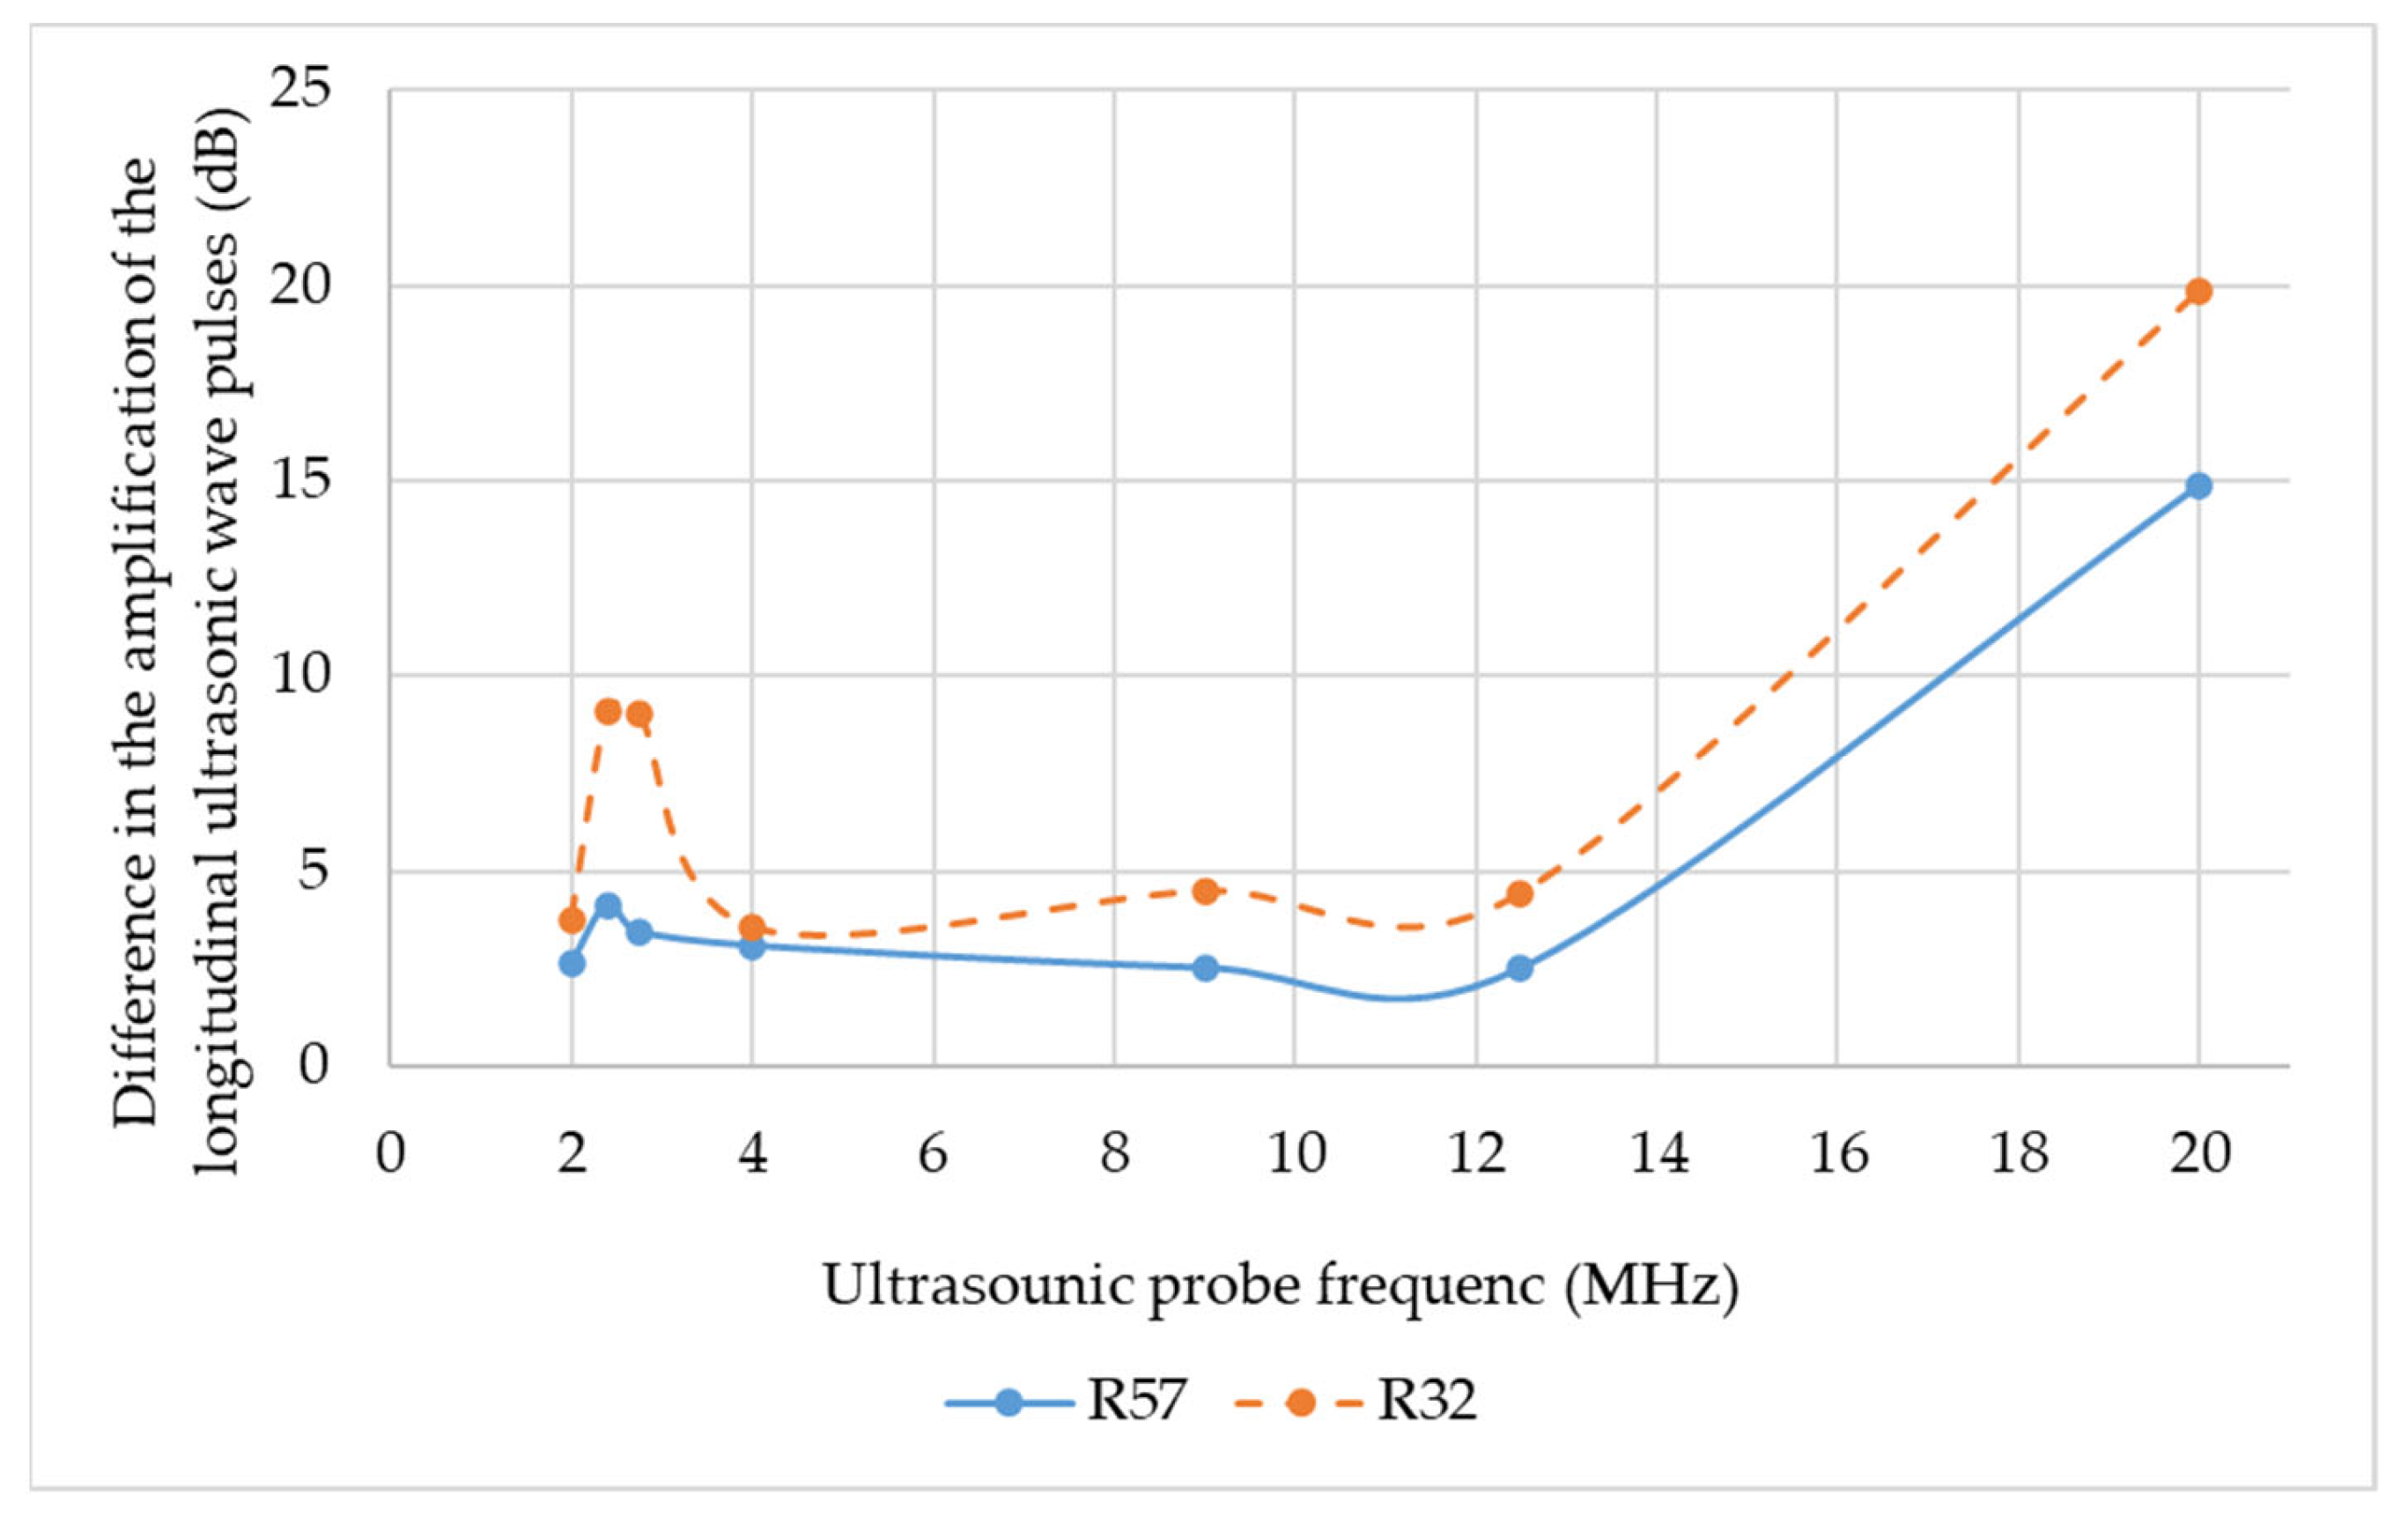
| Frequency of the Ultrasonic Probe (MHz) | |||||||
|---|---|---|---|---|---|---|---|
| Ra (µm) | 2 | 2.4 | 2.75 | 4 | 9 | 12.5 | 20 |
| 0.34 | 7.22 | 9.37 | 3.80 | 5.71 | 7.02 | 5.38 | 13.45 |
| 1.06 | 7.38 | 9.15 | 4.22 | 6.14 | 6.72 | 6.06 | 13.18 |
| 1.3 | 7.38 | 8.40 | 7.44 | 6.10 | 7.45 | 6.29 | 13.88 |
| 1.36 | 7.91 | 7.86 | 6.60 | 5.82 | 7.43 | 5.57 | 14.09 |
| 2.57 | 7.79 | 8.42 | 6.97 | 6.57 | 7.01 | 6.41 | 13.48 |
| 0.33 | 7.70 | 8.41 | 6.51 | 6.19 | 6.71 | 5.26 | 13.28 |
| 1.59 | 7.66 | 8.21 | 5.69 | 6.63 | 7.55 | 6.65 | 13.67 |
| 2.27 | 7.98 | 8.76 | 5.13 | 5.78 | 7.13 | 5.94 | 13.12 |
| 2.59 | 7.75 | 8.68 | 4.84 | 6.48 | 7.85 | 5.73 | 13.86 |
| 50.62 | 8.16 | 9.35 | 5.82 | 6.66 | 8.95 | 6.90 | 14.17 |
| 149.15 | 8.07 | 8.62 | 8.20 | 6.89 | 9.49 | 7.94 | 15.35 |
| 250.73 | 8.15 | 9.32 | 10.86 | 8.28 | 9.97 | 8.64 | 17.84 |
| 348.69 | 8.73 | 11.87 | 11.24 | 8.79 | 10.01 | 6.43 | 19.30 |
Disclaimer/Publisher’s Note: The statements, opinions and data contained in all publications are solely those of the individual author(s) and contributor(s) and not of MDPI and/or the editor(s). MDPI and/or the editor(s) disclaim responsibility for any injury to people or property resulting from any ideas, methods, instructions or products referred to in the content. |
© 2023 by the authors. Licensee MDPI, Basel, Switzerland. This article is an open access article distributed under the terms and conditions of the Creative Commons Attribution (CC BY) license (https://creativecommons.org/licenses/by/4.0/).
Share and Cite
Kowalczyk, J.; Jósko, M.; Wieczorek, D.; Sędłak, K.; Nowak, M. The Influence of the Hardness of the Tested Material and the Surface Preparation Method on the Results of Ultrasonic Testing. Appl. Sci. 2023, 13, 9904. https://doi.org/10.3390/app13179904
Kowalczyk J, Jósko M, Wieczorek D, Sędłak K, Nowak M. The Influence of the Hardness of the Tested Material and the Surface Preparation Method on the Results of Ultrasonic Testing. Applied Sciences. 2023; 13(17):9904. https://doi.org/10.3390/app13179904
Chicago/Turabian StyleKowalczyk, Jakub, Marian Jósko, Daniel Wieczorek, Kamil Sędłak, and Michał Nowak. 2023. "The Influence of the Hardness of the Tested Material and the Surface Preparation Method on the Results of Ultrasonic Testing" Applied Sciences 13, no. 17: 9904. https://doi.org/10.3390/app13179904