
Analysis of Feed Inlet and Optimal Feeding Amount of Waste Ground Film Impurity Removal Equipment
by
1,2,†, 1,3,† , 1,2, 4,*, 1,2 and 1
Jianming Kang
Chenshuo Xie
, Qiangji Peng
Nannan Wang
Xiaoyu Wang
Yaoli Zhang
1
Shandong Academy of Agricultural Machinery Sciences, Ji’nan 250100, China
2
Huang Huai Hai Key Laboratory of Modern Agricultural Equipment, Ministry of Agriculture and Rural Affairs, Ji’nan 250100, China
3
College of Engineering, Nanjing Agricultural University, Nanjing 211800, China
4
School of Mechanical and Electronic Engineering, Shandong Jianzhu University, Ji’nan 250100, China
*
Author to whom correspondence should be addressed.
†
These authors contribute equally to this paper and should be considered as co-first author.
Appl. Sci. 2023, 13(17), 9905; https://doi.org/10.3390/app13179905 (registering DOI)
Received: 16 July 2023
/
Revised: 26 August 2023
/
Accepted: 28 August 2023
/
Published: 1 September 2023
(This article belongs to the Special Issue Advances in Waste Treatment and Resource Utilization)
Abstract
:A tumbler screen-type residual film–impurity mixture wind separator is the key equipment for the secondary utilization of farmland residual film. During its operation, the proportion of impurities in the separated waste mulch film intermittently increases, resulting in poor working stability of the device, which may hamper long-term operation. To address the above issues, the material inside the separation unit was continuously monitored, and the main factor affecting separator performance was determined to be the challenges in the effective depolymerization of some residual film-impurity mixtures. The principles of agglomeration and depolymerization of the residual film-impurity mixtures were analyzed using computational fluid dynamics (CFD) and discrete element method (DEM) flow-solid coupling simulation methods. The key factor affecting the disaggregation of the mixture was the collision force between the residual film–impurity mixture and the trommel screen. The collision force was maximum when the residual film–impurity mixture first collided with the trommel screen when it was fed into the separation device. Furthermore, simulations were carried out for different inlet structure forms; the evaluation index was the maximum collision force of the residual film–impurity mixture agglomerate on the trommel screen. The best disaggregation effect was obtained with a square feed inlet and at a feeding rate of 202 kg/h. A prototype was built using these specifications for verification. The average value of the ratio of impurities in the residual film was 6.966%, the coefficient of variation was 7.38%, and the dispersion of statistical results was small. The ratio of impurities in the residual film was kept constant during the continuous operation of the wind separator. Thus, in this study, we analyzed the agglomerate disaggregation process and provided theoretical insights for determining the optimal structures of the inlets of various cleaning devices and the feeding volumes.
1. Introduction
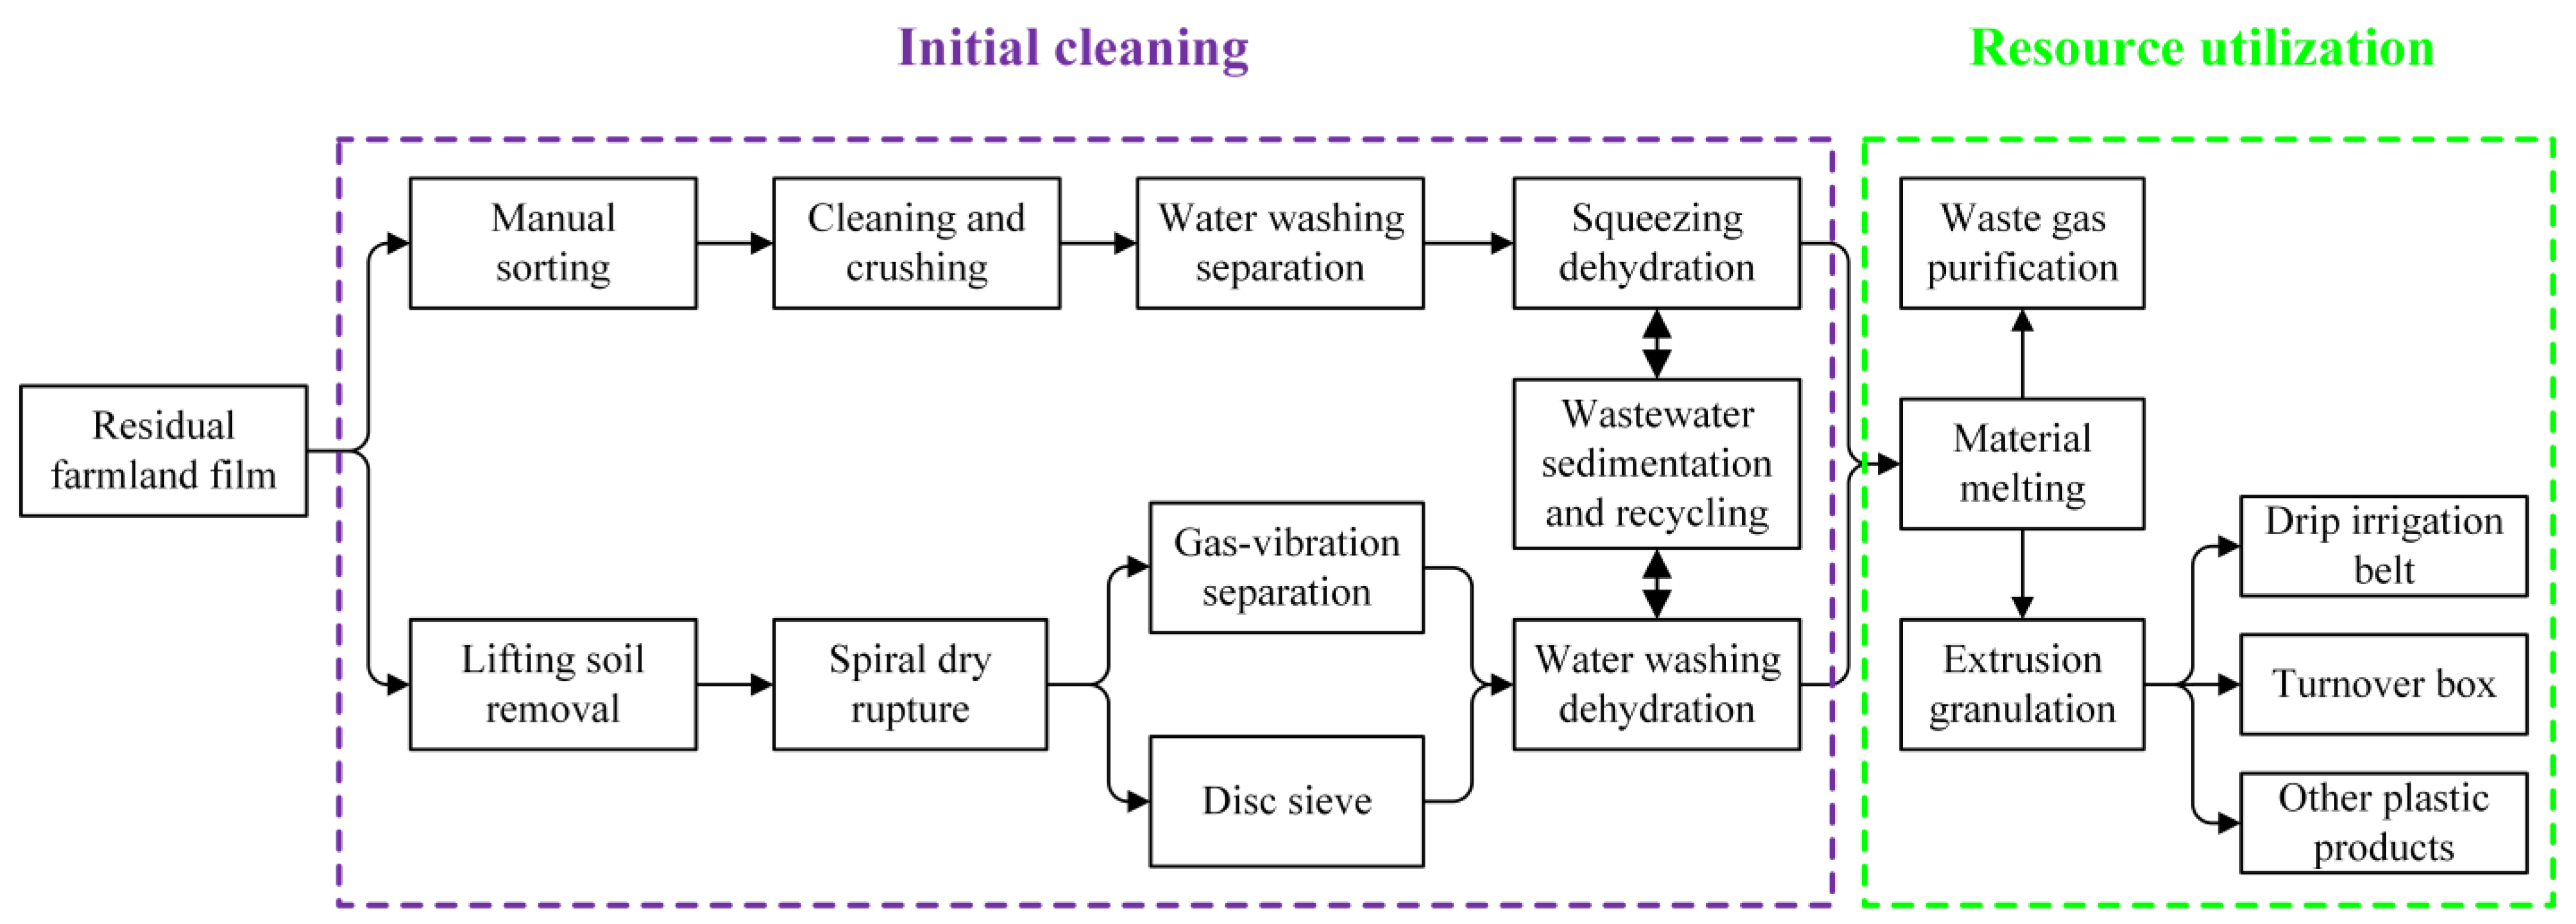
Mulch cultivation technology is crucial for the development of dryland agriculture, where water resources are limited. It plays a critical supporting role in ensuring national food security [1]. Millions of tons of plastic mulch are used globally every year, with China alone requiring more than 1.15 million tons per year [2]. The mulch is not recycled in time and is difficult to degrade naturally, which leads to serious white pollution in farmland soil. Japan, Europe, and the United States use mulch products that are generally between 0.15 and 0.02 mm thick and have good toughness, allowing for complete recycling after crop harvest. Other Asian countries, such as China, generally use ultra-thin mulch with a thickness of <0.008 mm, which makes it difficult to recycle after crop harvest because of broken mulch. Moreover, the residual film is a polyethylene material, which is a valuable renewable resource that can be used to process plastic pellets, forming a virtuous cycle of “use-recycle-process-reuse” of the film, as shown in Figure 1.
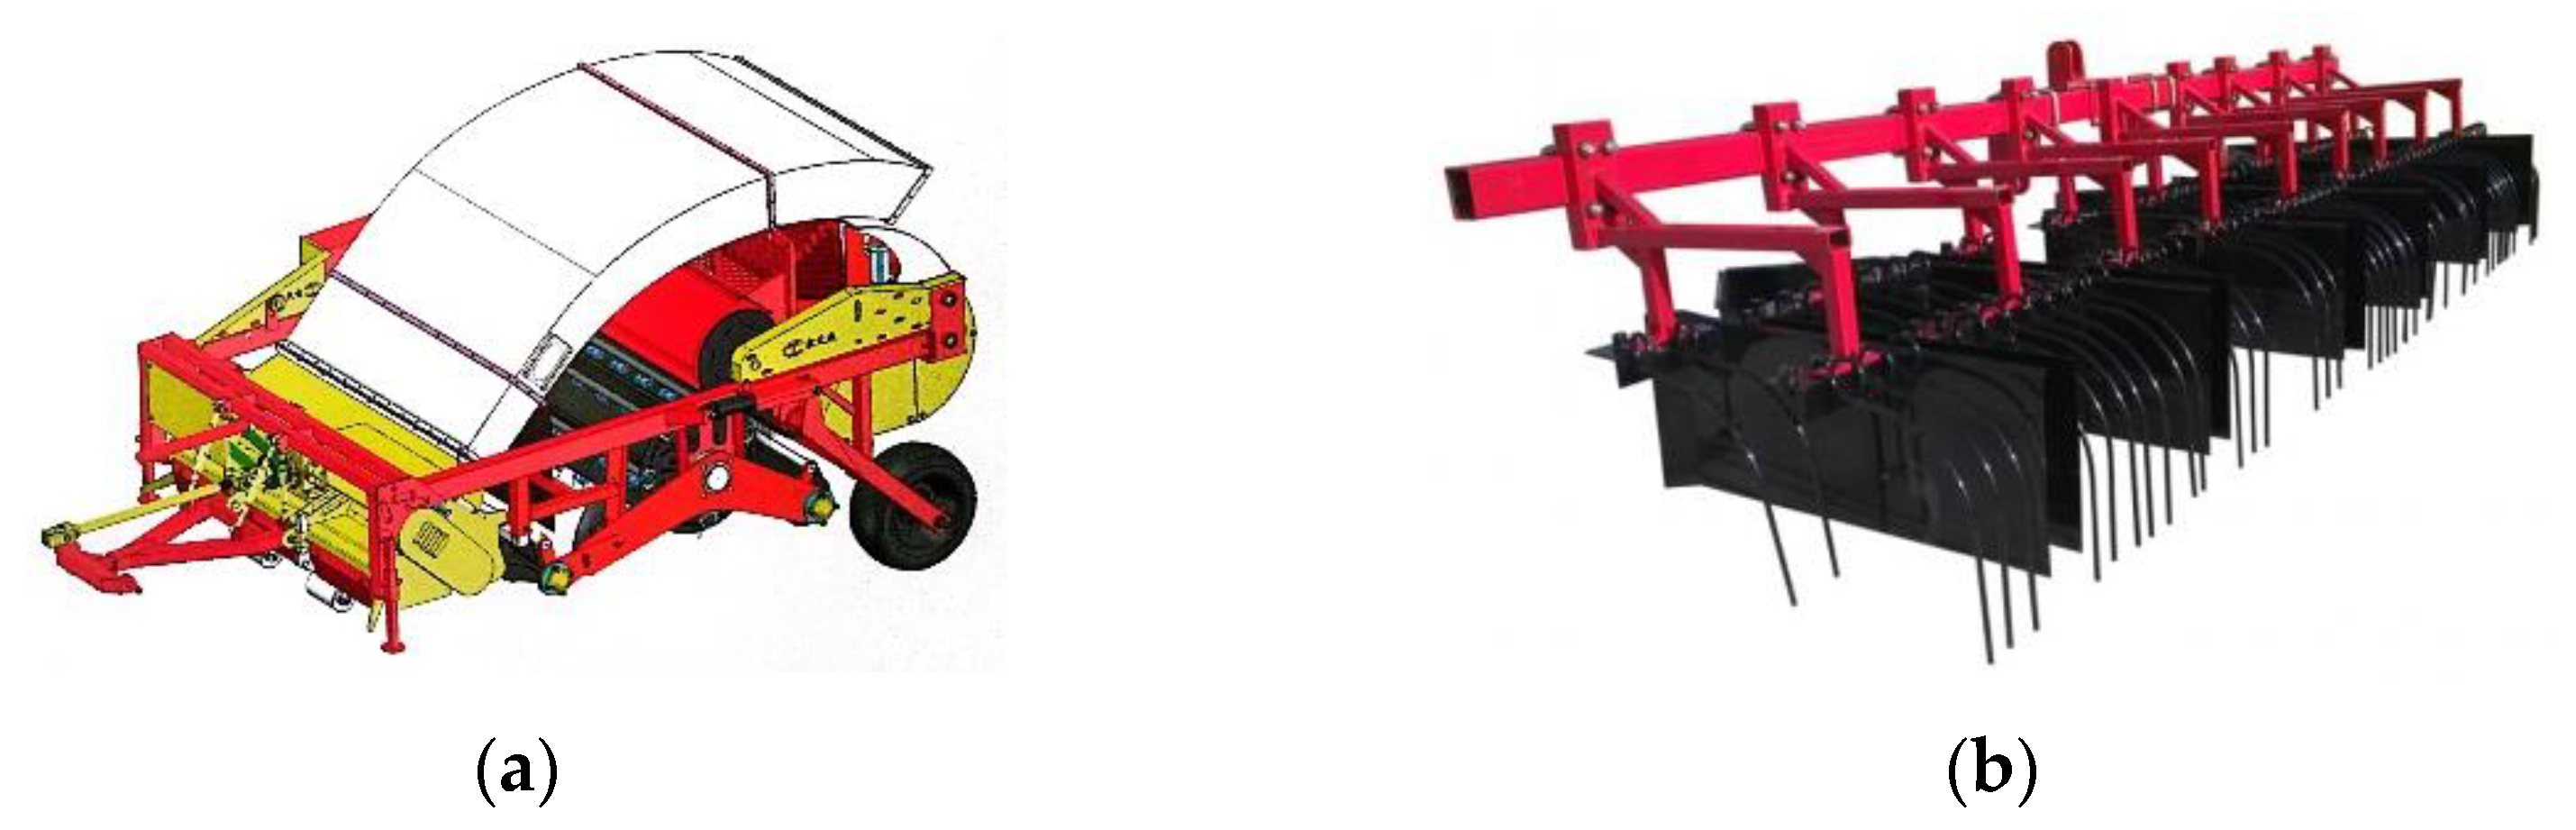
Contemporary methods of mechanized recycling of residual film have shown good results, and different types of film recovery machinery have emerged, as shown in Figure 2. Shi et al. [3] propose a roll-type residual film recovery mechanism using the tillage layer method. The structure and operation principles of this system are discussed, and a detailed analysis of its key components and working process is provided. Su et al. [4] aim to address the problem of the arc-shaped nail tooth, a key component in pre-sowing film recovery machines, being prone to wear and fracture deformation. However, mechanically recovered film residues contain a large number of impurities, making it difficult to reuse the recovered film residues. They can only be randomly stacked, buried, or burned, causing secondary environmental pollution, which does not fundamentally help solve the problem of residual film pollution. Moreover, the residual film-impurity mixture has to be cleaned before further use. A tumbler screen-type film wind separator (also referred to as the film wind separator) has been widely used in the residual film resource utilization of debris removal mechanisms [5,6]. In one study, the researchers found that in the same time interval, the ratio of impurities in the residual film increased suddenly, which led to higher impurity content in the residual film even after cleaning. This seriously affected the subsequent residual film melting and granulation processes.
Scholars from various fields have extensively investigated the depolymerization processes of different materials. Jiao et al. [7] used the discrete element method (DEM) to numerically simulate the depolymerization of wet granular agglomerates of coated structures by collision with the wall of the device and investigate the mode of wet particle agglomerate depolymerization during collision. Antonov et al. [8] studied thermal aggregation and disaggregation processes in complex carrageenan/lysozyme systems with a different linear charge density of the sulfated polysaccharide. Based on agglomerate size, Zhou [9] conducted force analysis for a single particle disaggregating from the agglomerate and calculated the corresponding wind speed. The agglomerates transported at this wind speed were depolymerized into smaller agglomerates and single particles via mutual collisions. Zhai et al. [10] used a bonding model and the DEM to simulate the bonding behavior of liquid bridges in wet particle agglomerates. They developed a model of wet coal agglomerates formed by the bonding of small particles with equal diameters. They investigated the laws of bonding and breaking of the internal parts of the agglomerates during collision as well as the effect of collision velocity and other factors on the degree of agglomerate disaggregation. Zhang et al. [11] explored the various force relationships between particles as well as between particles and airflow at the microscopic scale. Bellocq et al. [12] studied morphological changes in sieved material during wet agglomeration and determined the elemental conditions that must be achieved in the relevant operating steps. The agglomeration of residual film–impurity mixtures is a more complex multi-material bonding process than the agglomeration of microscopic particles. During disaggregation, the soil and straw detach from the residual film, ensuring that the residual film remains clean. Therefore, for analyzing the depolymerization of miscellaneous residual film–impurity mixtures, the study of traditional microscopic particle depolymerization is not suitable.
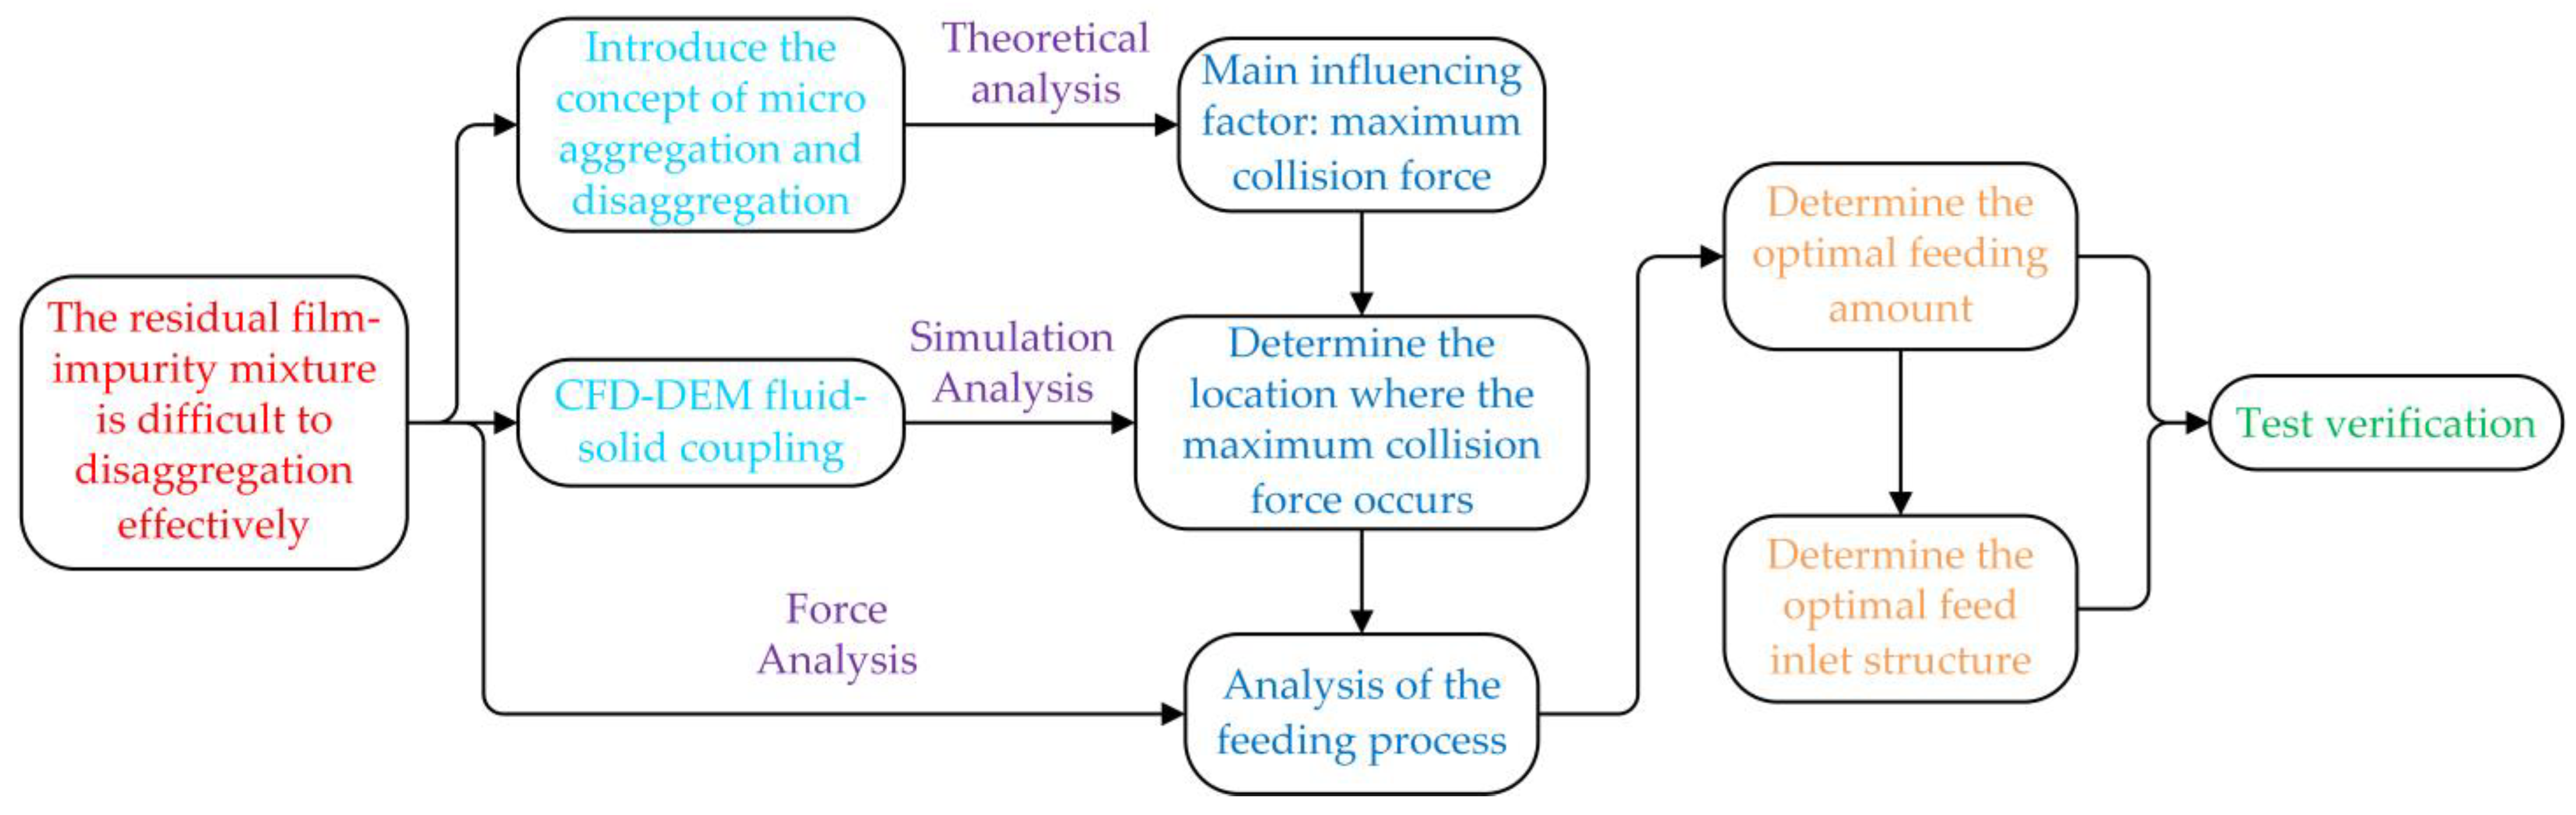
During separation in a residual film–impurity mixture wind separator, a large amount of residual film–impurity mixture is not depolymerized during continuous operation. Herein, we conducted simulations and presented insights for addressing this problem. Based on the principle of agglomeration and depolymerization of the residual film–impurity mixture, the key factors affecting the depolymerization were analyzed. Using CFD-DEM fluid-solid coupling simulation, the location of the maximum collision force was determined, and force analysis was conducted for this stage. The maximum collision force was influenced by the feeding volume and inlet structure. Simulations were performed for different types of inlet structures. The maximum collision force of the residual film–impurity mixture agglomerates on the trommel screen was used as the evaluation index, and the optimum inlet structure and feed rate were determined. Figure 3 shows the flow chart of the complete research process for some mixtures that are difficult to disaggregate. The findings of this study provide theoretical insights for determining the optimal inlet structure and feed rates of various cleaning devices.
2. Materials and Methods
2.1. Overall Structure and Working Principle of the Film Miscellaneous Wind Separator
2.1.1. Overall Structure
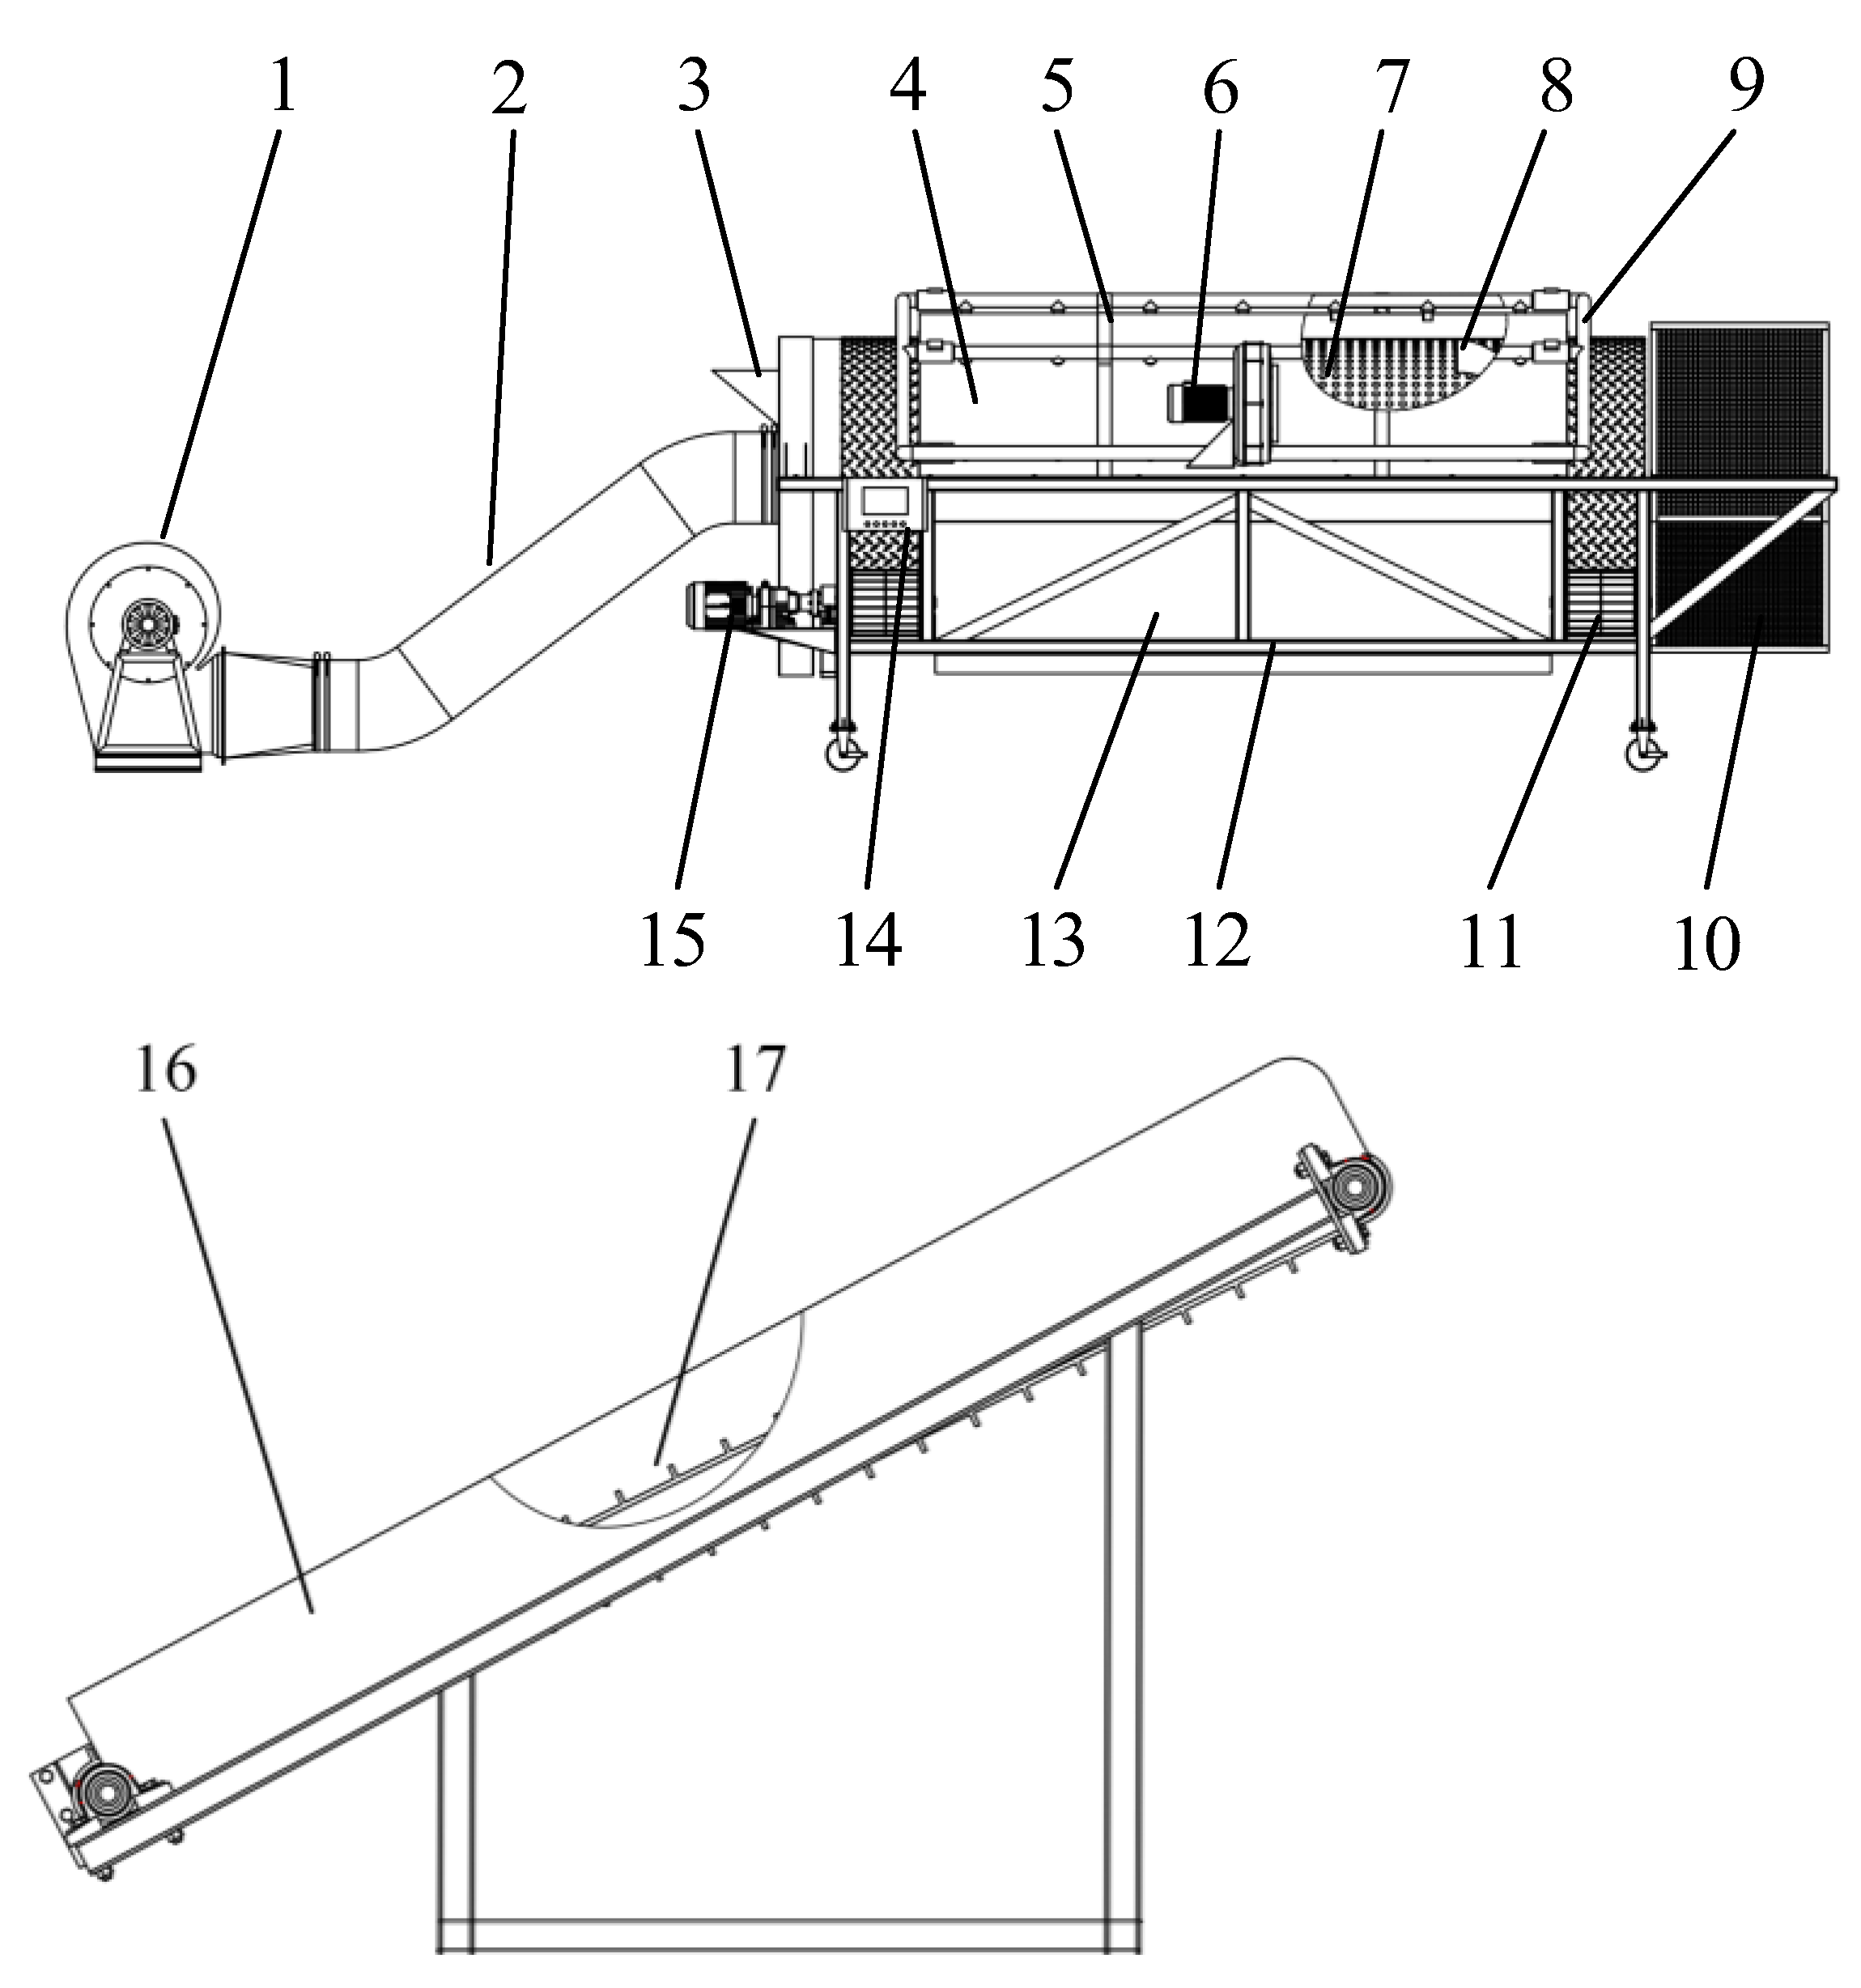
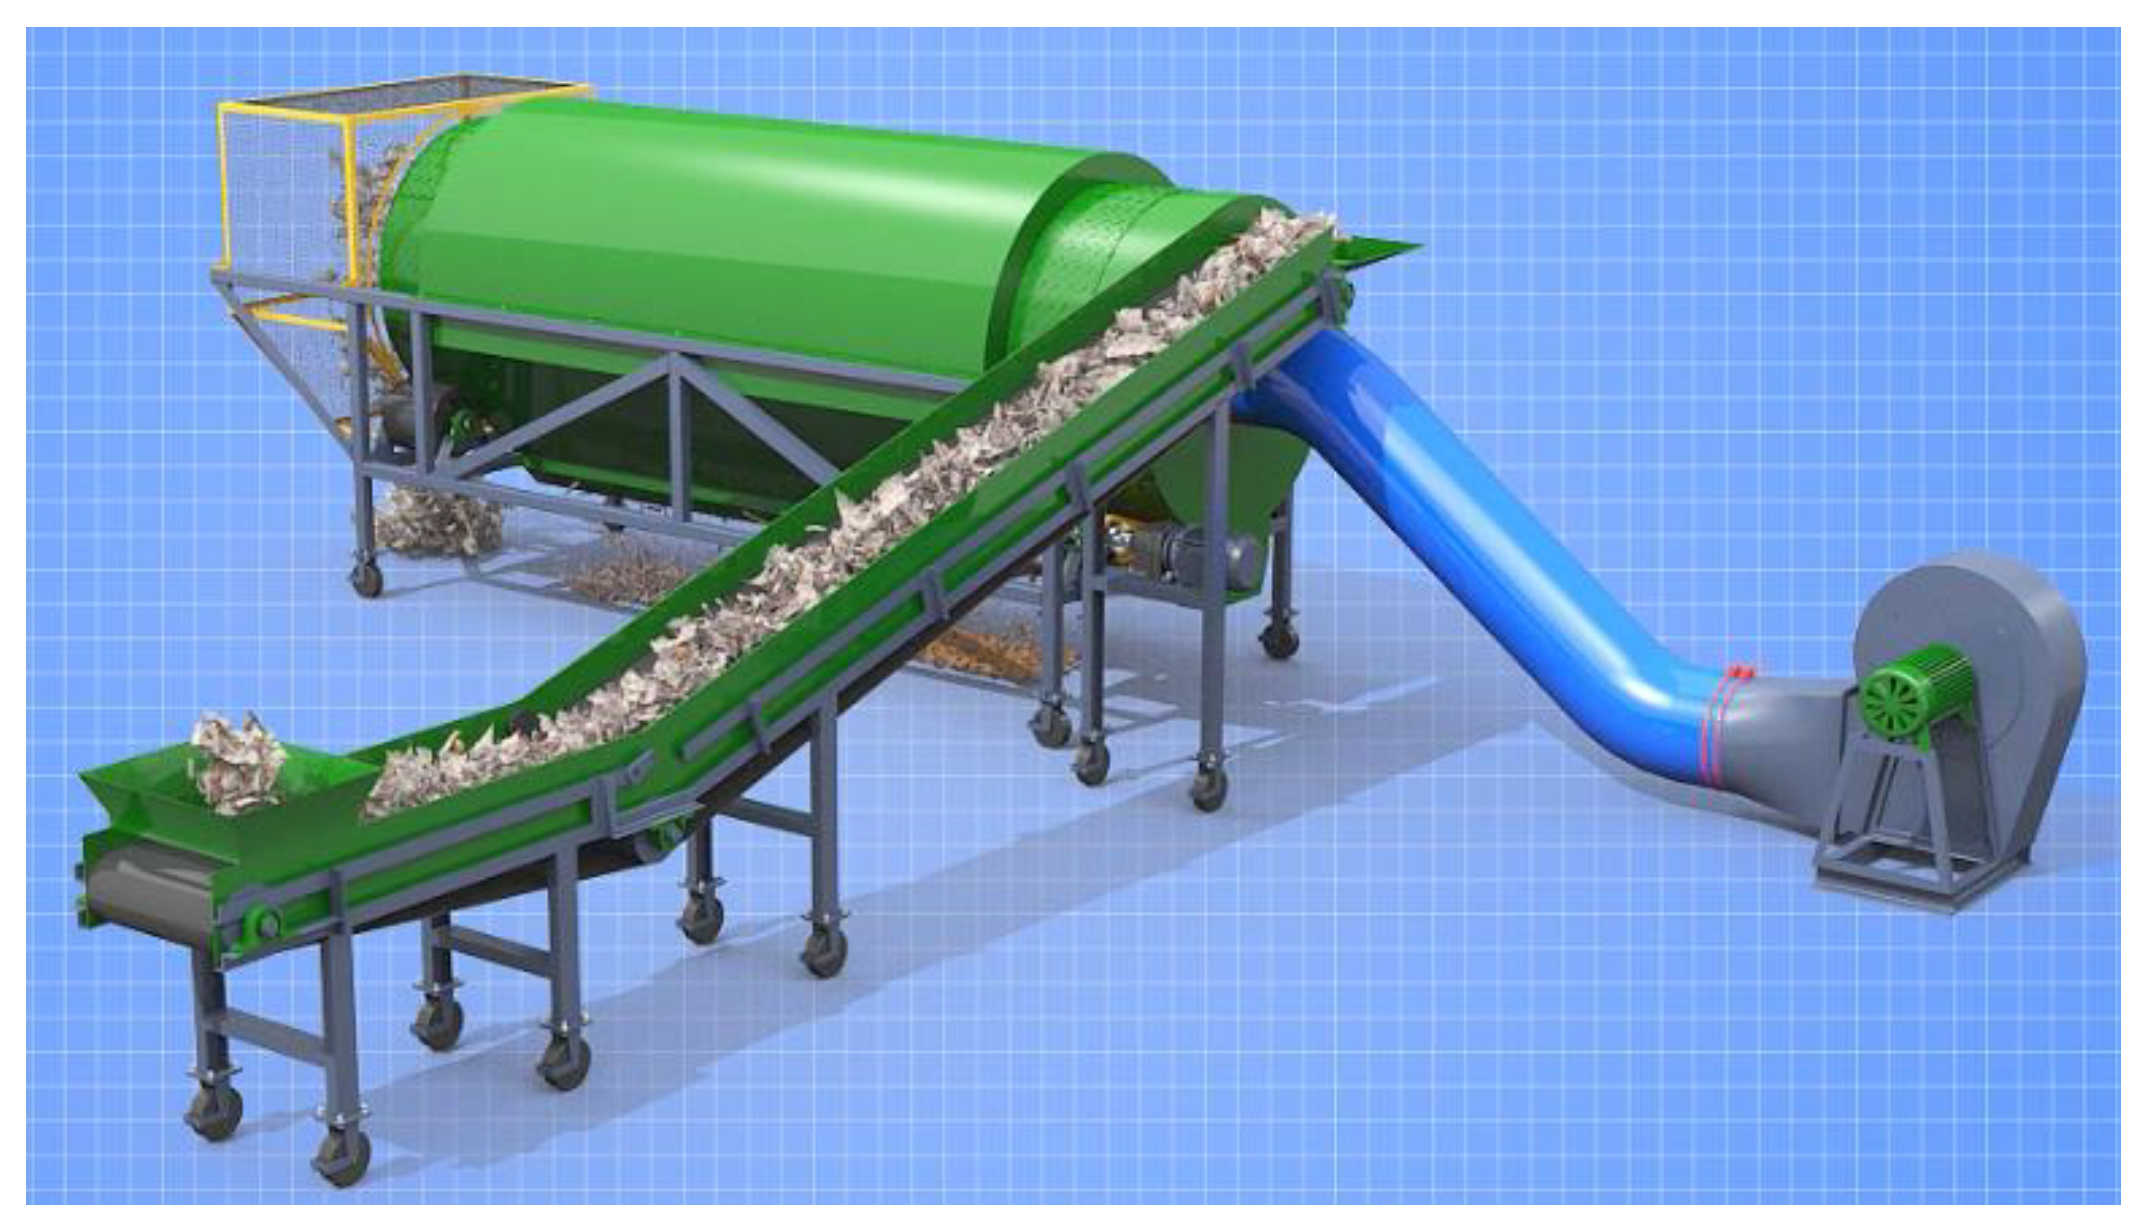
The whole structure of the tumbler sieve-type film miscellaneous wind separator considered in this study is presented in Figure 4. The tumbler sieve-type film miscellaneous wind separator mainly comprised a fan, air duct, tumbler sieve, sealing cover, and film collection box. The inlets for material feed and air were located at the same end of the drum sieve. The fan was connected to the air inlet via an air duct. A spacer conveyor belt with a transverse spacer was used to prevent the material from slipping. Both ends of the conveyor belt were connected to the material inlet installed on the side of the separator. A motor was installed at the lower end of the conveyor belt to control its speed [13].
2.1.2. Working Principle
During the continuous operation of the film miscellaneous wind separator, a high-speed airflow from the centrifugal fan entered the drum screen through the air duct. A certain amount of film was transported upward by the conveying device and fed into the wind separator via the inlet. The amount of residual film–impurity mixture fed was controlled by adjusting the speed of the conveyor belt. When the residual film–impurity mixture entered the device, it moved toward the back end of the device under the action of airflow and collided with the trommel screen. Under the joint action of airflow and a trommel screen, the residual film–impurity mixture was gradually depolymerized and separated. The heavier straw and soil fell from the lower end of the drum and were separated for further processing in the device. The lighter residual film moved further under the action of airflow, entered the film collection box through the drum sieve, and was cleaned and processed. The operating principle of the wind separator is presented in Figure 5.
2.2. CFD-DEM Fluid-Solid Coupling Simulation Analysis
2.2.1. Principle of Agglomeration and Depolymerization of Membrane Hybrids
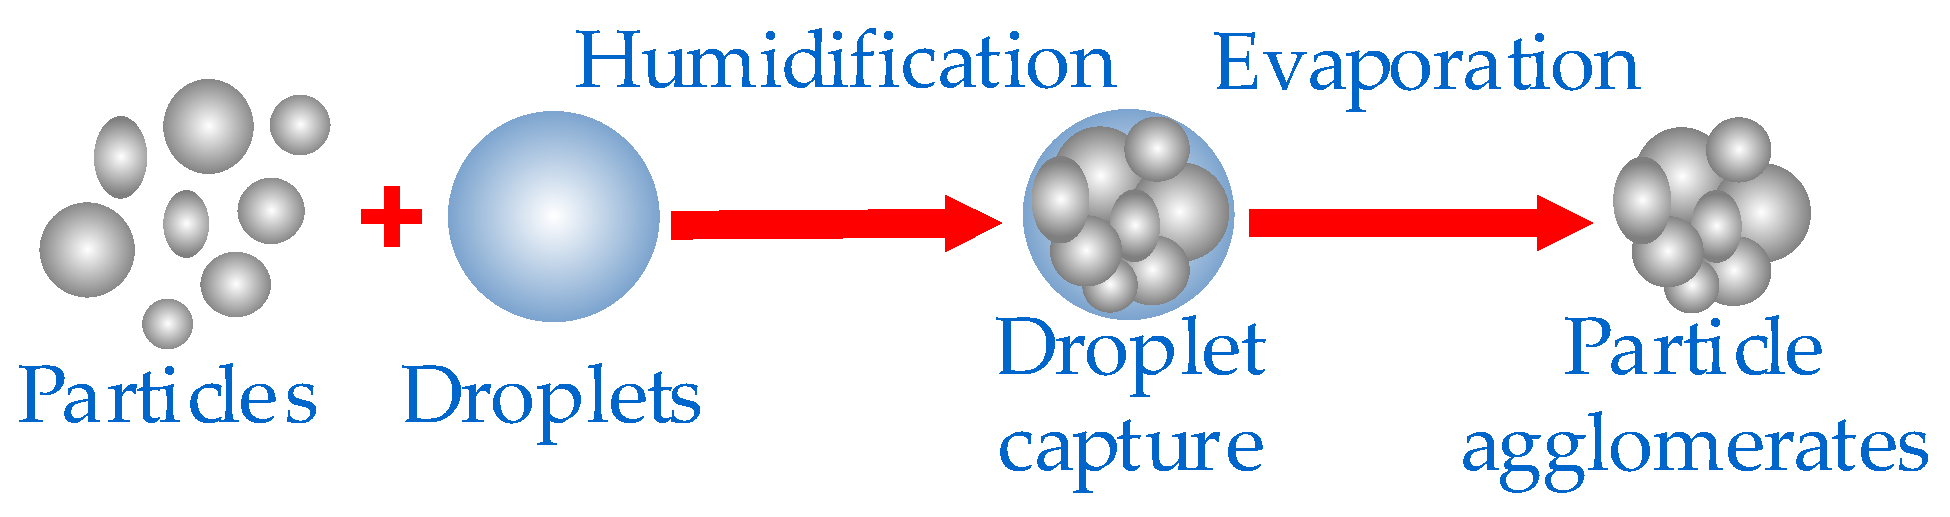
As shown in Figure 6, the residual film was not recovered earlier during the operation. It was entangled and mixed with straw in the soil. The soil particles and liquid droplets combined to form a strong, wet clod and adhered to each other via the straw and the film. When the water in the soil evaporated, the soil, straw, and film agglomerated into a whole. The recovered residual film was mixed with a large amount of this film-soil-cotton stalk mixture agglomerate [14].
As the device was rotated, the residual film–impurity mixture collided with the wall of the drum screen, and the agglomerates were depolymerized, thus achieving the effect of separating the residual film and impurities. When the maximum collision force, Fcmax, was greater than the maximum viscous force, Fvn, the agglomerates were broken. The relationship between them was given using Equation (1):
Soil, straw, and residual film agglomerates collided with the wall of the trommel screen inside the device. The maximum collision force in the collision was expressed using Equation (2):
where d1 and d2 are particle sizes (m); when d2 was much larger than d1, it was considered to be a collision between the agglomerate and wall; k is the elastic deformation coefficient of the particle (Pa); ρp is the density of the agglomerate (kg/m3); v is the relative collision velocity of the agglomerate and wall of the drum sieve (m/s); ν is Poisson’s ratio; and E is Young’s modulus of elasticity (Pa).
When the agglomerate collided with the wall, the constituent particles tended to move relative to each other and were subjected to both tangential and normal viscous forces. The distance between the agglomerate and the wall was rather small; thus, the tangential viscous force was much smaller than the normal viscous force. Therefore, the tangential viscous force was excluded when considering the force of the collision process [15]. The normal viscous force was given using Equation (3):
where μ is the dynamic viscosity (N·s/m2); vn is the normal relative motion velocity of the agglomerate and the wall (m/s); h is the distance from the surface of the agglomerate to the surface of the trommel screen (m); and R* is the folding radius, where ; R1 and R2 are the equivalent radii of the agglomerate and the wall of the trommel screen, respectively, and R2 can be increased to infinity.
Equations (2) and (3) were used to obtain the collision force between the agglomerates; the surface of the drum screen increased with an increase in the relative collision velocity. Therefore, among the film-hybrid wind separators, enhancing the relative collision velocity between the residual film–impurity mixture and the trommel screen facilitated disaggregation.
2.2.2. Fluid-Solid Coupling Simulation
Further, we investigated the maximum collision force inside the trommel screen, that is, determined where the maximum relative collision velocity occurred. The operation of the membrane miscellaneous wind separator was simulated using a combination of EDEM 2020 and Fluent 18.2 software.
Pre-Processing of Fluid-Solid Coupling Simulation
SolidWorks 2018 3D modeling software was used to model the structure of the membrane miscellaneous wind separator. Flow field simulation as well as the discrete element simulation model were also used to establish the model. The simplified flow field simulation model was imported into ICEM 18.2 software for mesh drawing. The rotating trommel screen of the film miscible wind separator was located inside the stationary sealing hood; thus, the two fluid domains were plotted separately when the mesh was drawn. The screen holes on the trommel screen were named interface surfaces. Data exchange between the two fluid domains was realized, and the delineated mesh model was imported into Fluent 18.2 software. The standard k-ε model was selected for computations, and the SIMPLEC algorithm was used for solving equations. The internal flow field of the film-hybrid wind separator was simulated, and the simulation results were exported to a .cgns format file.
The results of the DEM model and the flow field simulation, data identified using an API function, were imported into the EDEM 2020 software. The operating parameters of each structure of the film miscellaneous wind separator were set separately to ensure that the coupled simulation results were consistent with the test results, and that the bench test material was followed. A three-dimensional model of residual film, straw, and soil particles was established. Parameters for material contact and physical characteristics were obtained using the drainage method via tensile tests with a mass spectrometer, a mechanical testing machine, friction and wear tests, and a literature review [16,17,18,19,20,21]. The intrinsic parameters of the materials are shown in Table 1.
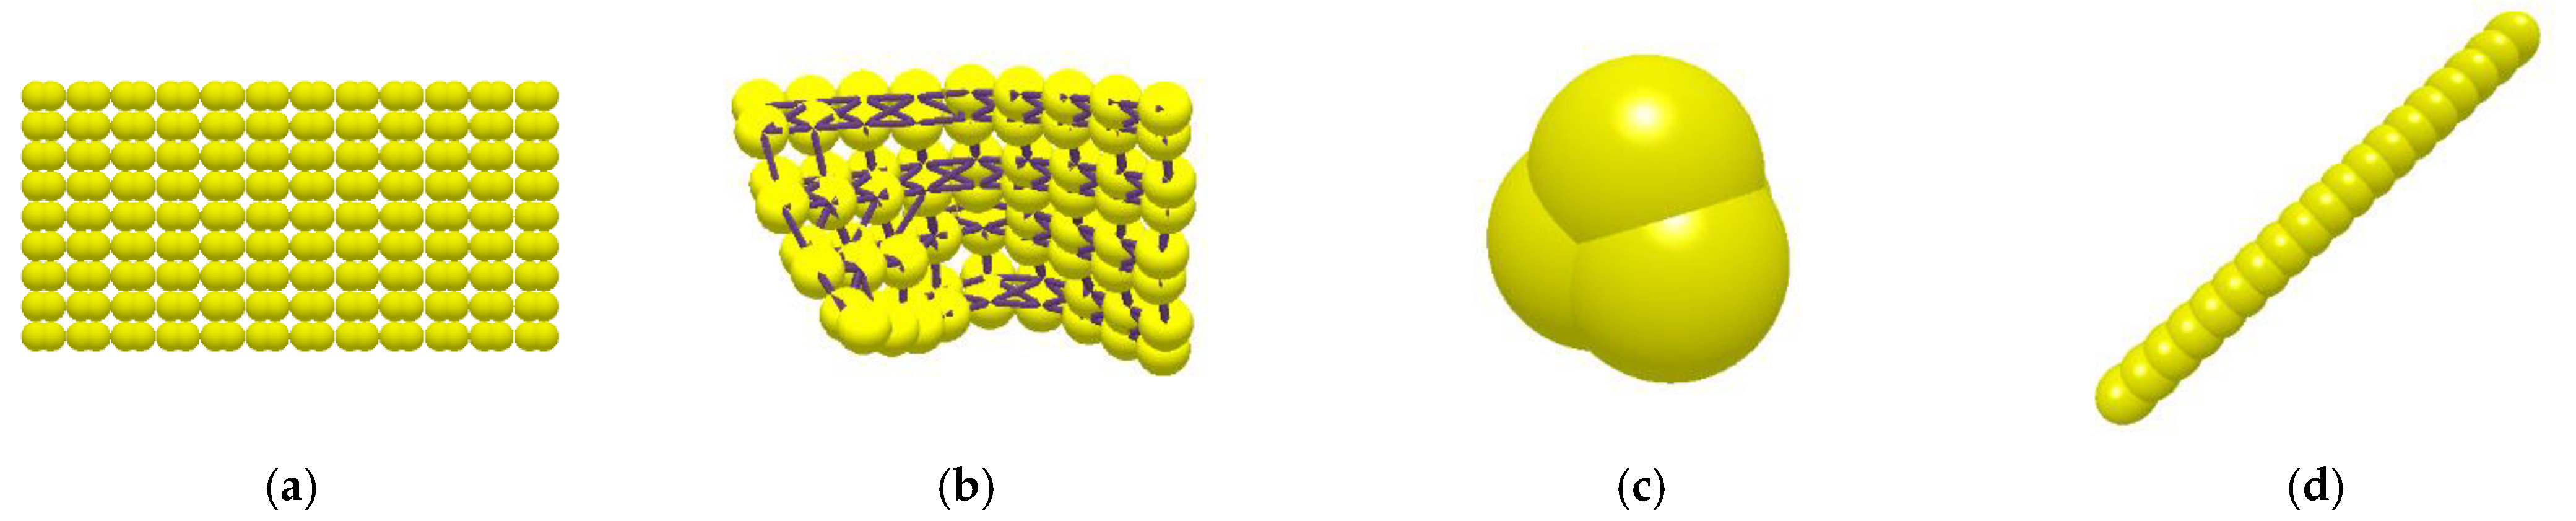
The corresponding material intrinsic parameters were set in the Creator parameter setting interface in EDEM 2020. A particle model of residual film, straw, and soil was established, as shown in Figure 7. The Bonding V2 contact model was added to simulate the flexible characteristics of the residual film. The residual film particle arrangement law and the deformation of the residual film particles after the force are shown in Figure 7a,b. The model could represent the formation of flexible bonds between two bonded spherical particles. The flexible characteristics of the residual film were restored to their maximum extent. Since the volume fraction of the residual film inside the device was small, the effect of the thickness of the residual film on the flow field and the motion of the residual film was ignored to minimize computational efficiency. To reduce the calculation volume and improve the simulation efficiency, the effect of the thickness of the residual film on the flow field inside the separation device and the motion of the residual film were ignored. The residual film particle diameter was increased, and the residual film particle density was decreased to maintain a constant residual film mass.
Particle Model Authenticity Verification Test
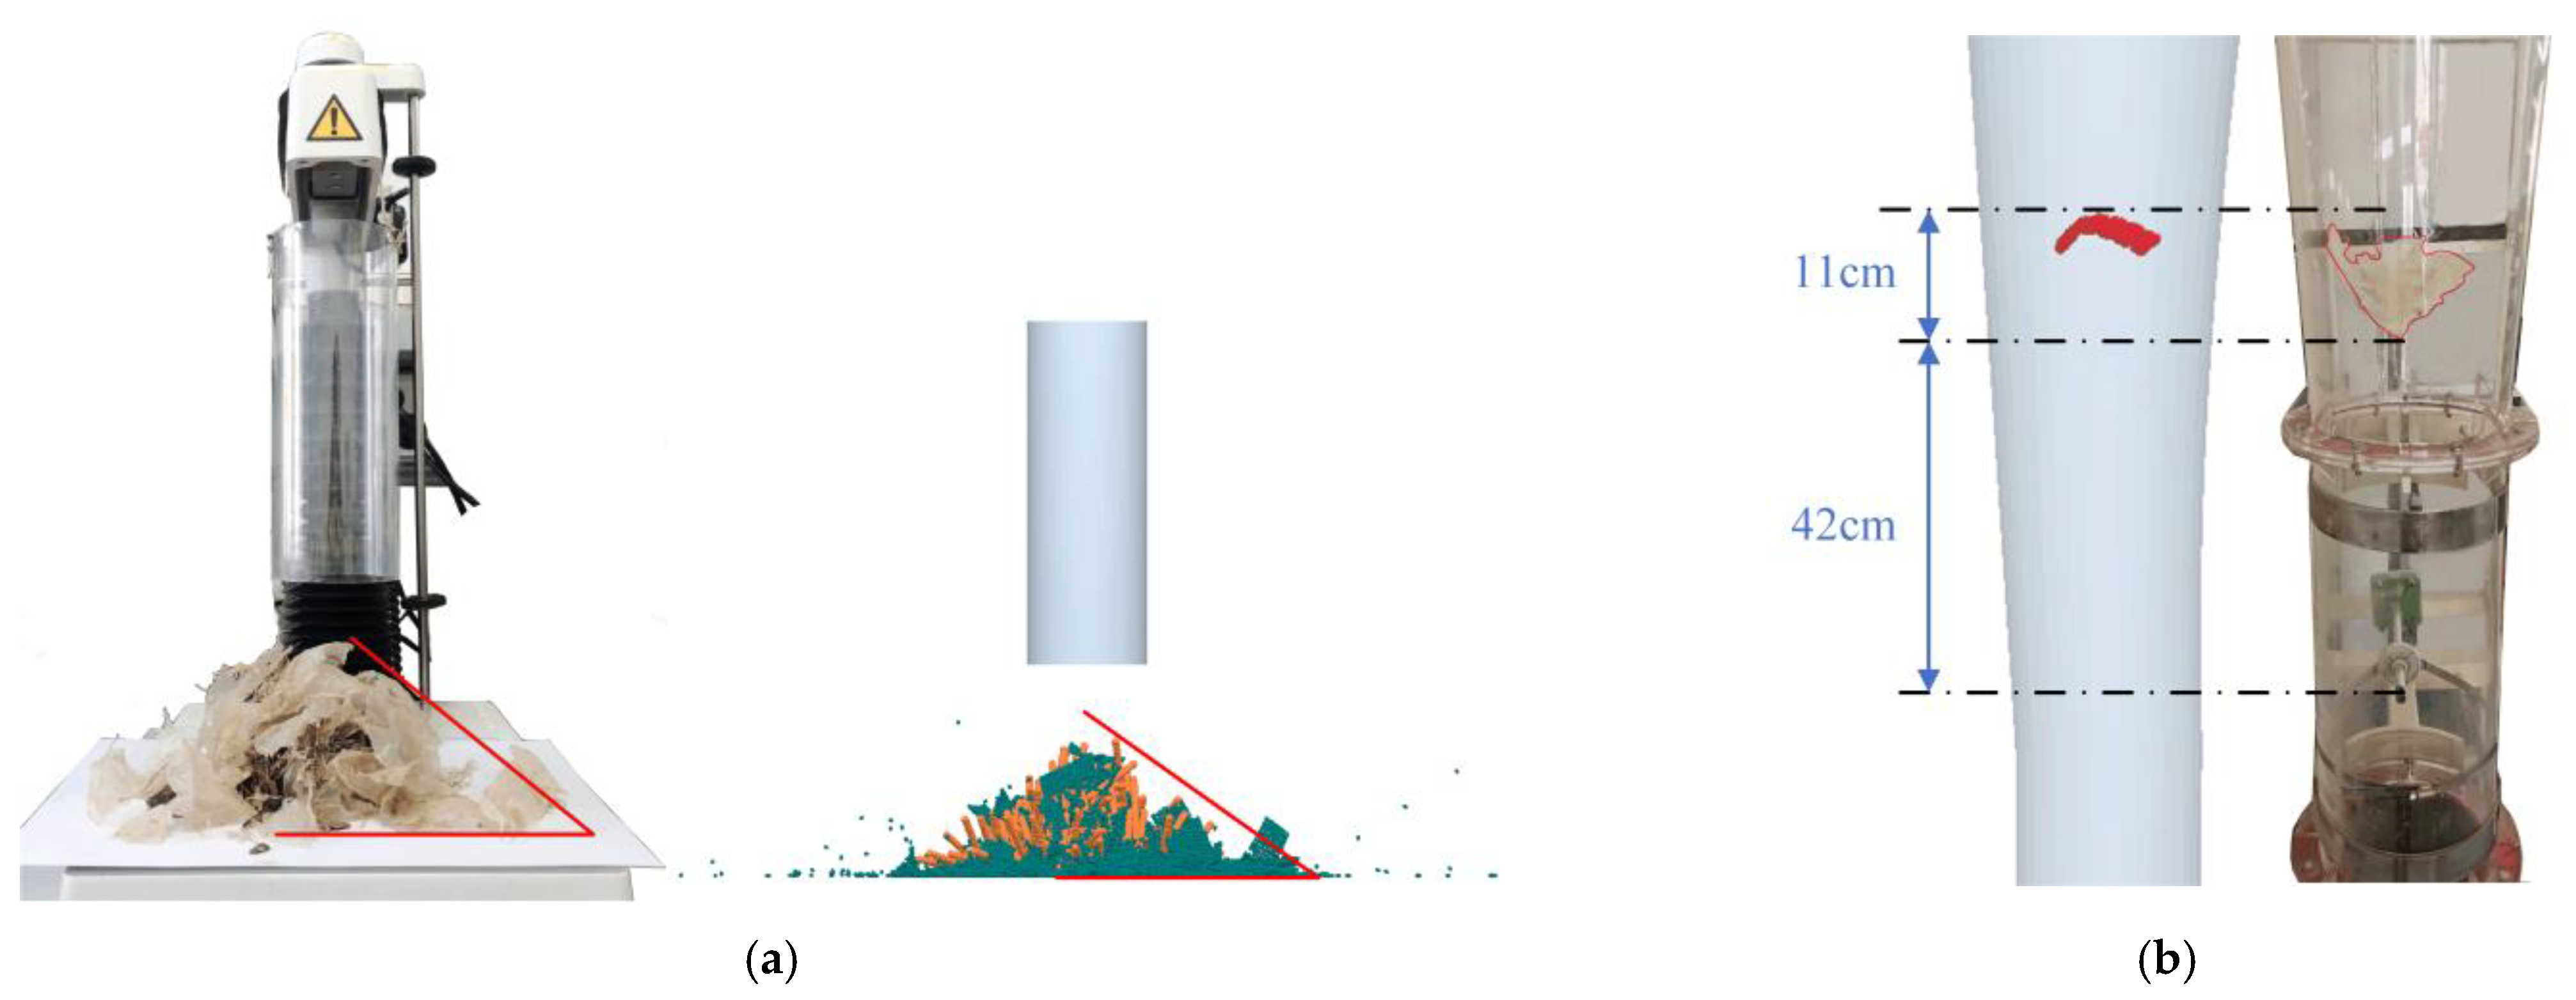
The stacking angle validation test was designed to verify the accuracy of the basic physical and contact parameters of the proposed particle model, as shown in Figure 8a. For the stacking angle test, a transparent bottomless cylinder with an inner diameter of 70 mm, a thickness of 1.5 mm, and a height of 200 mm was used to fill the transparent cylinder with the material in proportion to the composition of the residual film–impurity mixture, and the cylinder was slowly lifted by clamping it with a lifting device. After all the materials flowed out from the bottom of the cylinder and formed a stable pile, vertical photographs were taken to measure the pile angle, and this test was repeated 10 times. To perform the stacking angle simulation test, EDEM 2020 software was used to model the bottomless cylinder according to its size specifications. After generating a certain amount of particles to fill the cylinder as a particle plant, a slow rise speed was set for the cylinder, and the simulated particles flowed out from the bottom of the cylinder to finally form a stable pile of particles. The pile angle of the pile of particles of the residual film–impurity mixture was measured, and the average value was taken to compare with the pile angle of the actual physical test. The stacking angle of the actual test was 39.1°, and the stacking angle of the simulation test was 36.2°, with a relative error of 7.4%. The simulated stacking angle matched well with the actual test stacking angle, indicating that the contact parameters of each component of the film-hybrid mixture were set reasonably and can be used for simulating working conditions.
At the same time, suspension characteristics of the residual film particles using the developed contact model were investigated. The residual film particles were used as the simulation material. Suspension simulation tests were conducted to compare them with the suspension tests on the test bench. As shown in Figure 8b, the radii of the corresponding circular cross-sections from low to high were 100, 135, and 155 mm because the flow rates through the different cross-sections were the same. The flow relationship was given using Equation (4):
where rf is the material suspension position circular cross-section radius (mm); rm is the thermal anemometer position circular cross-section radius (mm); vf is the material suspension speed (m/s); and vm is the thermal anemometer reading.
The relationship between different circular cross-section radii and the corresponding position suspension speed was deduced using Equation (5):
At the same test conditions, the speed of the fan was controlled using the controller. The suspension velocity of the residual film in both the simulation tests and the test bench suspension tests was in the range of 2.92–5.49 m/s. Thus, the suspension characteristics of the residual film particles in the simulation were similar to those of the residual film material used on the test bench. Therefore, the residual film particles were in agreement with the simulation results.
Analysis of Simulation Results
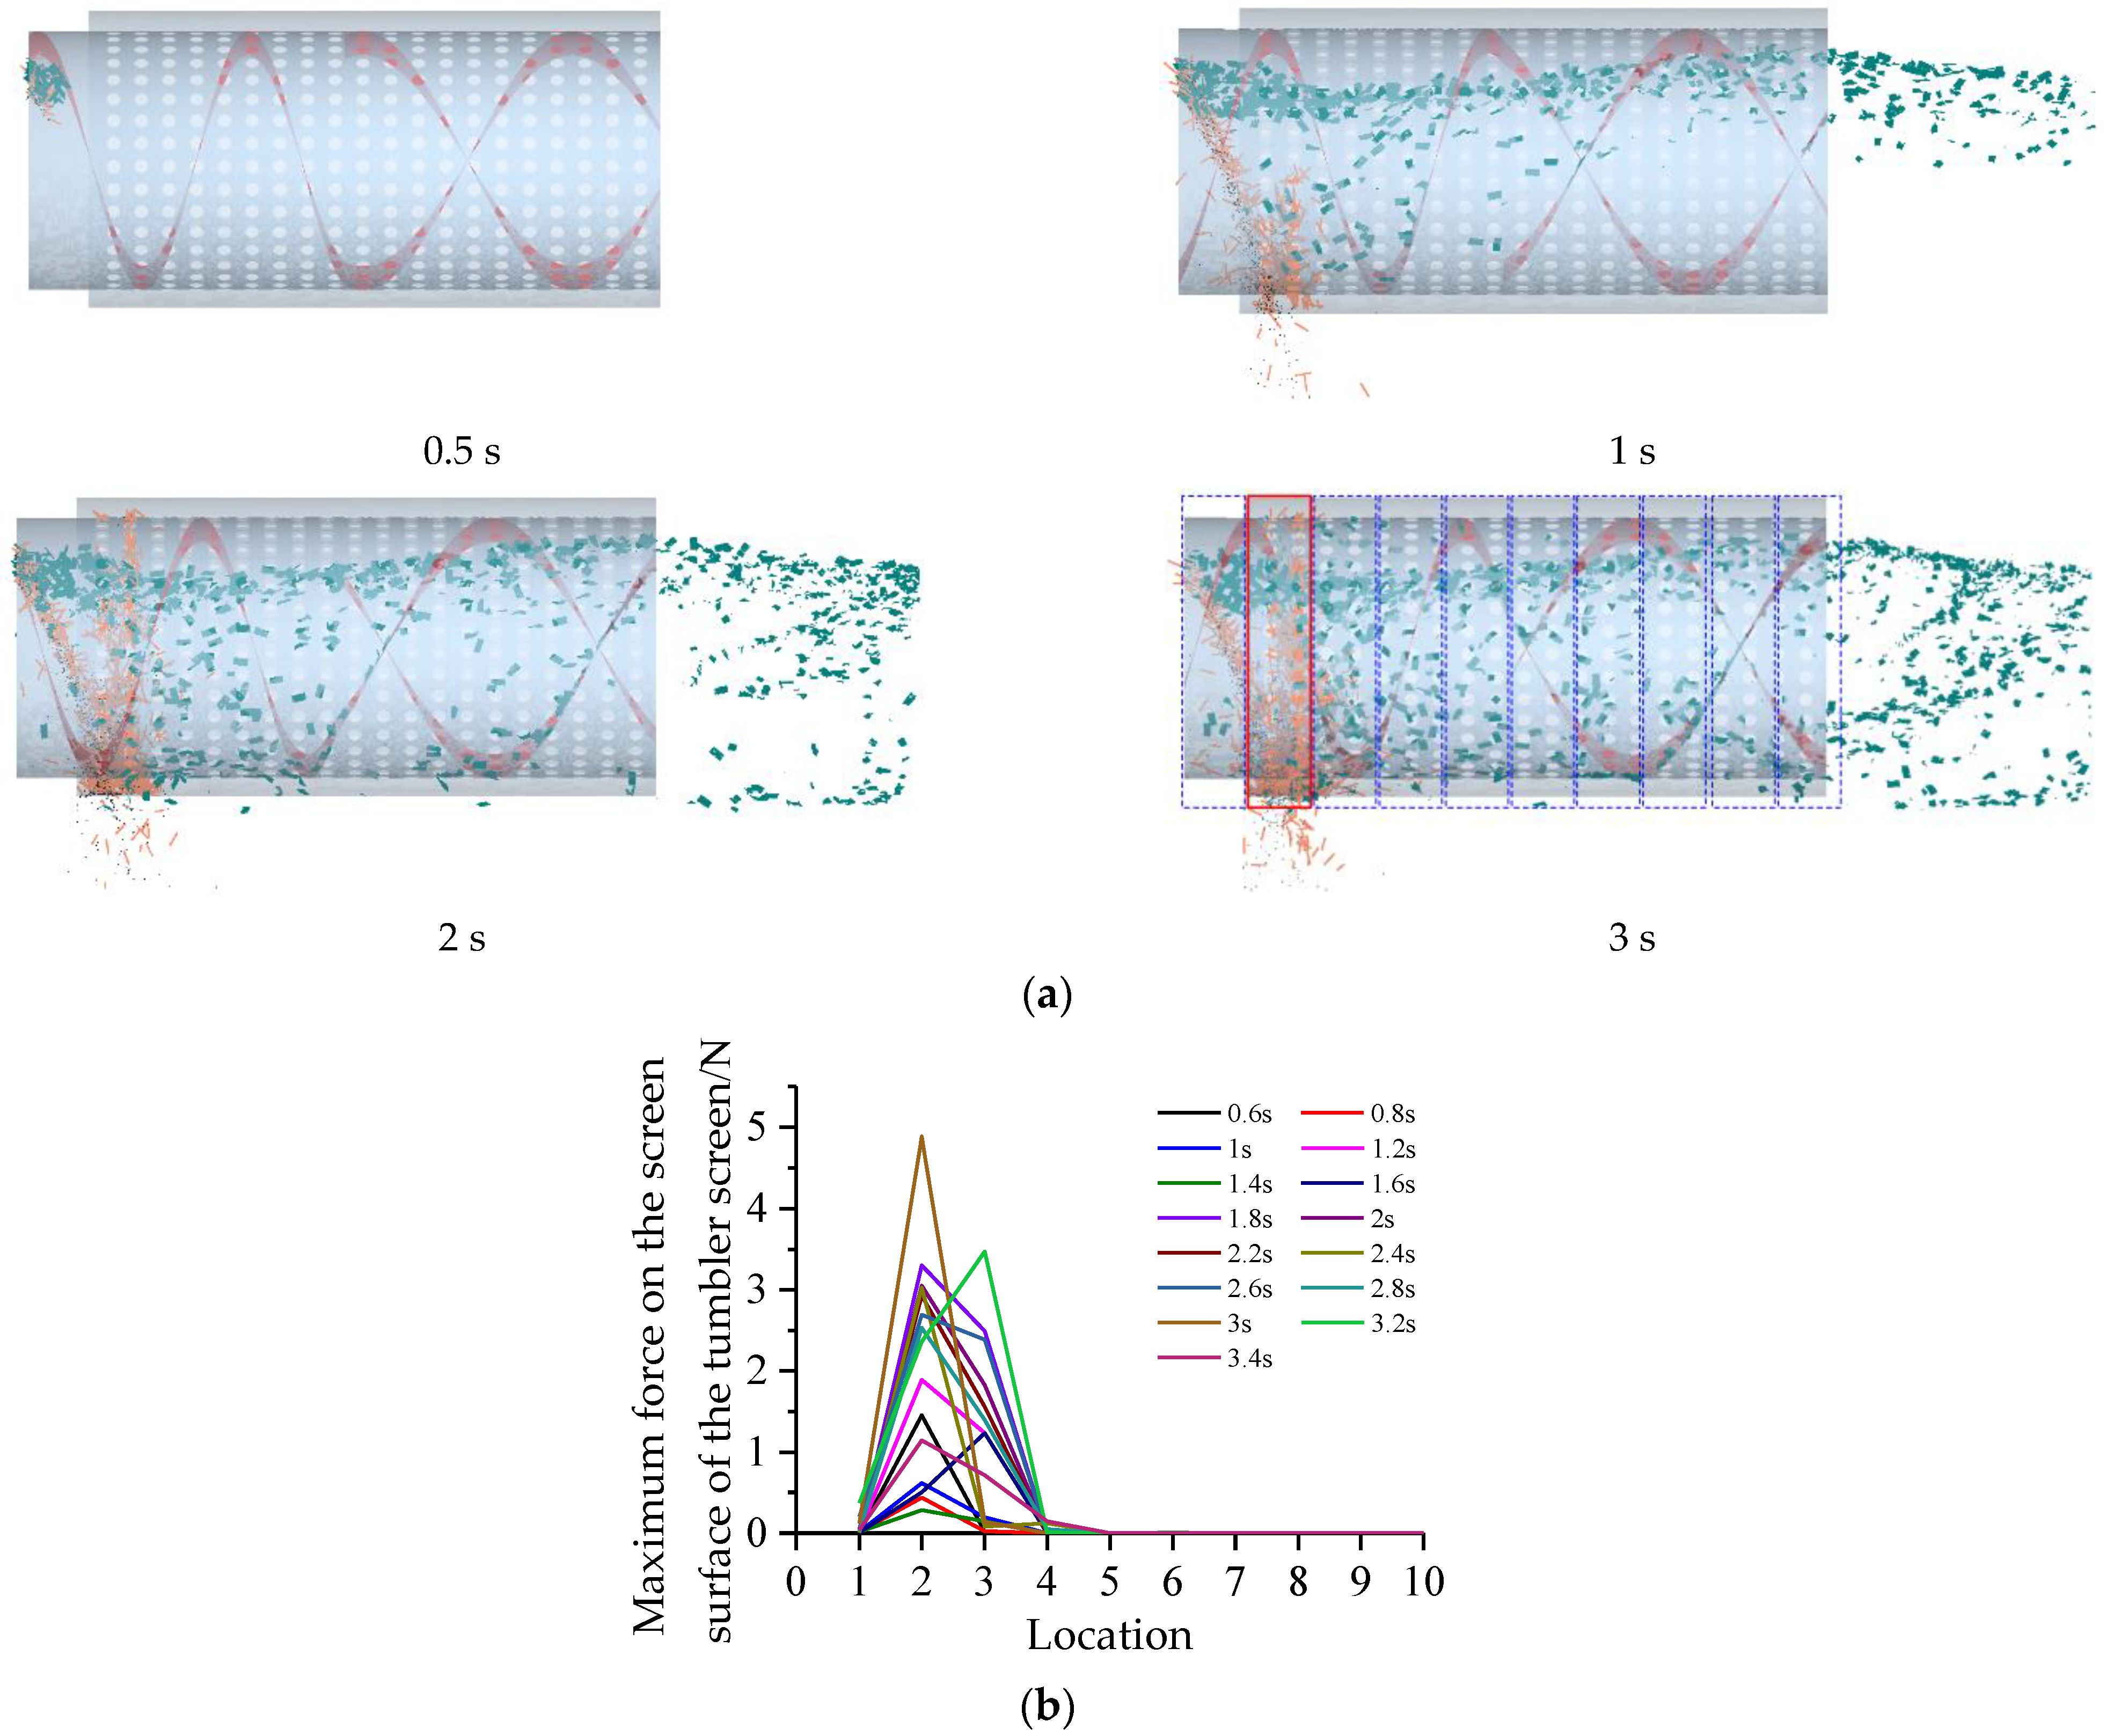
The mass ratio composition of the residual film–impurity mixture was 43% soil, 21% straw, and 36% residual film, and the feeding rate was set to 200 kg/h. A particle factory (a plane that generates particles) was added to the simulation software to produce particles in this ratio (the simulation process is presented in Figure 9a). The starting point was toward the left side of the trommel screen. Monitoring areas (thickness: 300 mm) were designed adjacent to each other. The maximum collision force between the residual film–impurity mixture and the screen surface of the trommel screen was derived for each region at different times. The line graph shown in Figure 9b plots the location against the maximum force on the screen surface of the tumbler screen. The maximum collision force occurred in the area shown in the red solid box in Figure 9a. Further, we determined that the maximum collision force occurred at the lower end of the red solid box, which was where the material first collided with the drum screen surface when it was fed into the device. The magnitude of the collision force in Figure 9b shows that a very small force was generated by the collision between the residual film–impurity mixture and the right side of the trommel screen. When the residual film–impurity mixture was not successfully depolymerized in the red solid line box (Figure 9a), it was challenging to depolymerize with the backward movement of the device. This caused a sudden increase in the impurity content in the membrane collection box. Therefore, to ensure effective depolymerization of the residual film–impurity mixture, in-depth analysis of the material feeding to the stage of collision with the trommel screen was required.
The flow-solid coupling simulation test can thus accurately represent the force of the trommel screen to some extent. Analysis of the forces at different locations of the trommel screen at different times determined the location of the maximum collision force. Therefore, to ensure the effective decoupling of the residual film–impurity mixture, an in-depth analysis of the material feeding to the stage of collision with the trommel screen is crucial.
2.3. Optimal Structural Form and Feeding Volume Determination
2.3.1. Force Analysis of Residual Film–Impurity Mixtures
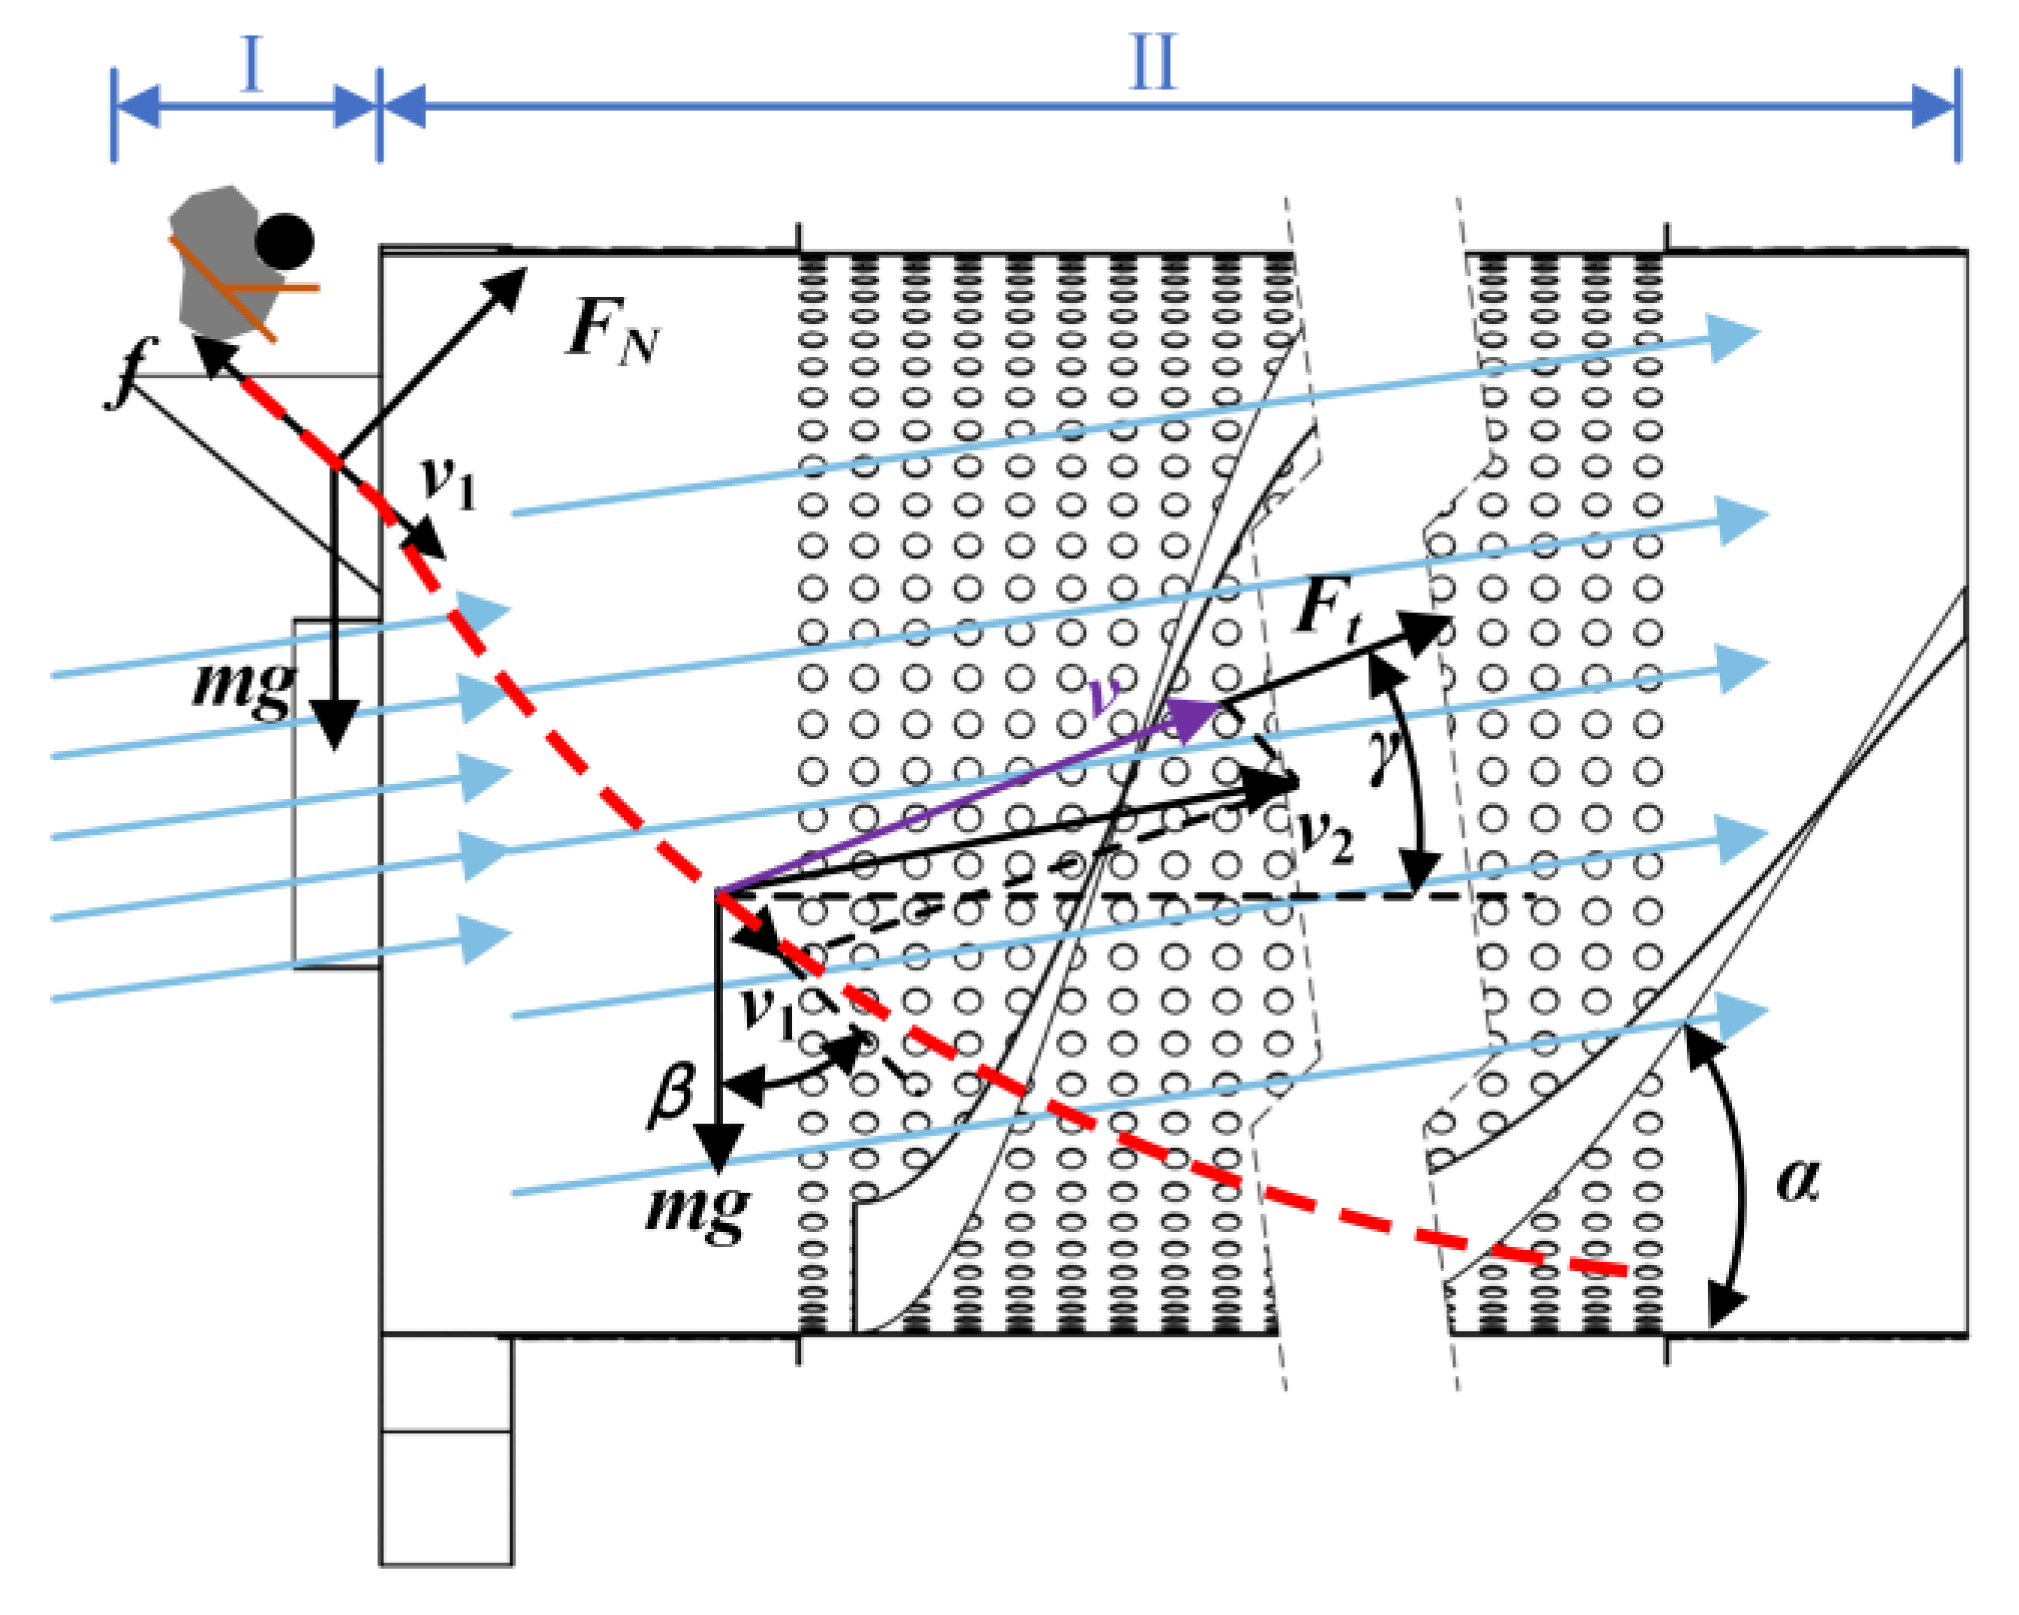
Force analysis (Figure 10) for the residual film–impurity mixture from the feeding device to the first collision stage with the trommel screen was used to study the movement of the residual film–impurity mixture inside the film-hybrid wind separator.
Figure 9 shows the residual film–impurity mixture in the wind separator inside the residual film–impurity mixture through the Ⅰ feeding stage and Ⅱ cleaning stage. The residual film–impurity mixture was subjected to gravity (mg), friction force (f), and support force (FN) during stage Ⅰ. The direction of displacement of the residual film–impurity mixture was along the inlet slope and downward. There was an acute angle between the direction of gravity and the direction of motion, which resulted in positive work; the direction of friction was opposite to the direction of motion, which resulted in negative work. The direction of the support force was perpendicular to the direction of motion, resulting in zero work. The law of conservation of energy was represented using Equation (6).
Friction occurred due to a collision between the residual film–impurity mixture and the inlet, which offset part of the work done by gravity on the residual film–impurity mixture. Compared to the case of no collision, there was velocity loss. Therefore, when the residual film–impurity mixture was fed into the residual film–impurity mixture wind separator, the collision between the material and the inlet had to be minimized.
There was a flow field with a horizontal angle α = 8° inside the tumbler screen. The velocity of the material entering the device was v1, and the direction was the same as the inlet slope, that is, β = 45°. The residual film–impurity mixture was subjected to vertical downward gravity (mg) and airflow resistance (Ft) relative to the direction of material velocity, γ, during stage II; the direction of airflow resistance was the same as the direction of movement of the material relative to the airflow, and the airflow resistance, Ft, was calculated using Equation (7):
where C is the air resistance coefficient; A is the material windward area (m2); and ρs is the air density (kg/m3).
As shown in Equation (7), after the material entered the device, in addition to the airflow, which was necessary for clearing the airflow imposed by the air resistance, no other factors affected the speed of the material. Therefore, to ensure maximum speed of the residual film–impurity mixture and the drum sieve collision, the structure of the feed opening should be optimized; this also minimizes the speed loss during the feeding process.
2.3.2. Inlet Structure Design
To minimize the ratio of impurities in the residual film in the residual film–impurity mixture wind separator film, the quality of the collected film per unit of time should be maximized. After optimizing the film and debris wind separator and its drum screen speed, air inlet air speed, and other operating parameters for a certain value, i.e., the drum speed of 26 rpm and the air inlet air speed of 8.5 m/s [22,23]. At this time, by controlling the feeding volume and determining the best inlet form, the mixture of film and miscellaneous material was mixed with the drum screen. The relative collision velocity was maximized when the residual film–impurity mixture collided with the trommel screen. In turn, to ensure the maximum debris disaggregation degree of the residual film–impurity mixture, the working performance of the residual film–impurity mixture wind separator was improved.
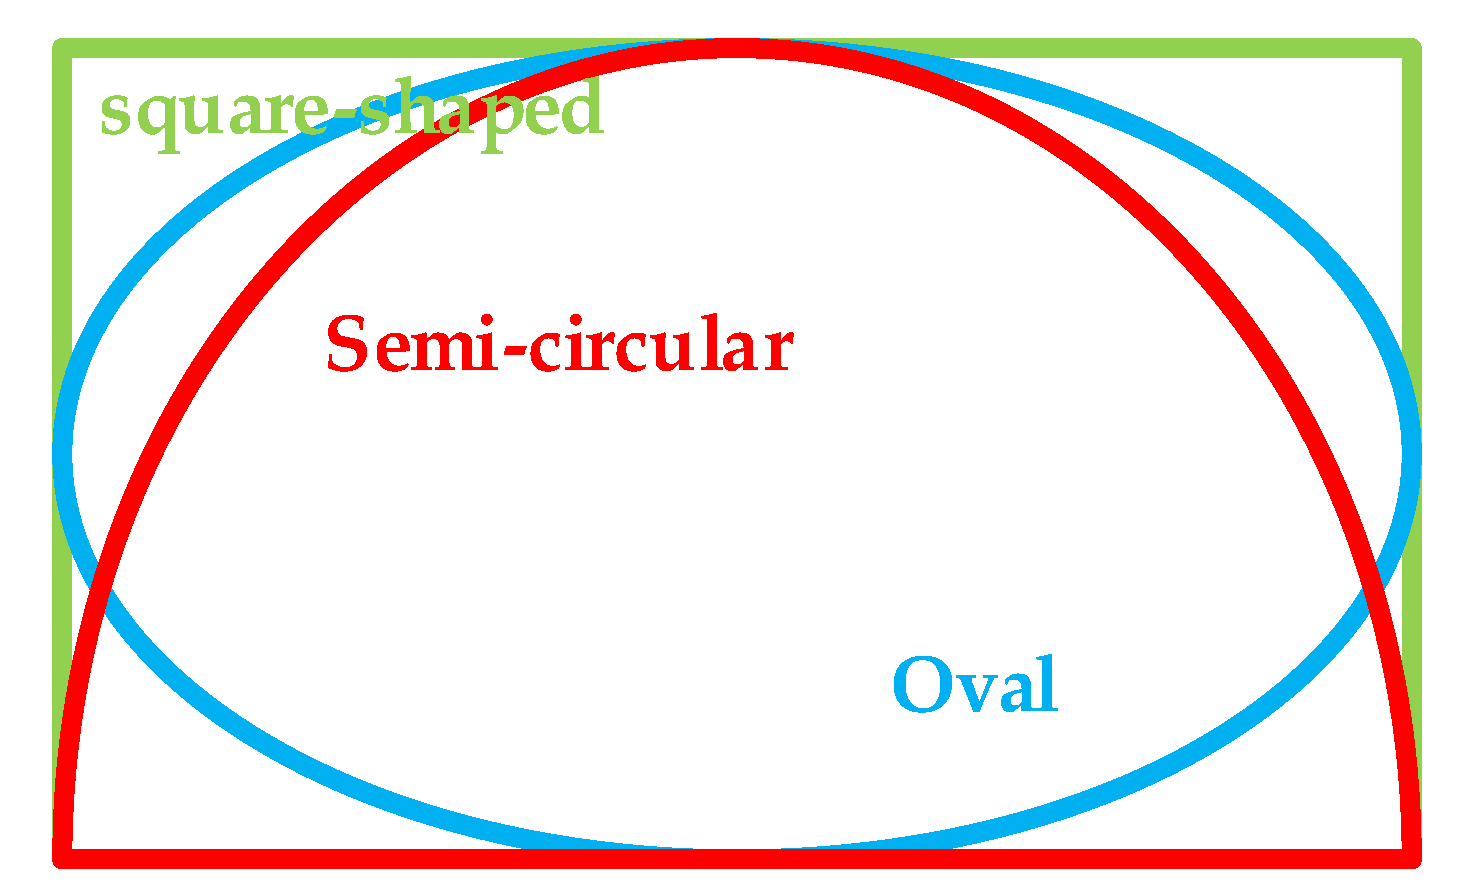
Three types of feed openings were designed, as shown in Figure 11, namely, square, oval, and semi-circular. The inlet areas of the three forms were 0.15, 0.1174, and 0.1178 m2, respectively.
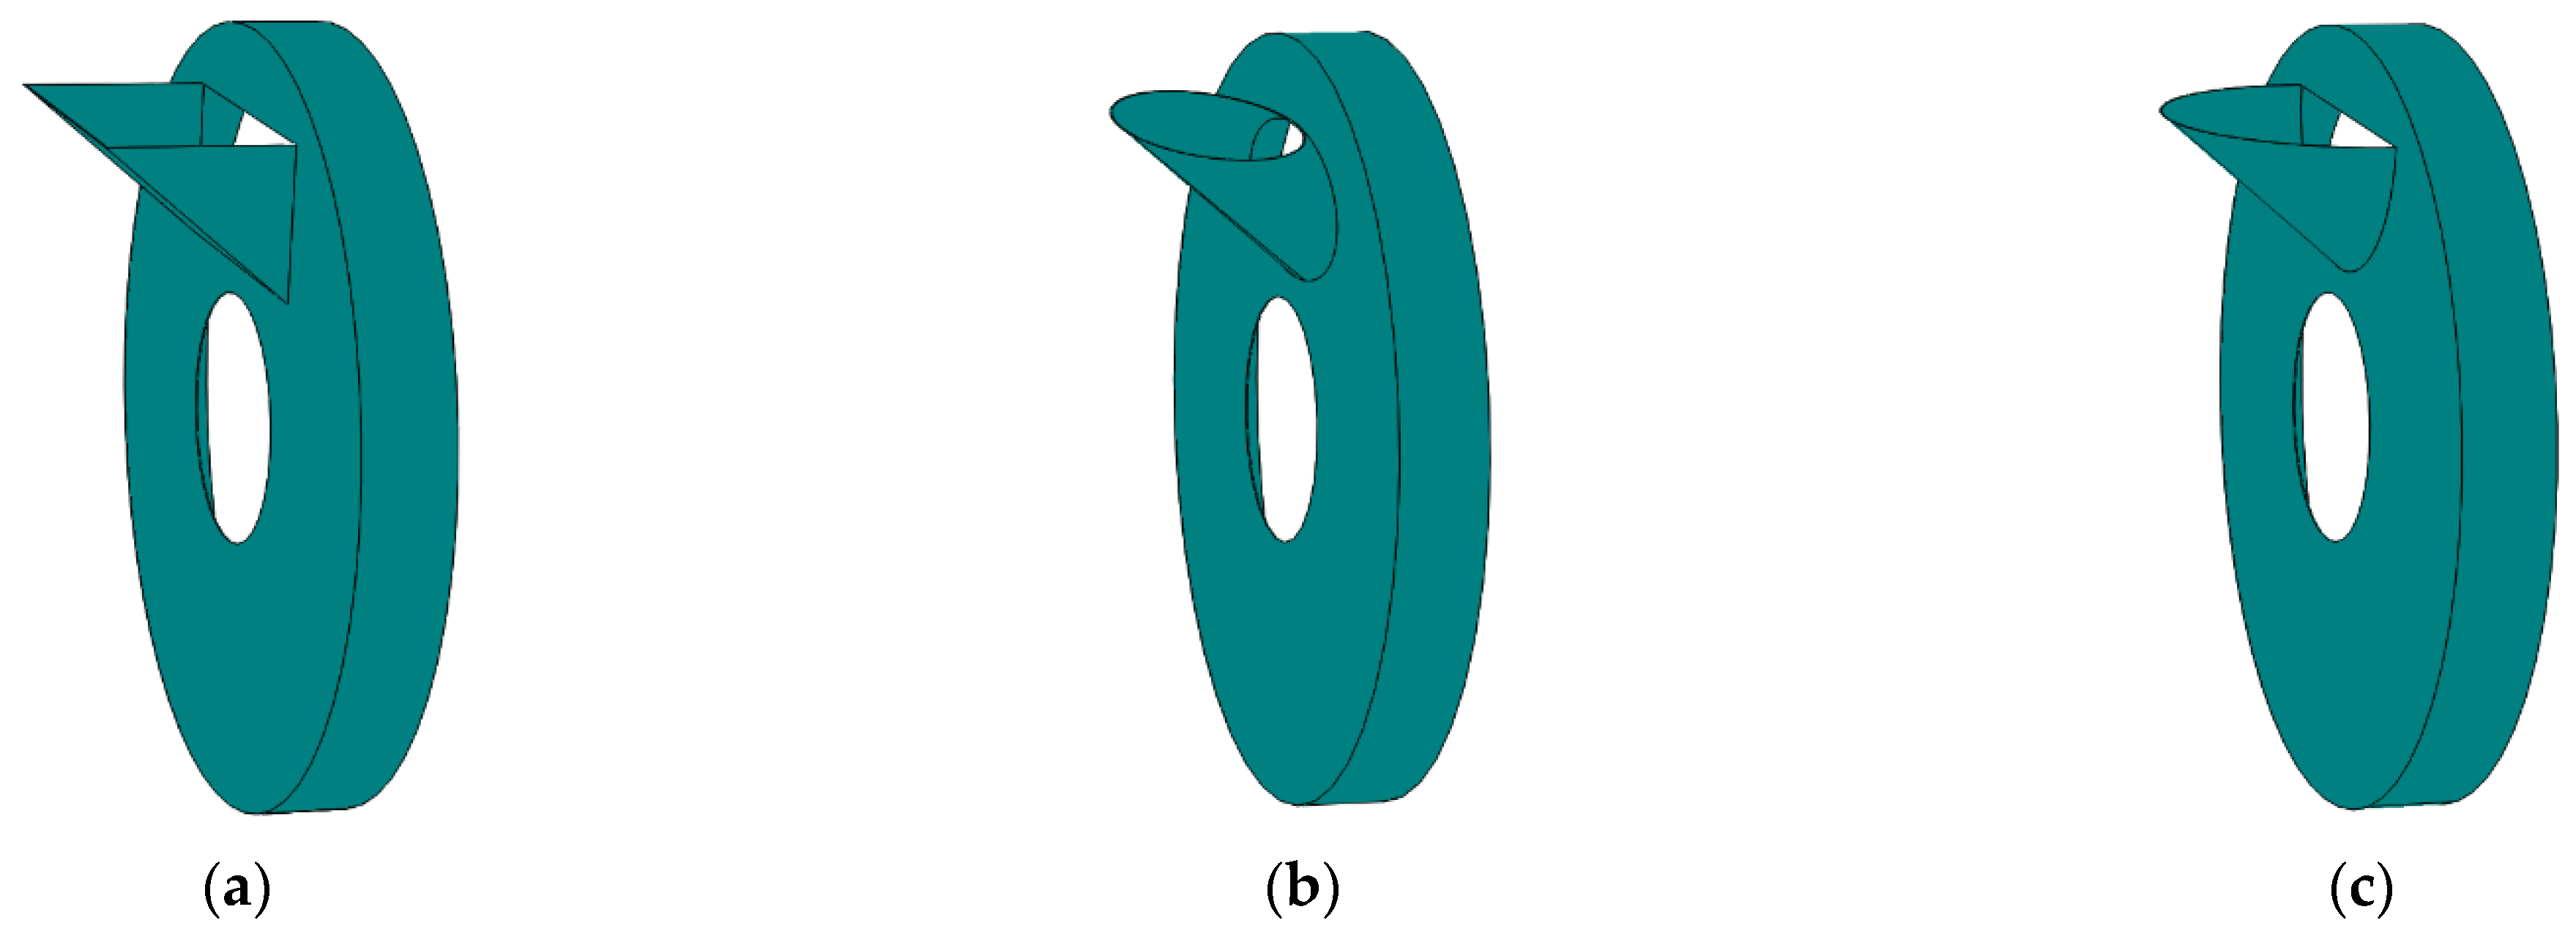
Figure 12 shows a 3D model of the inlet. The square inlet allowed more residual film–impurity mixture to be fed into the device, but it had more sides, and the residual film–impurity mixture collided with these during the feeding process, which led to relatively low velocity when it collided with the drum screen surface, affecting the residual film–impurity mixture depolymerization. Therefore, to investigate the best feed inlet structure form, the collision force of the residual film–impurity mixture on the trommel screen under different inlet structures was determined, and the fluid-solid coupling for the film-hybrid wind separator was simulated.
2.3.3. Optimal Structural Form and Feeding Volume Determination
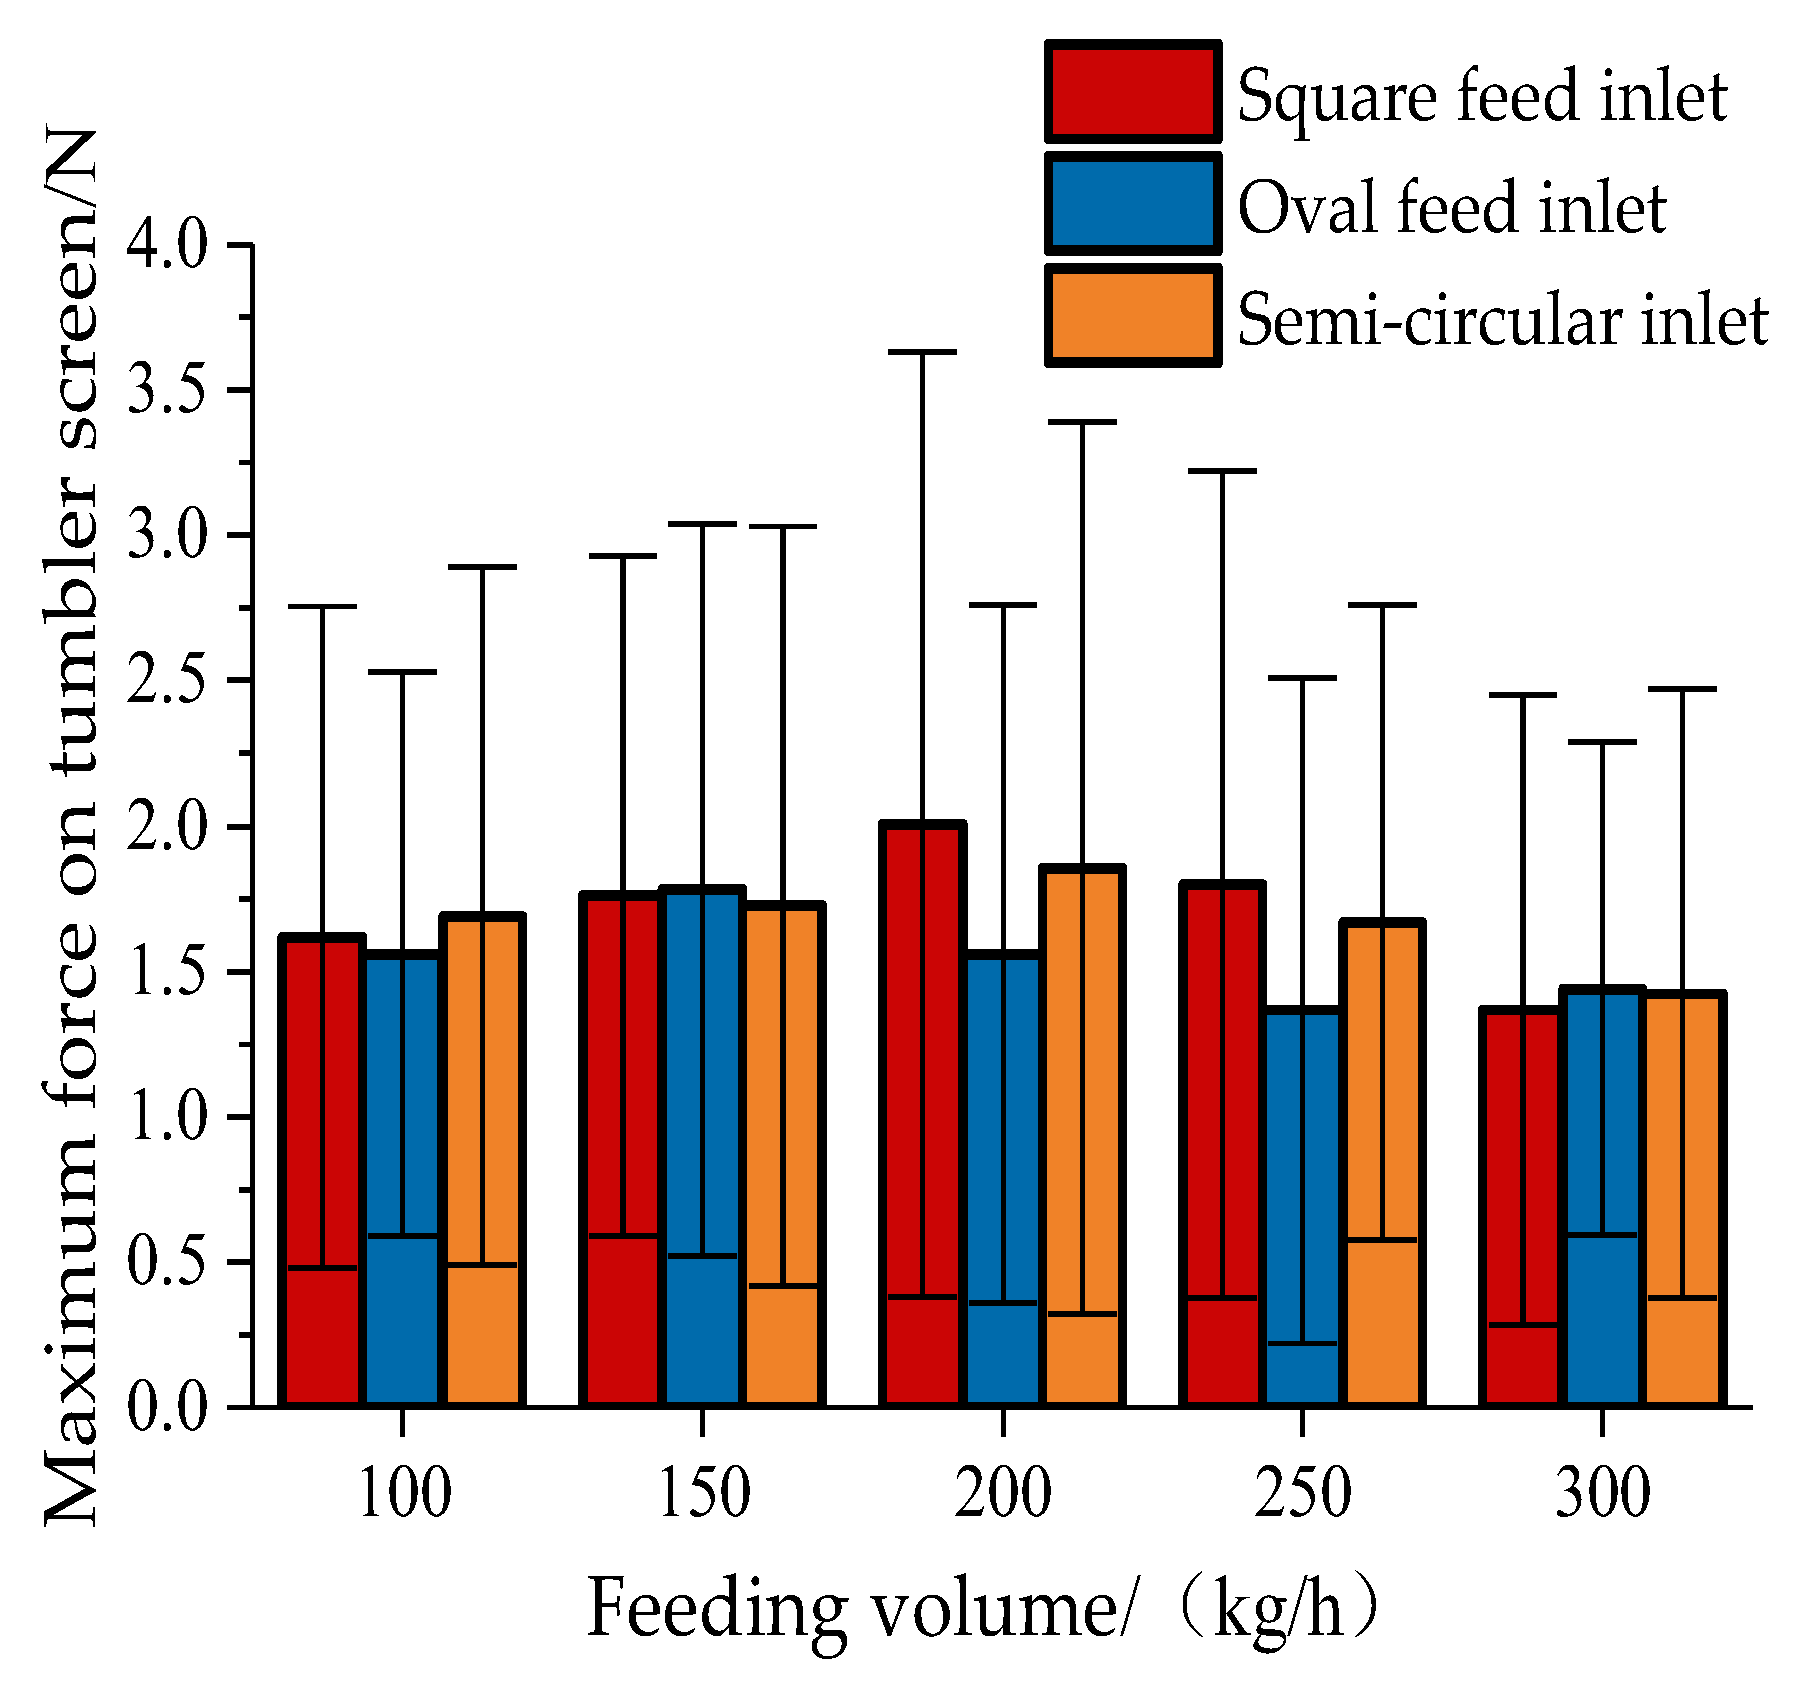
Various forms of inlet structures were simulated. The simulation feeding amount was set according to the proportion of each material mass in the real residual film–impurity mixture. The monitoring area was set up at the position of the red solid line box shown in Figure 9a. The maximum values of the forces on the trommel screen at each moment were determined for each inlet structure. The average value of the statistical results was used as the basis to draw the bar graph shown in Figure 13. The difference between the maximum value and the average value was used as the reference for the error bar.
As shown in Figure 13, the overall force of the trommel screen increased and then decreased. At a small feeding volume, the volume of the residual film–impurity mixture agglomerates was small, and the number of materials was small, resulting in a smaller collision force. At a larger feeding volume, the fed residual film–impurity mixture collided with the edge of the feed opening, leading to serious velocity loss and resulting in a smaller collision force. When a square inlet was used, the larger inlet area resulted in more material feeding and no speed loss during the feeding process. At a large feeding volume of 200 kg/h, the maximum force during the operation of the trommel screen was 3.632 N. When an oval inlet was used, the inlet area was the smallest. Because of this, the size of the agglomerates of the residual film–impurity mixture was limited by the decreased feed rate, and the larger agglomerates could not be fed smoothly. The maximum force during the operation of the trommel screen was 3.047 N at a feed rate of 150 kg/h. When the feed opening was semi-circular, the area of the feed opening was between that of the square and oval ones. Compared to the square feed opening, the structure had a rounded boundary, resulting in challenges with material feeding. The structure had a rounded boundary, which avoided collisions during the material feeding process. Compared with the oval inlet, the semi-circular structure had a larger area, allowing more material to be fed. Therefore, the generated force was between those of the above two structures. The maximum force during the operation of the trommel screen was 3.392 N at a feed rate of 200 kg/h.
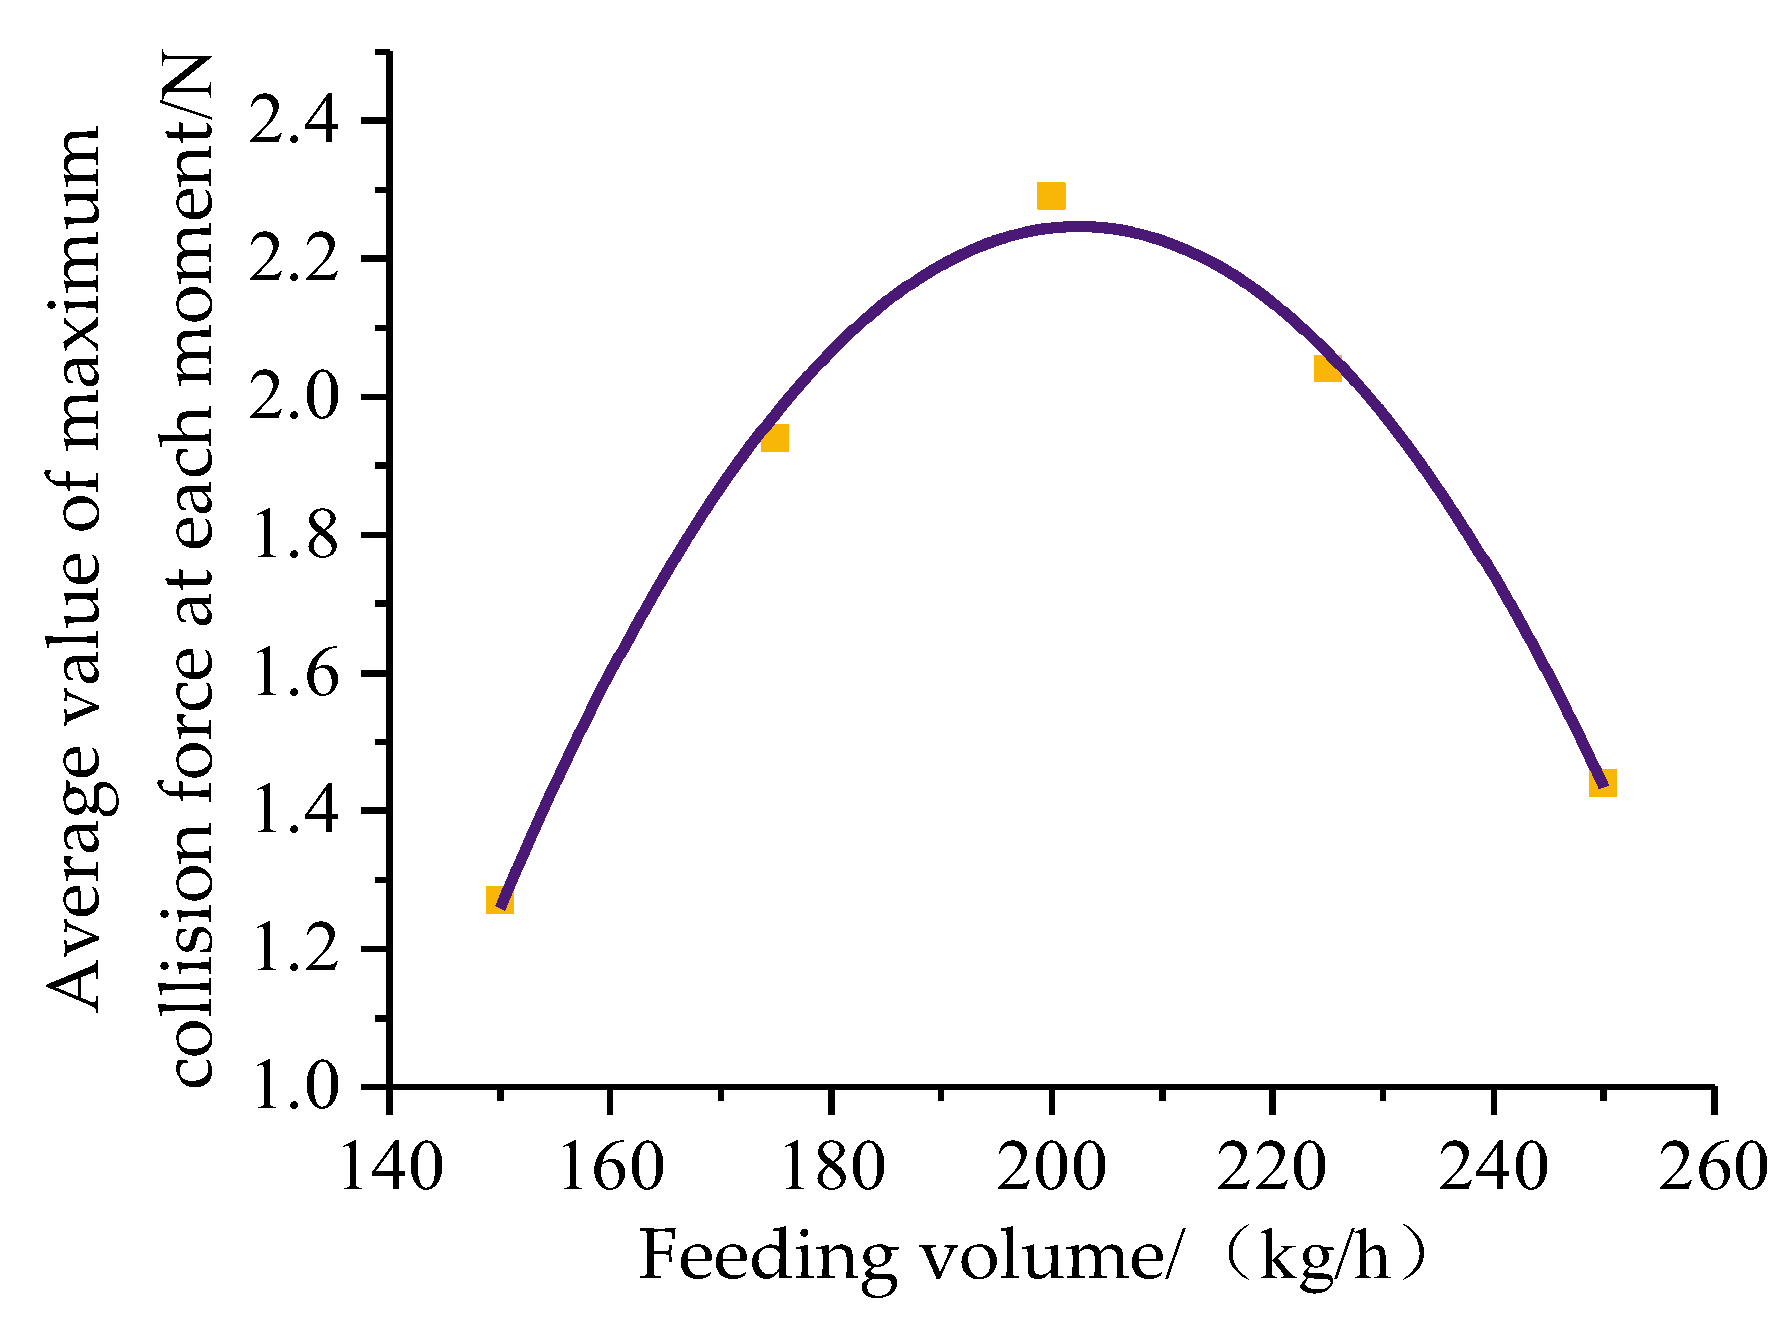
The maximum collision force at all times during the operation of the integrated trommel screen was investigated for different inlet structures. For the square inlet and a feeding volume of 200 kg/h, the collision force between the residual film–impurity mixture agglomerate and the tumbler screen surface was the largest; that is, the agglomerates of the residual film–impurity mixture were most likely to be decluttered. To study the optimal feeding rate of the residual film–impurity mixture under the square feeding port condition, the parameters were further optimized in the range of 150–250 kg/h. The maximum values of the forces on the trommel screen at each moment under different feeding conditions were obtained. The average value was calculated, and a scatter plot was plotted as shown in Figure 14. A curve fit was performed [24,25,26,27,28].
According to the imported data, the fitting equation was set as a quadratic equation: and the curve was fitted repeatedly. The best fit was achieved when the reduced residual sum of squares (RSSs) was constant. At this point, a = −3.58857 × 10⁻⁴, b = 0.1453, c = −12.46171, and R2 was 0.99436. The fitted curve equation was given using Equation (8):
The quadratic equation was solved when x = 202.45, y had the maximum value of 2.25, and the parameters were rounded. At a feeding rate of 202 kg/h, the average value of the maximum collision force at each moment of the tumbler screen was 2.25 N. Therefore, to ensure the best depolymerization effect, a square inlet should be used with a feeding rate of 202 kg/h.
2.4. Test Equipment
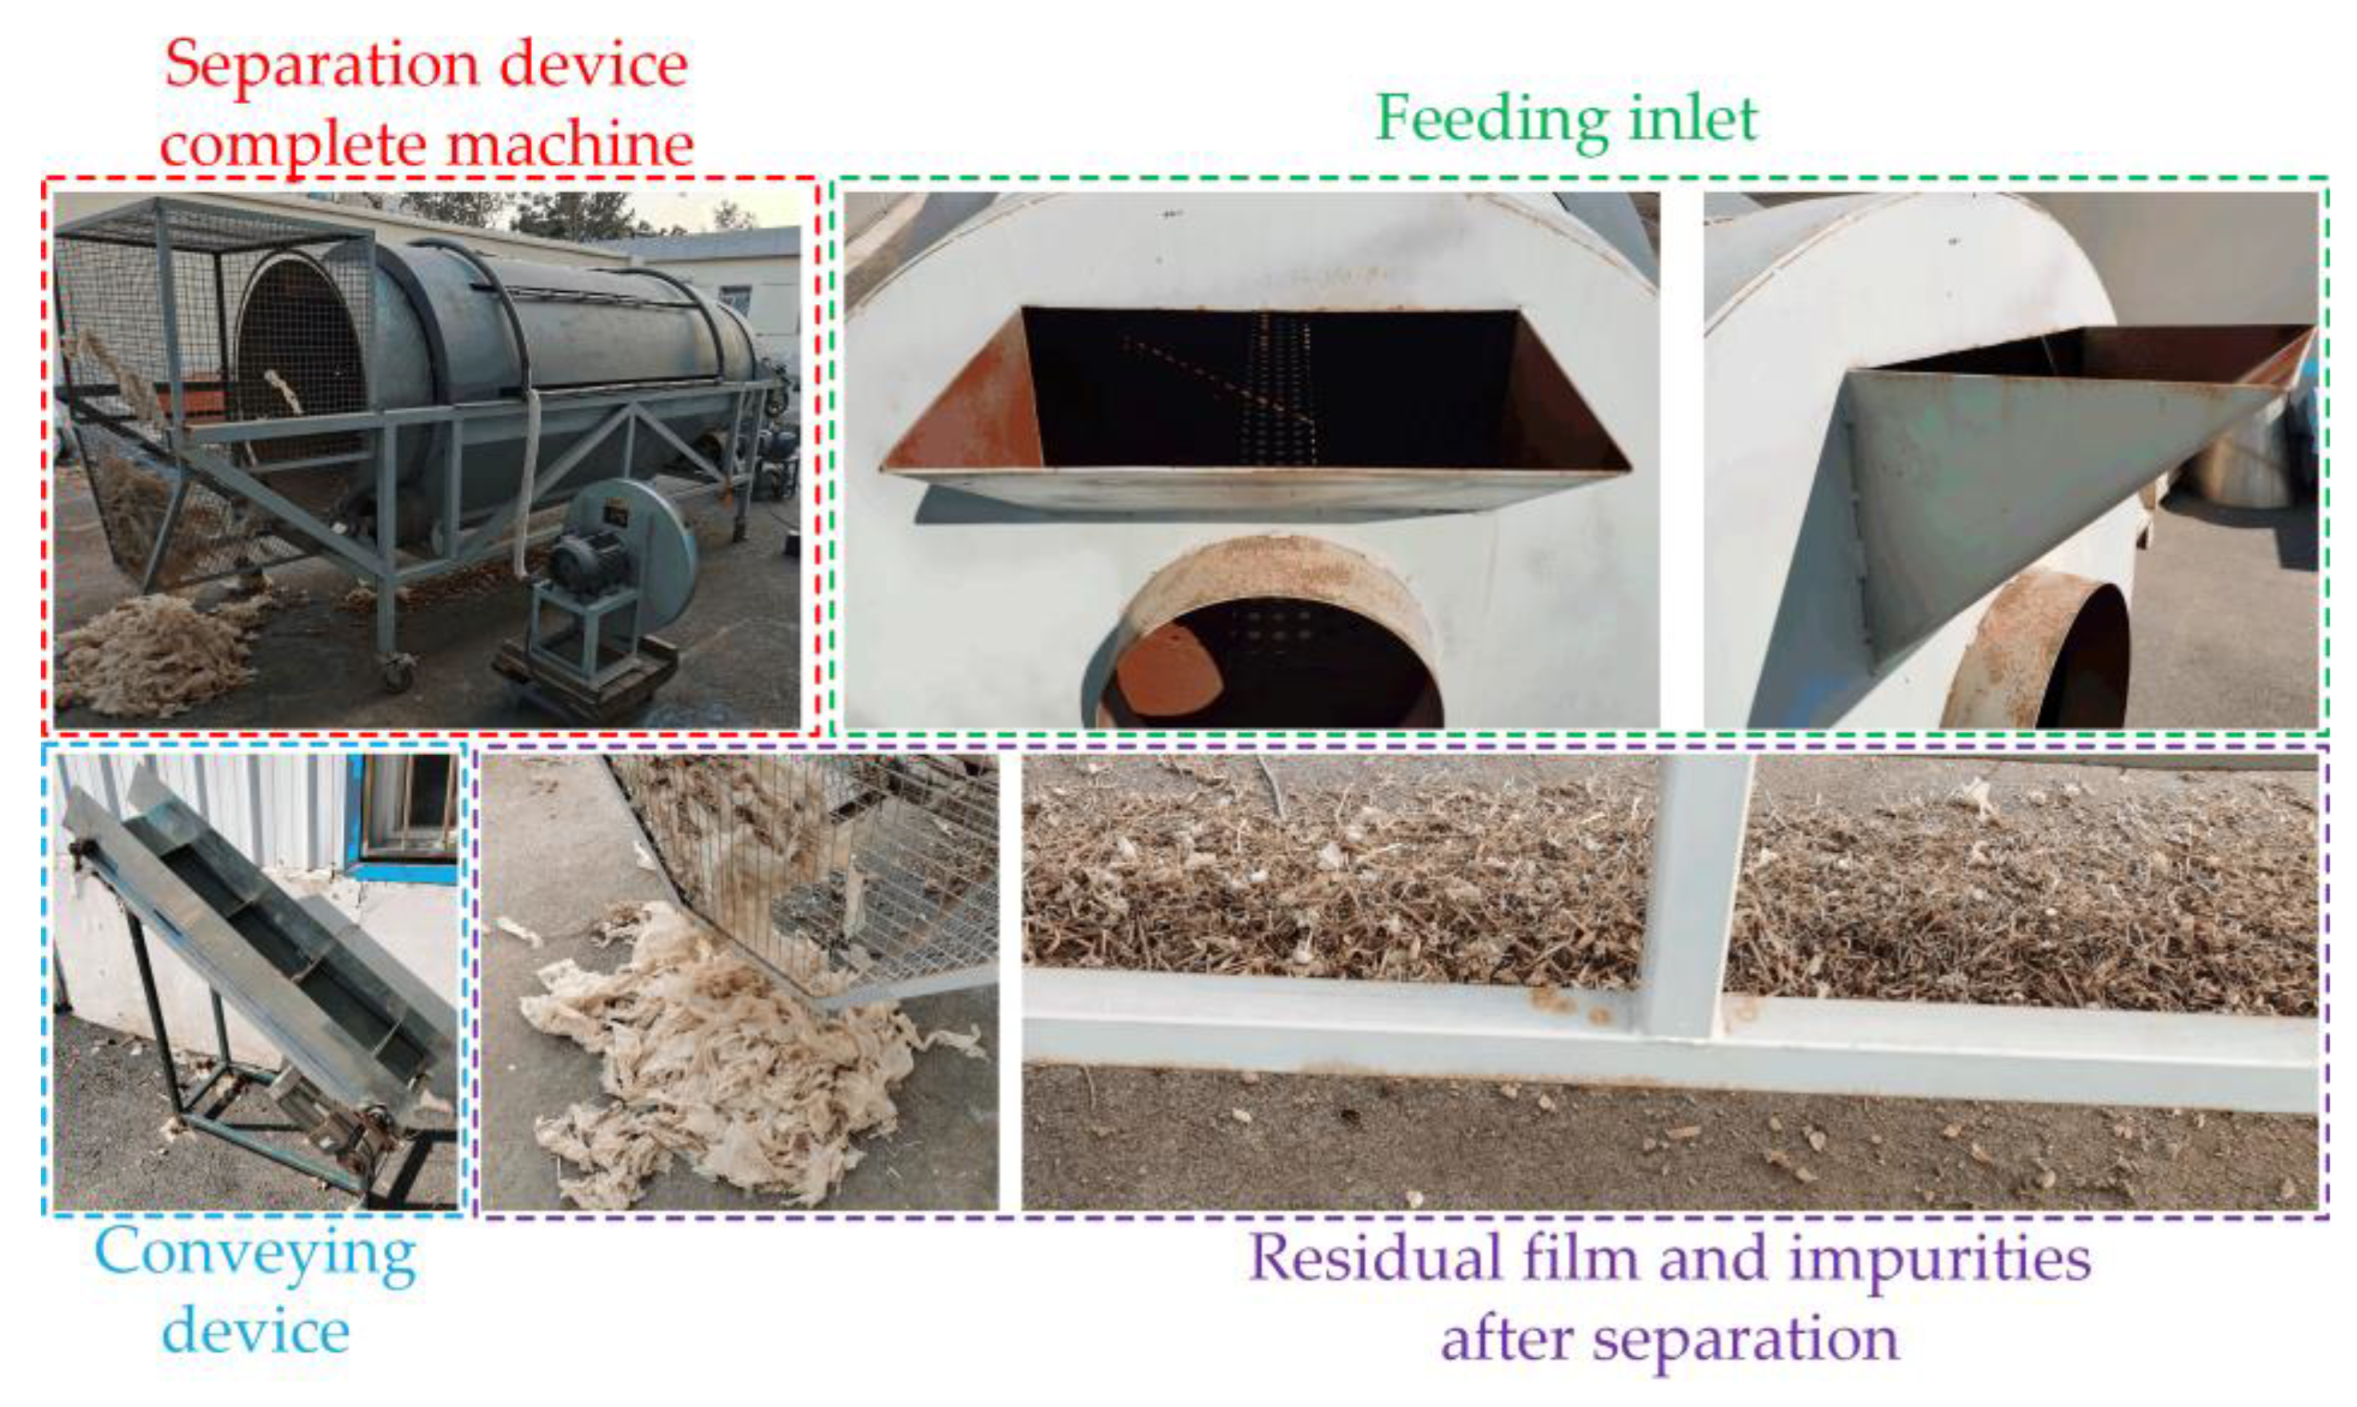
Herein, the working performance of the wind separator under the feed inlet structure and the feeding volume were verified. In the pilot plant of the Shandong Agricultural Machinery Research Institute, the machine was tested under the conditions determined in Section 2.3.2. Changes in the ratio of impurities in the residual film under this condition were compared. The actual machine test is presented in Figure 15.
Figure 15 shows the wind separator, inlet, and conveyor belt, as well as the residual film and straw after cleaning. The test apparatus and equipment included the trommel screen-type film miscellaneous wind separator, screen hole clearing plugging device, handheld thermal anemometer, an electronic scale, and so on.
2.5. Test Program and Evaluation Index
2.5.1. Test Program
The operating parameters of the test object, a film miscellaneous wind separator, were set to the determined optimum values, that is, air inlet speed, airflow angle, and drum speed of 8.5 m/s, 8°, and 26 rpm, respectively. Under this condition, the device was started until the flow field inside the device stabilized. The space between the two compartments of the conveying unit was 300 mm. Each section could convey 300 g of residual film–impurity mixture. The diameter of the rotating shaft was 40 mm at both ends, and the motor speed was 885 rpm. The wind separator was continuously operated, and the airflow speed at the air inlet was determined using a handheld thermal anemometer (measuring range: 0–30 m/s, error: ±1%). We ensured that the speed at the air inlet was 8.5 m/s under the conditions determined in Section 2.3.2.
2.5.2. Evaluation Indicators
The ratio of impurities in the residual film was used as the evaluation index, and the film trash wind separator worked continuously. Every 5 min, the residual film, and impurities in the film collection box were sampled and weighed for statistics. The measurements were recorded 50 times. The ratio of the residual film to the mass of impurities in the film cleaned by the wind separator was the ratio of impurities in the residual film. The relationship was determined using Equation (9):
where Y1 is the ratio of impurities in the residual film (%); m2 is the mass of residual film in the film collection box (kg); and m1 is the mass of impurities in the film collection box (kg).
3. Results
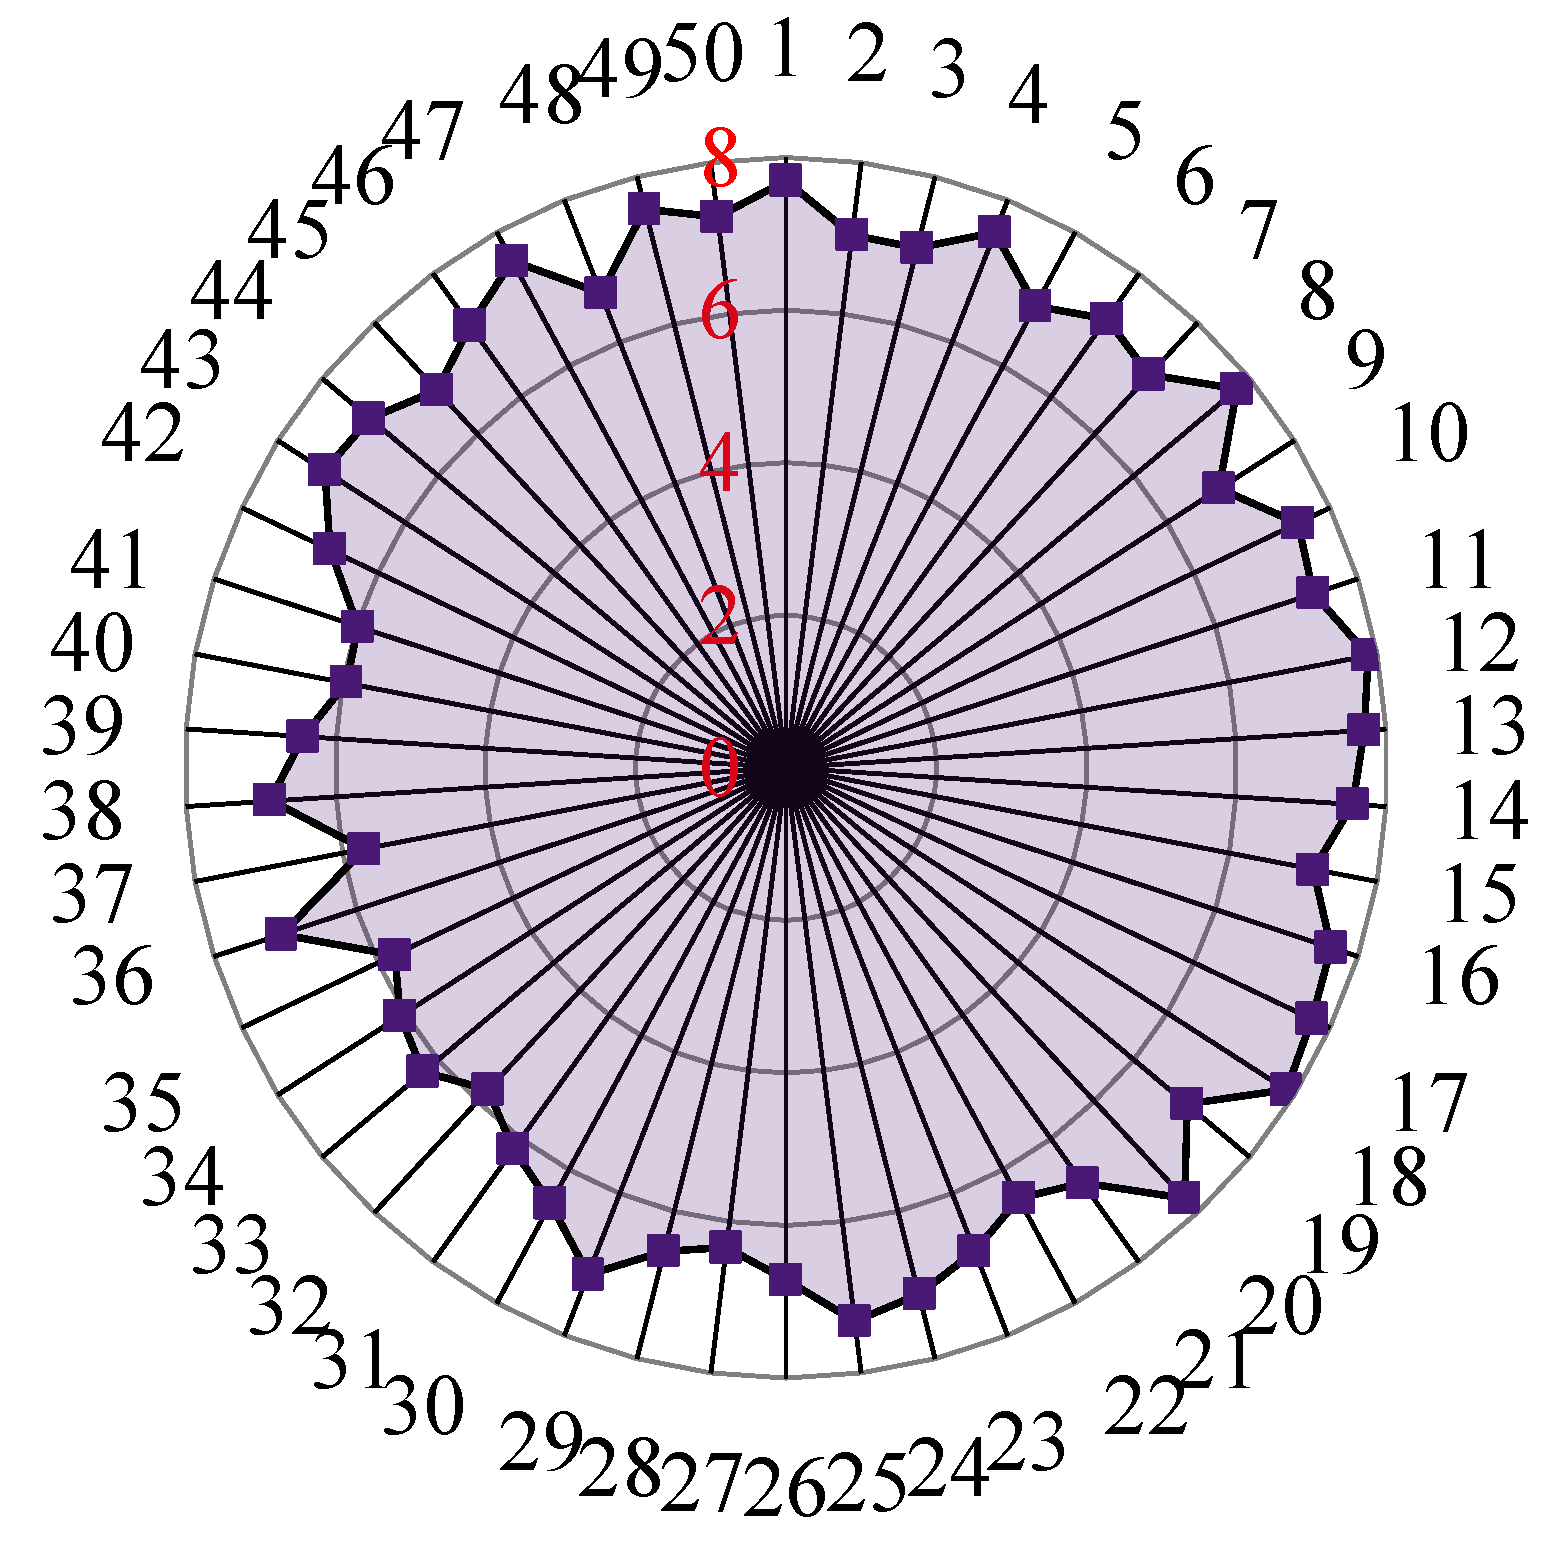
According to the developed test program, the impurities removed from the film collection box were weighed using the electronic scale. According to the relationship equation of the evaluation index, the ratio of impurities in the residual film for each test was calculated. The test results were divided into 5 groups, and the average value of the results of each group was calculated. The coefficients of variation and variance of all tests were calculated and used to evaluate the degree of dispersion of the data. The test results are shown in Table 2, and the radar plot shown in Figure 14 was drawn according to the test results. It presented a more apt and visual dispersion degree of the test results.
The test results in Table 2 and Figure 16 shows that when the membrane debris wind separator was continuously operated and the membrane debris mixture was continuously fed, the average value of the ratio of impurities in the residual film was 6.966%, which was 5.004% lower than the value of 11.97% before optimization. The calculated coefficient of variation was 7.38%, with a variance of 0.36453 [29,30]. The statistical results were less discrete. Thus, this evaluation index remained almost constant during the continuous operation of the device. Thus, the device is in a stable working condition and can maintain stable operation during long working hours. After cleaning, the residual film had to be cleaned again and subjected to other processes before the next use. Therefore, smaller soil particles adhering to the residual film could be ignored when calculating this index. Only the larger particles and the agglomerates with straw impurities adhering to them were weighed. Thus, using the optimized feeding volume and inlet structure, the film–impurity wind separator could be continuously operated, and a stable cleaning effect of the wind separator was achieved. The ratio of impurities in the residual film also remained nearly stable, and the collision force between the residual film–impurity mixture and the trommel screen inside the device was maintained at a large value. Thus, the disaggregation of the residual film–impurity mixture agglomerates was facilitated.
Overall, the inlet form and feeding quantity of the inlet of the wind separator considerably influence the cleaning performance of the whole device and the disaggregation of the residual film–impurity mixture agglomerates. The best performance was achieved using the square feed inlet. During the operation, it effectively ensured smooth feeding of the residual film–impurity mixture, and in the case of larger feeding volumes, it increased the relative collision speed between the residual film–impurity mixture and the trommel screen, improving the depolymerization effect, decreasing the ratio of impurities in the residual film, and improving the screening performance and institutional reliability of the residual film–impurity mixture wind separator.
4. Discussion
In this study, feeding amount, another important factor affecting the residual film–impurity wind separator, was determined by a thorough literature review for the design and development of similar devices. Most scholars mainly focus on structural design but neglect feeding amounts. We determined that the collision force generated when the material enters the device for the first collision is the maximum collision force during the entire cleaning process. Niu et al. [31] investigated the influence of feeding amount on the working performance of similar devices. The optimal feeding rate was determined to be 250 kg/h, and the ratio of impurities in the residual film was 8.8%. Liu [32] determined that the center of the feed inlet was 340 mm from the center of the model by simulation, but they did not point out the ratio of impurities in the residual film in this state. Kang [28] and Peng [12] studied similar devices and obtained 8.4% and 10.54% impurities in the residual films, respectively. These studies considered the same working principle of cleaning devices, except for slight differences in the overall structure sizes. However, the ratio of impurities in the residual films was >6.966%, as obtained in this study. By comparing the trash rate in the film in the different studies, the optimized feeding volume and inlet structure improved the performance of the cleaning device to some extent. Therefore, the optimized feeding amount and inlet structure were investigated. The device was operated for a long duration to test the stability of its working performance. Some of the screen holes were clogged; however, it did not cause fluctuations in the evaluation index in a short period of time. We were concerned that more sieve holes would become clogged with continued use. This will affect the working of the device. Therefore, there is an urgent need to solve the problem of clogging sieve holes in future studies.
5. Conclusions
- (1)
- In this study, we addressed the problem that a large amount of residual film–impurity mixture is not efficiently depolymerized during the operation of a residual film–impurity mixture separator. Based on the principle of residual film–impurity mixture depolymerization and the flow-solid coupling simulation method, the maximum collision force between the residual film–impurity mixture and the inside of the device was determined as the key factor affecting the mixture depolymerization.
- (2)
- Analysis of the whole feeding process revealed that when the residual film–impurity mixture separation device was in stable operation, the factors influencing the magnitude of the collision force between the residual film–impurity mixture and the device interior originated from the feed inlet position. The optimal conditions were a square inlet port and a feeding rate of 202 kg/h.
- (3)
- The above-mentioned inlet structure and feeding rate were used as standards, and machine tests were conducted. The test results showed that the average value of the ratio of impurities in the residual film was 6.966%, which was 5.004% lower than the value of 11.97% before optimization. Based on all statistical data, the coefficient of variation was calculated to be 7.38% with a variance of 0.36453. The dispersion of the statistical results was small, and the ratio of impurities in the residual film remained unchanged during the continuous operation of the film–impurity wind separator.
Author Contributions
Conceptualization, C.X. and J.K.; methodology, C.X.; software, C.X.; validation, C.X., J.K. and Q.P.; formal analysis, C.X. and J.K.; investigation, C.X., J.K., Q.P., N.W., X.W. and Y.Z.; resources, J.K. and Q.P.; data curation, C.X., J.K., Q.P., N.W. and Y.Z.; writing—original draft preparation, C.X. and Q.P.; writing—review and editing, C.X., Q.P. and J.K.; visualization, C.X.; supervision, J.K.; project administration, J.K.; funding acquisition, J.K. All authors have read and agreed to the published version of the manuscript.
Funding
This research was funded by the National Natural Science Foundation of China Projects (grant number 52175238) and the Natural Science Foundation of Shandong Province Key Projects (grant number ZR2020KE045).
Data Availability Statement
The data presented in this study are available upon request from the first author at ([email protected]).
Acknowledgments
The authors would like to thank the instructor for his help during the writing of the manuscript, as well as all reviewers who participated in the review of the manuscript.
Conflicts of Interest
The authors declare no conflict of interest.
References
- Zhang, D.Q.; Liao, Y.C.; Jia, Z.K. Research progress and development prospects of plastic film covering technology in arid areas. Agric. Res. Arid Areas 2005, 23, 208–213. [Google Scholar]
- National Bureau of Statistics. China Statistical Yearbook; China Statistical Publishing House: Beijing, China, 2020.
- Shi, Z.L.; Zhang, X.J.; Liu, X.P.; Kang, M.C.; Yao, J.T.; Guo, L. Analysis and test of the tillage layer roll-type residual film recovery mechanism. Appl. Sci. 2023, 13, 7598. [Google Scholar] [CrossRef]
- Su, Z.P.; Li, J.B.; Zhang, Z.Y.; Ren, S.X.; Shi, Y.M.; Wang, X.F. Analysis of the mechanical properties and wear characteristics of nail teeth based on sowing layer residual film recovery machine. Eng. Fail. Anal. 2023, 143, 106869. [Google Scholar] [CrossRef]
- Tang, H.X.; Zhao, Y.C. Theoretical research on the sieving of domestic waste by drum screen. Chin. J. Environ. Eng. 2007, 1, 124–127. [Google Scholar]
- Shi, X.; Niu, C.H.; Qiao, Y.Y.; Zhang, H.C.; Wang, X.N. Application of plastic trash sorting technology in separating waste plastic mulch films from impurities. Trans. Chin. Soc. Agric. Eng. 2016, 32, 22–31. [Google Scholar]
- Jiao, Y.; Zhang, X.X.; Kong, F.C.; Liu, H.S. Discrete element simulation of impact disaggregation for wet granule agglomerate. Acta Phys. Sin. 2015, 64, 328–337. [Google Scholar]
- Yurij, A.A.; Irina, L.Z.; Ruth, C.; Paula, M. Specific effect of the linear charge density of the acid polysaccharide on thermal aggregation/disaggregation processes in complex carrageenan/lysozyme systems. Food Hydrocoll. 2017, 70, 8–13. [Google Scholar]
- Zhou, Q. Numerical Simulation of Homogenizing Humidification and Pre-Dispersion Transport of Micro-Powder Limestone. Master’s Thesis, Xi’an University of Architecture and Technology, Xi’an, China, 2019. [Google Scholar]
- Zhai, Y.X.; Xiong, X.Y.; Tang, J. Impact disaggregation simulation of wet coal agglomerate using discrete element method. Coal Eng. 2019, 51, 167–171. [Google Scholar]
- Zhang, W.B.; Qi, H.Y.; You, C.F.; Xu, X.C. Mechanical analysis of agglomeration and fragmentation of particles during collisions. J. Tsinghua Univ. (Sci. Tech.) 2022, 12, 1639–1643. [Google Scholar]
- Bellocq, B.; Ruiz, T.; Delaplace, G. Screening efficiency and rolling effects of a rotating screen drum used to process wet soft agglomerates. J. Food Eng. 2017, 195, 235–246. [Google Scholar] [CrossRef]
- Peng, Q.J.; Li, C.S.; Kang, J.M.; Shi, G.K.; Zhang, H. Improved design and test on pneumatic cylinder sieve film hybrid separator. Trans. Chin. Soc. Agric. Mach. 2020, 51, 126–135. [Google Scholar]
- Jiao, Y.; Zhao, L.L. Study on Aggregation and Disaggregation Mechanism of Wet Fine Coal with Airflow Grading; China University of Mining and Technology Press: Xuzhou, China, 2019. [Google Scholar]
- Lian, G.; Thornton, C.; Adams, M.J. Discrete particle simulation of agglomerate impact coalescence. Chem. Eng. Sci. 1998, 53, 3381–3391. [Google Scholar] [CrossRef]
- Ma, C. Design and Experiment of Deep Fertilization Strip Tillage Device for Corn in Northeast China. Master’s Thesis, China Academy of Agricultural Machinery Science, Beijing, China, 2022. [Google Scholar]
- Zhang, Q.Q. Simulation Analysis of Sinking Process of Particles Falling into Water Based on Coupled EDM-CFD. Master’s Thesis, Jilin University, Changchun, China, 2014. [Google Scholar]
- Liu, X. Design and Experimental Research on Potato Conveying and Grading Device. Master’s Thesis, Northwest Agriculture and Forestry University, Xianyang, China, 2022. [Google Scholar]
- Jin, W.; Zhang, X.J.; Ding, Y.C.; Bai, S.H.; Liu, W.P.; Zhou, X.C. Experiment on suspension separation of residual film and impurity based on EDEM-Fluent coupling. Trans. Chin. Soc. Agric. Mach. 2022, 53, 89–98. [Google Scholar]
- Lu, F.Y.; Ma, X.; Tan, S.Y.; Chen, L.T.; Zeng, L.C.; An, P. Simulative calibration and experiment on main contact parameters of discrete elements for rice bud seeds. Trans. Chin. Soc. Agric. Mach. 2018, 49, 93–99. [Google Scholar]
- Ma, Q.C.; Sun, N.; Lu, A.Z.; Cao, Y.S.; Liu, J.; Tian, R.F.; Zhuang, Z.T. Design and experiments of the sequential and continuous feeding system for fresh lotus seeds with low damage. Trans. Chin. Soc. Agric. Eng. 2020, 38, 12–20. [Google Scholar]
- Xie, C.S.; Kang, J.M.; Peng, Q.J.; Lin, X.Y.; Hou, J.L. Numerical Simulation and Parameter Optimization of Trommel Screen Type Membrane and Impurity Separation Device. J. Chin. Agric. Mech. 2022. accepted. [Google Scholar]
- Kang, J.M.; Xie, C.S.; Wang, X.Y.; Chen, Y.K.; Wang, C.W.; Peng, Q.J. Design and test of sieve hole cleating device for trommel sieve type membrane miscellaneous wind separator. Trans. Chin. Soc. Agric. Mach. 2022, 53, 91–98. [Google Scholar]
- Wang, Z.C.; Li, X.Y.; Shi, H.B.; Xu, P.C.; Li, H. Water characteristic curve model for soil with residual plastic film. Trans. CSAE 2016, 32, 103–109. [Google Scholar]
- Ma, L.; Wang, Q.J. Photosynthetic and light response characteristics of spring wheat under different irrigation schedules. Trans. Chin. Soc. Agric. Mach. 2018, 49, 271–277. [Google Scholar]
- Qi, W.; Wang, C.; Zhang, Z.Y. Experimental investigation on the impact of drying–wetting cycles on the shrink–swell behavior of clay loam in farmland. Agriculture 2022, 12, 245. [Google Scholar] [CrossRef]
- Lai, Q.H.; Gao, X.J.; Zhang, Z.H. Simulation and experiment of seed-filling performance of pneumatic cylinder seed-metering device for Panax notoginseng. Trans. Chin. Soc. Agric. Mach. 2016, 47, 27–37. [Google Scholar]
- Wang, X.Y.; Wang, R.M.; Li, X.Q.; Wang, M.F.; Li, S.C. Design and test of humidification system for potato ventilated storage. Trans. Chin. Soc. Agric. Mach. 2021, 52, 358–366. [Google Scholar]
- Kang, J.M.; Zhang, H.; Zhang, G.H.; Du, H.Y.; Peng, Q.J.; Song, Y.M. Aerodynamic characteristics of residual film materials and test of membrane separation device. J. Chin. Agric. Mech. 2020, 41, 167–172. [Google Scholar]
- Zhang, H. Design and Experimental Study on Drum-Sieve-Based Film/Impurity Separation Device. Master’s Thesis, Shandong University of Technology, Ji’nan, China, 2019. [Google Scholar]
- Niu, C.H.; Shi, X.; Jiang, Y.X.; Yang, H.M.; Qiao, Y.Y. Design and test on type of waste plastic mulch films and impurities winnowing machine. Xinjiang Agric. Mech. 2018, 5, 23–25. [Google Scholar]
- Liu, M.X. Numerical Simulation Analysis of Membrane Stalk Separation Device Based on Fluent. Master’s Thesis, Xinjiang University, Urumqi, China, 2017. [Google Scholar]
Figure 1.
Process of resource utilization of waste plastic film.

Figure 2.
Types of residual film recovery machinery. (a) straw-returning residual film recycling baler; (b) standing pole-type residual film recycling machine.
Figure 2.
Types of residual film recovery machinery. (a) straw-returning residual film recycling baler; (b) standing pole-type residual film recycling machine.

Figure 3.
Flow chart of research content.

Figure 4.
Tumbler sieve-type film trash wind separator: (1) centrifugal fan; (2) duct; (3) inlet; (4) upper seal cover; (5) pipe support frame; (6) centrifugal blower; (7) tumbler screen; (8) spiral blade; (9) screen hole clearing device; (10) film collection box; (11) support roller; (12) frame; (13) lower seal cover; (14) controller; (15) motor; (16) conveying device; (17) spacer conveyor.

Figure 5.
Operating principle of the tumbler screen-type film miscellaneous wind separator.

Figure 6.
Membrane heterogeneous mixture agglomeration principle.

Figure 7.
Model of residual film particles. (a) Arrangement pattern of residual film particles; (b) deformation effect after force; (c) soil particles; (d) straw pellets.
Figure 7.
Model of residual film particles. (a) Arrangement pattern of residual film particles; (b) deformation effect after force; (c) soil particles; (d) straw pellets.

Figure 8.
Experimental validation of discrete element models. (a) stacking angle simulation test; (b) suspension speed verification test.
Figure 8.
Experimental validation of discrete element models. (a) stacking angle simulation test; (b) suspension speed verification test.

Figure 9.
Simulation test: (a) schematic diagram of fluid-solid coupling test; (b) force diagram of different positions of tumbler screen at different moments.
Figure 9.
Simulation test: (a) schematic diagram of fluid-solid coupling test; (b) force diagram of different positions of tumbler screen at different moments.

Figure 10.
Force analysis of residual film–impurity mixtures. Note: l is the length of the inclined section of the inlet (m); v1 is the instantaneous speed of the residual film–impurity mixture into the trommel screen (m/s); and v1’ is the speed of the residual film–impurity mixture fed into the inlet (m/s).

Figure 11.
Different forms of inlet area.

Figure 12.
Feed inlet 3D model: (a) square; (b) oval; and (c) semi-circular inlets.

Figure 13.
Trommel screen forces at different feed rates.

Figure 14.
Curve-fitting graph.

Figure 15.
Inlet structure pattern and membrane separation verification test.

Figure 16.
Radar map of test results.


Table 1.
Intrinsic parameters of the materials.
| Materials | Intrinsic Parameters | Value |
|---|---|---|
| Residual film | Dimensions (length × width × thickness)/mm × mm × mm | 100 × 30 × 0.1 |
| Poisson’s ratio | 0.23 | |
| Shear modulus/Pa | 1.2 × 10⁶ | |
| Density/kg/m3 | 104 | |
| Straw | Dimensions (diameter × length)/mm × mm | 8 × 80 |
| Poisson’s ratio | 0.35 | |
| Shear modulus/Pa | 1.37 × 10⁸ | |
| Density/kg/m3 | 257.8 | |
| Soil | Equivalent particle size/mm | 2 |
| Poisson’s ratio | 0.4 | |
| Shear modulus/Pa | 1.6 × 10⁸ | |
| Density/kg/m3 | 1430 |
Table 2.
Test results.
| Number of Test Groups | 1 | 2 | 3 | 4 | 5 | |
|---|---|---|---|---|---|---|
| Evaluation Index | ||||||
| Ratio of impurities in the residual film/% | 7.27 | 7.56 | 6.77 | 6.21 | 7.02 | |
| Coefficient of variation/% | 7.38 | |||||
| Variance | 0.36453 | |||||
Disclaimer/Publisher’s Note: The statements, opinions and data contained in all publications are solely those of the individual author(s) and contributor(s) and not of MDPI and/or the editor(s). MDPI and/or the editor(s) disclaim responsibility for any injury to people or property resulting from any ideas, methods, instructions or products referred to in the content. |
© 2023 by the authors. Licensee MDPI, Basel, Switzerland. This article is an open access article distributed under the terms and conditions of the Creative Commons Attribution (CC BY) license (https://creativecommons.org/licenses/by/4.0/).
Share and Cite
MDPI and ACS Style
Kang, J.; Xie, C.; Peng, Q.; Wang, N.; Wang, X.; Zhang, Y. Analysis of Feed Inlet and Optimal Feeding Amount of Waste Ground Film Impurity Removal Equipment. Appl. Sci. 2023, 13, 9905. https://doi.org/10.3390/app13179905
AMA Style
Kang J, Xie C, Peng Q, Wang N, Wang X, Zhang Y. Analysis of Feed Inlet and Optimal Feeding Amount of Waste Ground Film Impurity Removal Equipment. Applied Sciences. 2023; 13(17):9905. https://doi.org/10.3390/app13179905
Chicago/Turabian StyleKang, Jianming, Chenshuo Xie, Qiangji Peng, Nannan Wang, Xiaoyu Wang, and Yaoli Zhang. 2023. "Analysis of Feed Inlet and Optimal Feeding Amount of Waste Ground Film Impurity Removal Equipment" Applied Sciences 13, no. 17: 9905. https://doi.org/10.3390/app13179905
Note that from the first issue of 2016, this journal uses article numbers instead of page numbers. See further details here.
Article Metrics
Article metric data becomes available approximately 24 hours after publication online.