
Analytics 2023, 2(3), 656-675; https://doi.org/10.3390/analytics2030036 - 21 Aug 2023
Abstract
►
Show Figures
This paper addresses the practical problem of scheduling operating room (OR) elective surgeries to minimize the likelihood of surgical delays caused by the unavailability of capacity for patient recovery in a central post-anesthesia care unit (PACU). We segregate patients according to their patterns
[...] Read more.
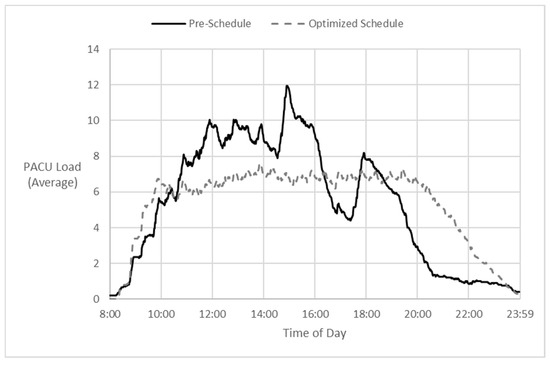
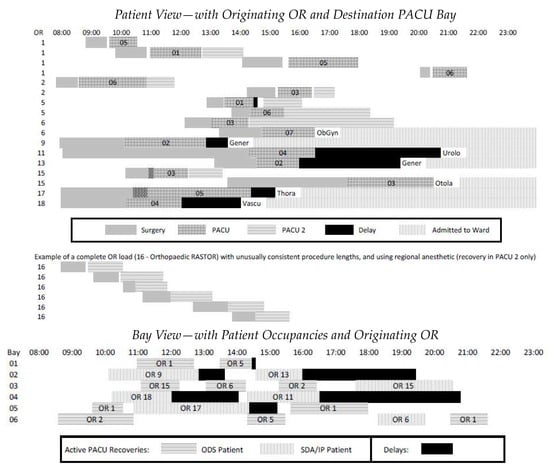
This paper addresses the practical problem of scheduling operating room (OR) elective surgeries to minimize the likelihood of surgical delays caused by the unavailability of capacity for patient recovery in a central post-anesthesia care unit (PACU). We segregate patients according to their patterns of flow through a multi-stage perioperative system and use characteristics of surgery type and surgeon booking times to predict time intervals for patient procedures and subsequent recoveries. Working with a hospital in which 50+ procedures are performed in 15+ ORs most weekdays, we develop a constraint programming (CP) model that takes the hospital’s elective surgery pre-schedule as input and produces a recommended alternate schedule designed to minimize the expected peak number of patients in the PACU over the course of the day. Our model was developed from the hospital’s data and evaluated through its application to daily schedules during a testing period. Schedules generated by our model indicated the potential to reduce the peak PACU load substantially, 20-30% during most days in our study period, or alternatively reduce average patient flow time by up to 15% given the same PACU peak load. We also developed tools for schedule visualization that can be used to aid management both before and after surgery day; plan PACU resources; propose critical schedule changes; identify the timing, location, and root causes of delay; and to discern the differences in surgical specialty case mixes and their potential impacts on the system. This work is especially timely given high surgical wait times in Ontario which even got worse due to the COVID-19 pandemic.
Full article
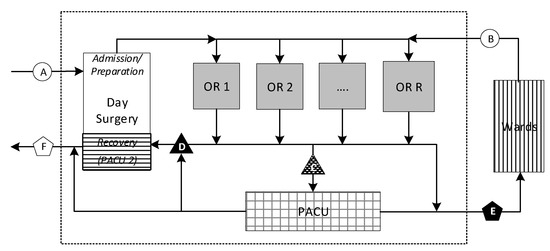
Figure 1


