


Data 2023, 8(9), 140; https://doi.org/10.3390/data8090140 (registering DOI) - 31 Aug 2023
Abstract
The availability of code snippets in online repositories like GitHub has led to an uptick in code reuse, this way further supporting an open-source component-based development paradigm. The likelihood of code reuse rises when the code components or snippets are of high quality,
[...] Read more.
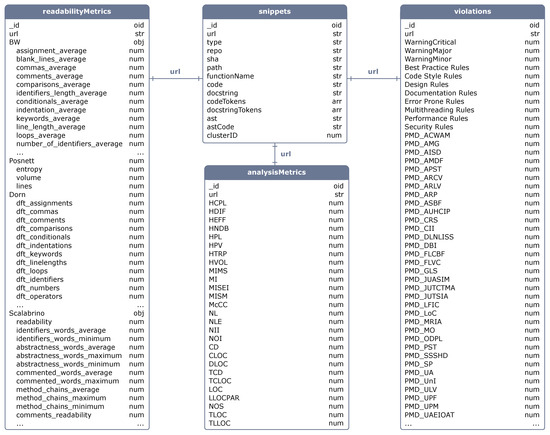
The availability of code snippets in online repositories like GitHub has led to an uptick in code reuse, this way further supporting an open-source component-based development paradigm. The likelihood of code reuse rises when the code components or snippets are of high quality, especially in terms of readability, making their integration and upkeep simpler. Toward this direction, we have developed a dataset of code snippets that takes into account both the functional and the quality characteristics of the snippets. The dataset is based on the CodeSearchNet corpus and comprises additional information, including static analysis metrics, code violations, readability assessments, and source code similarity metrics. Thus, using this dataset, both software researchers and practitioners can conveniently find and employ code snippets that satisfy diverse functional needs while also demonstrating excellent readability and maintainability.
Full article
(This article belongs to the Section Information Systems and Data Management)
►
Show Figures

Figure 1


