


ISPRS Int. J. Geo-Inf. 2023, 12(9), 361; https://doi.org/10.3390/ijgi12090361 (registering DOI) - 01 Sep 2023
Abstract
►
Show Figures
With the growing availability of remote sensing orbital spatial data, the applications of machine learning (ML) algorithms have been leveraging the field of process automation in image classification. The present work aimed to evaluate the precision and accuracy of ML algorithms in the
[...] Read more.
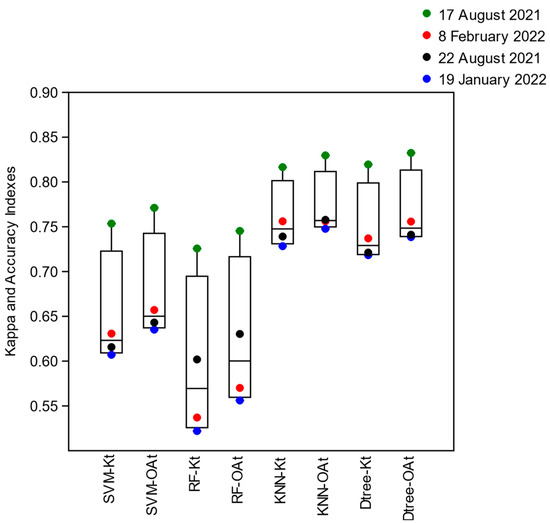
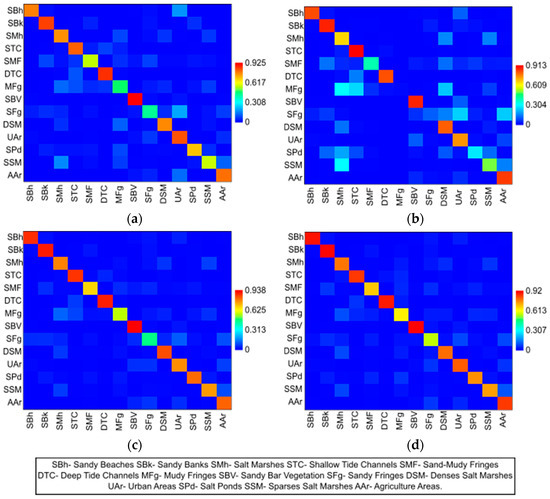
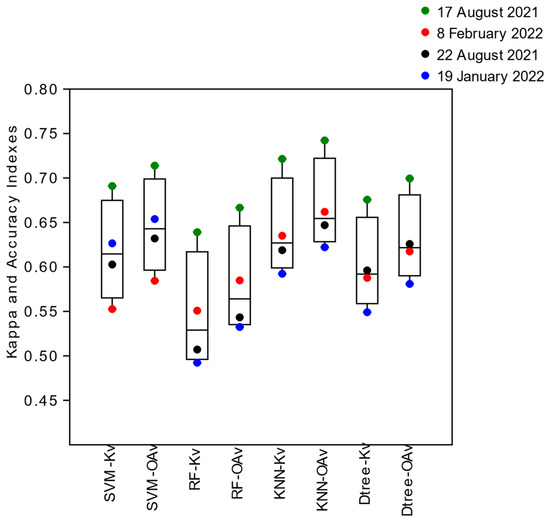
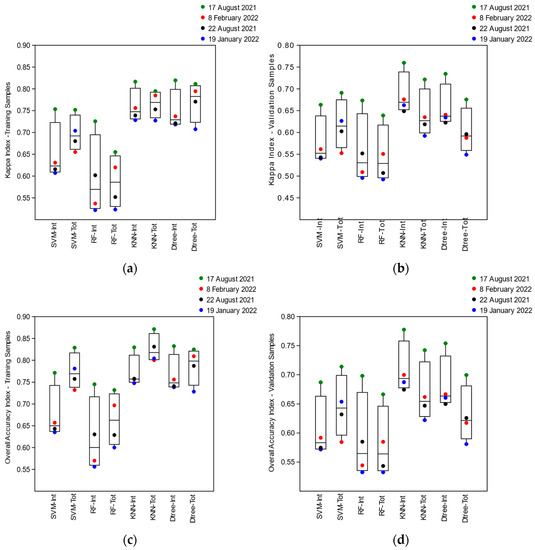
With the growing availability of remote sensing orbital spatial data, the applications of machine learning (ML) algorithms have been leveraging the field of process automation in image classification. The present work aimed to evaluate the precision and accuracy of ML algorithms in the classification of Sentinel 2A/2B images from an area of high environmental dynamics, such as Ria Formosa (Algarve, Portugal). The images were submitted to classification by groups of ML algorithms such as the Support Vector Machine (SVM), Random Forest (RF), K-Nearest Neighbors (KNN), and Decision Tree (DT). The Orfeo Toolbox (OTB) open-source programming package made the algorithms available. Ten samples were collected for each of the 14 land use and cover classes in the Ria Formosa area, totaling 140 samples. Of these, 70% were for training and 30% for validating the classification. The evaluation metrics used were the class discrimination measures: Recall (R), the Global Kappa Index (k), and the General Accuracy Index (OA). The results showed that the KNN and DT algorithms demonstrated a greater discrimination capacity for most classes (. SVM and RF significantly improved class discrimination when using larger samples for training. Merging the classified images significantly improved the classification accuracy, ranging from 71% to 81%. This evaluation made it possible to define sets of ML algorithms sensitive to change detection for mapping and monitoring dynamic environments.
Full article
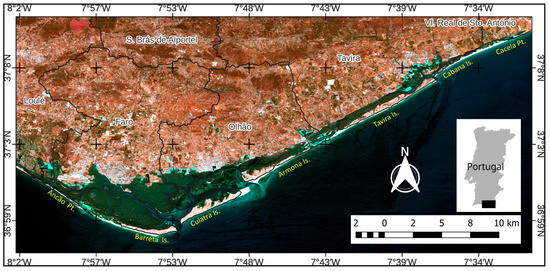
Figure 1


.jpg)


